| Param | Original file | Final file |
|---|---|---|
| Filename | modeM0/AS1A14_060T01_9000006556_56552cztM0_level2.fits | modeM0/AS1A14_060T01_9000006556_56552cztM0_level2_quad_clean.evt |
| Size (bytes) | 488,969,280 | 93,263,040 |
| Size | 466.3 MB | 88.9 MB |
| Events in quadrant A | 4,086,312 | 631,619 |
| Events in quadrant B | 6,414,818 | 568,399 |
| Events in quadrant C | 3,406,150 | 610,128 |
| Events in quadrant D | 3,685,607 | 558,677 |
| Mode M0 | |||
|---|---|---|---|
| Quadrant | BADHDUFLAG | Total packets | Discarded packets |
| A | 0 | 16625 | 3 |
| B | 0 | 23626 | 2 |
| C | 0 | 14603 | 2 |
| D | 0 | 15487 | 2 |
| Mode M9 | |||
|---|---|---|---|
| Quadrant | BADHDUFLAG | Total packets | Discarded packets |
| A | 0 | 21 | 0 |
| B | 0 | 21 | 0 |
| C | 0 | 22 | 0 |
| D | 0 | 22 | 0 |
| Mode SS | |||
|---|---|---|---|
| Quadrant | BADHDUFLAG | Total packets | Discarded packets |
| A | 0 | 132 | 0 |
| B | 0 | 132 | 0 |
| C | 0 | 132 | 0 |
| D | 0 | 132 | 0 |
| Quadrant | Total seconds | Saturated seconds | Saturation percentage |
|---|---|---|---|
| A | 6526 | 105 | 1.608949% |
| B | 6526 | 1332 | 20.410665% |
| C | 6526 | 53 | 0.812136% |
| D | 6526 | 153 | 2.344468% |
Noise dominated data is calculated using 1-second bins in cleaned event files. If a bin has >2000 counts, and if more than 50% of those come from <1% of pixels, then it is considered to be noise-dominated and hence unusable.
| Quadrant | # 1 sec bins | Bins with >0 counts | Bins with >2000 counts | High rate bins dominated by noise | Noise dominated (total time) | Noise dominated (detector-on time) | Marked lightcurve |
|---|---|---|---|---|---|---|---|
| A | 7586 | 6527 | 83 | 83 | 1.09% | 1.27% | 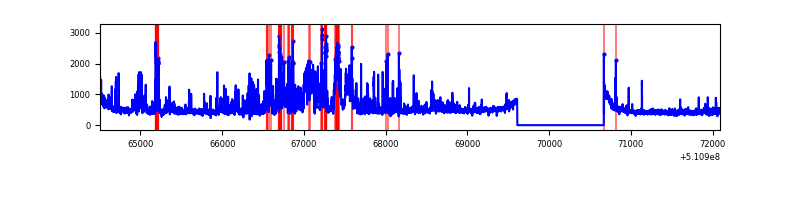 |
| B | 7586 | 6527 | 880 | 880 | 11.60% | 13.48% | 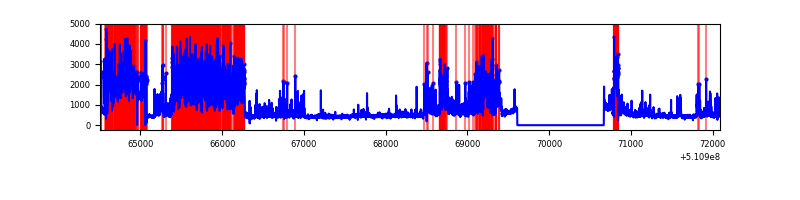 |
| C | 7586 | 6527 | 25 | 25 | 0.33% | 0.38% | 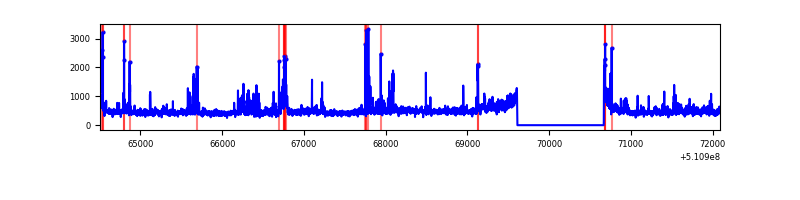 |
| D | 7586 | 6527 | 118 | 118 | 1.56% | 1.81% | 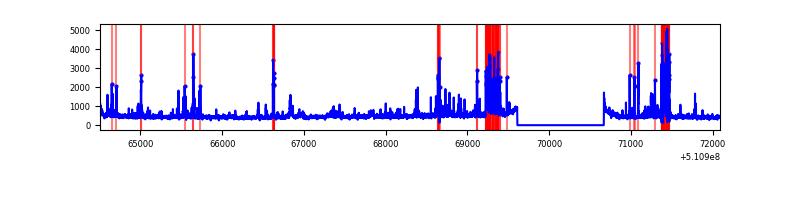 |
Top three noisy pixels from each quadrant. If the there are fewer than three noisy pixels in the level2.evt file, extra rows are filled as -1
| Pixel properties | Quadrant properties | ||||||
|---|---|---|---|---|---|---|---|
| Quadrant | DetID | PixID | Counts | Sigma | Mean | Median | Sigma |
| A | 4 | 95 | 605547 | 3374.12 | 720 | 701 | 179.3 |
| A | 8 | 249 | 214566 | 1193.04 | 720 | 701 | 179.3 |
| A | 3 | 45 | 185074 | 1028.52 | 720 | 701 | 179.3 |
| B | 5 | 172 | 2745534 | 19480.89 | 654 | 629 | 140.9 |
| B | 5 | 185 | 618185 | 4382.86 | 654 | 629 | 140.9 |
| B | 4 | 206 | 197890 | 1399.98 | 654 | 629 | 140.9 |
| C | 12 | 252 | 287207 | 1485.64 | 706 | 702 | 192.8 |
| C | 9 | 38 | 185096 | 956.16 | 706 | 702 | 192.8 |
| C | 13 | 3 | 119766 | 617.39 | 706 | 702 | 192.8 |
| D | 2 | 249 | 271850 | 1371.53 | 690 | 659 | 197.7 |
| D | 2 | 207 | 231077 | 1165.32 | 690 | 659 | 197.7 |
| D | 2 | 31 | 128986 | 649.0 | 690 | 659 | 197.7 |
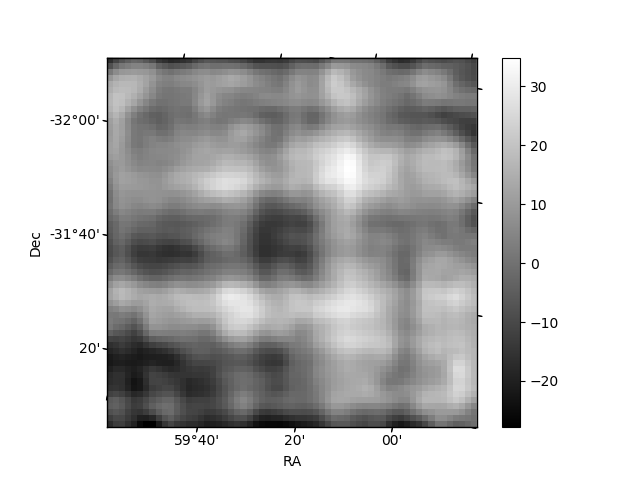
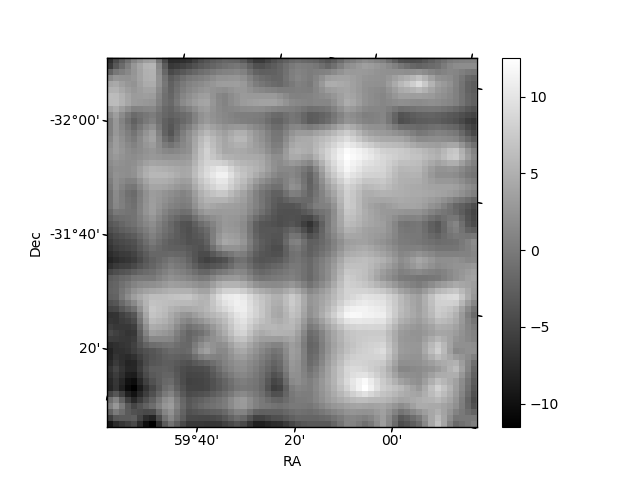
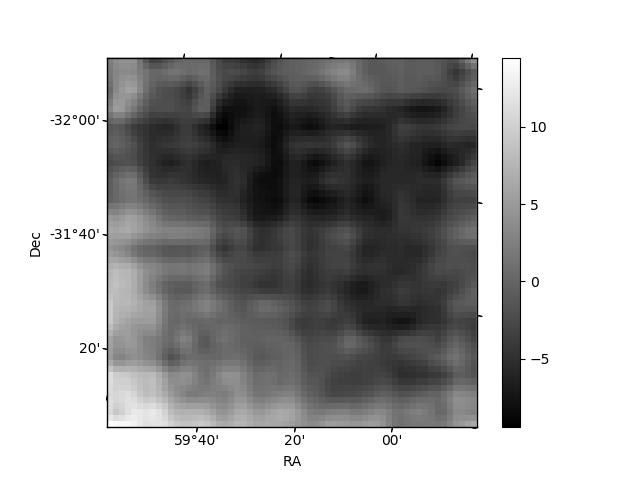
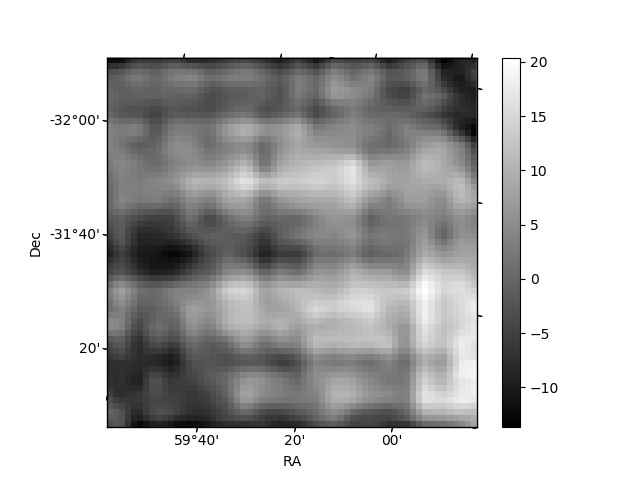
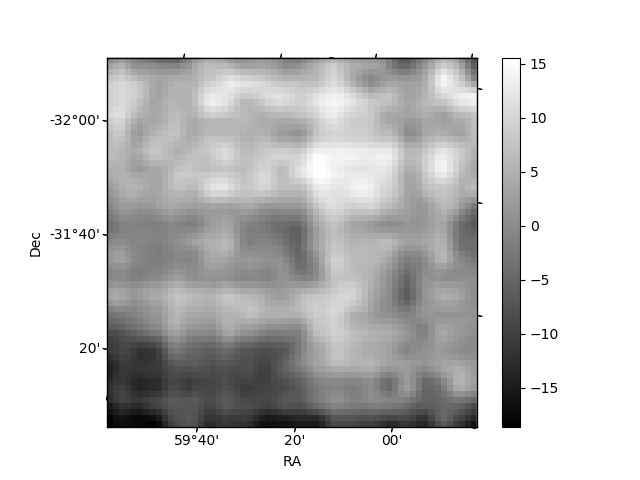
Histogram calculated using DETX and DETY for each event in the final _common_clean file
| Quadrant A | 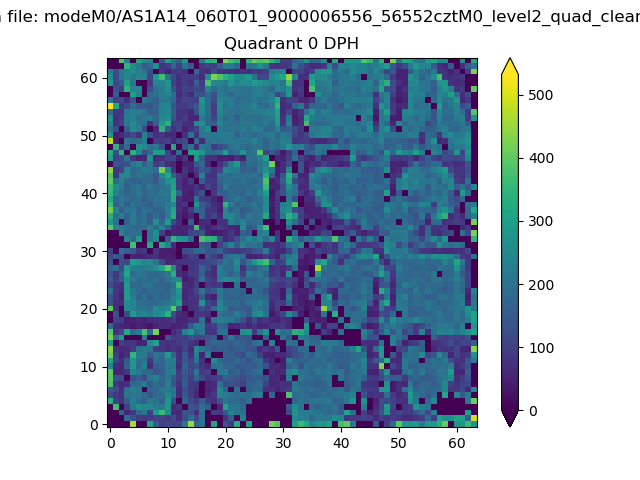 |
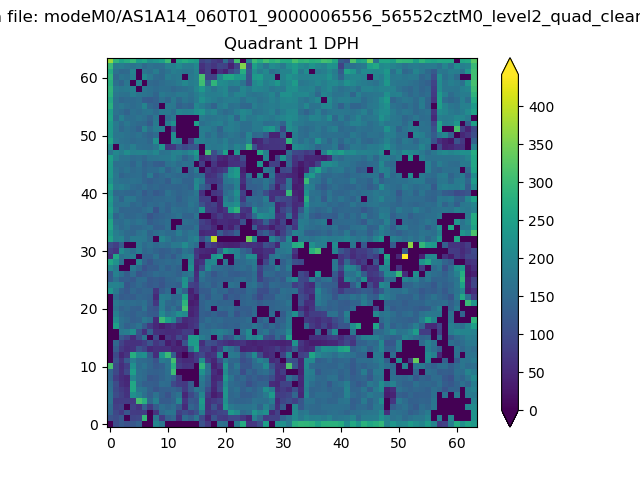 |
Quadrant B |
|---|---|---|---|
| Quadrant D | 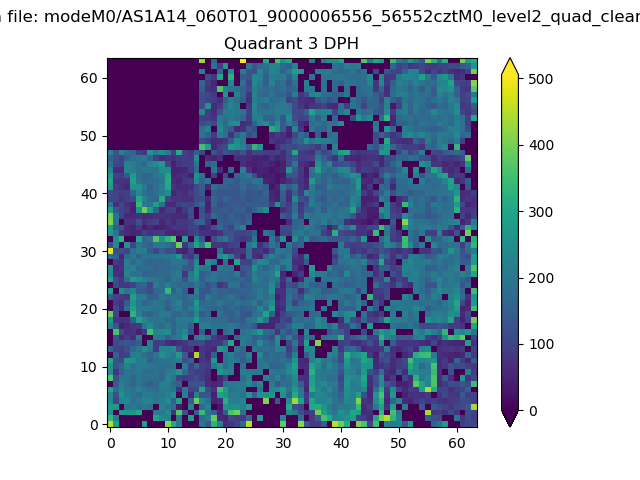 |
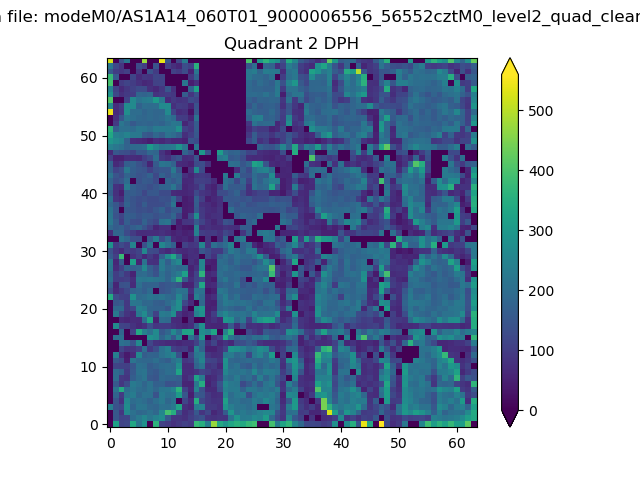 |
Quadrant C |
| Plot type | Count rate plots | Images |
|---|---|---|
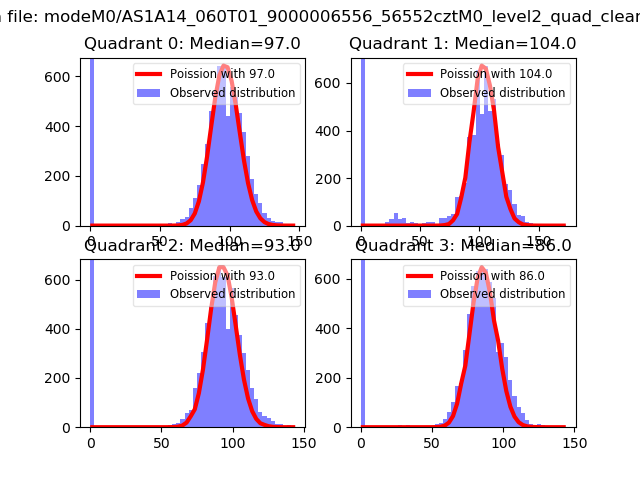
| Comparison with Poisson distribution Blue bars denote a histogram of data divided into 1 sec bins. Red curve is a Poisson curve with rate = median count rate of data. |
 |
 |
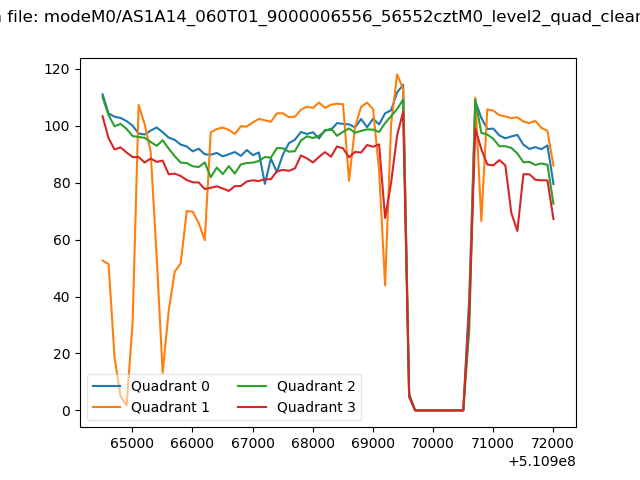
| Quadrant-wise count rates Data is divided into 100 sec bins |
 |
|
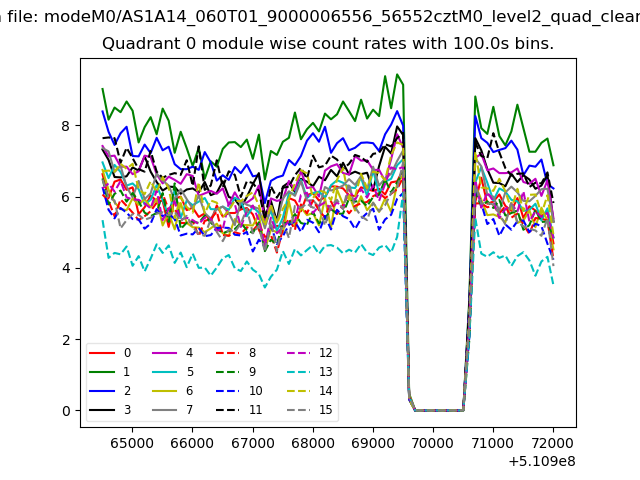
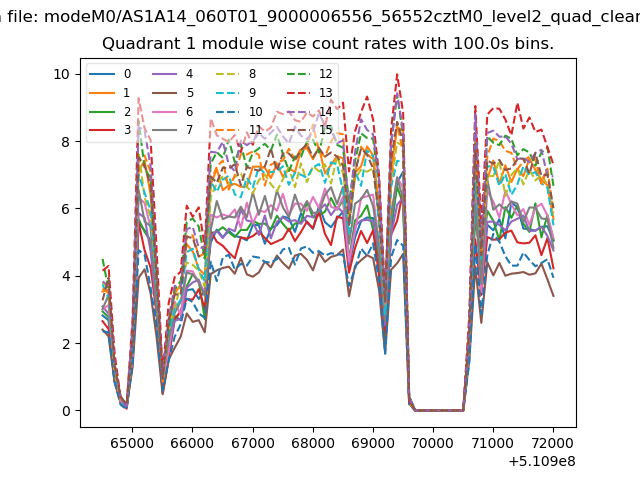
| Module-wise count rates for Quadrant A Data is divided into 100 sec bins |
 |
 |
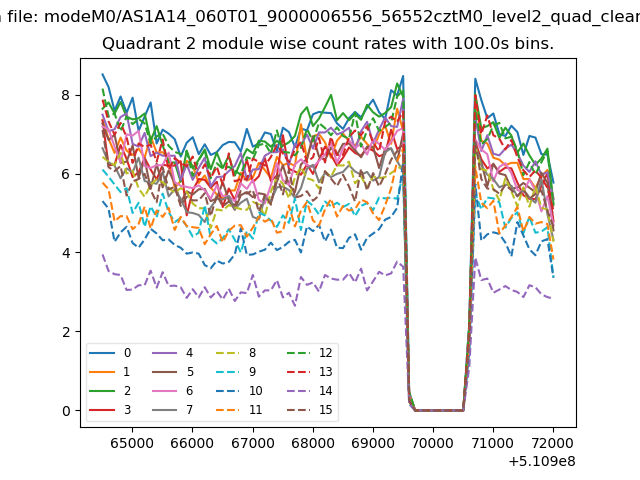
| Module-wise count rates for Quadrant B Data is divided into 100 sec bins |
 |
 |
| Module-wise count rates for Quadrant C Data is divided into 100 sec bins |
 |
 |
| Module-wise count rates for Quadrant D Data is divided into 100 sec bins |
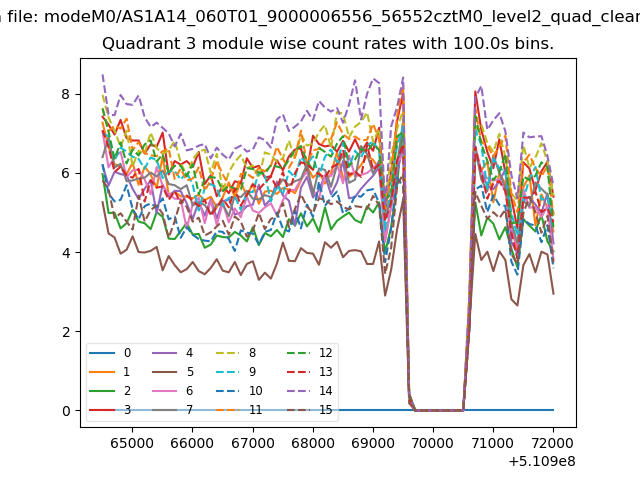 |
 |
| Parameter | Plot |
|---|---|
| CZT HV Monitor | 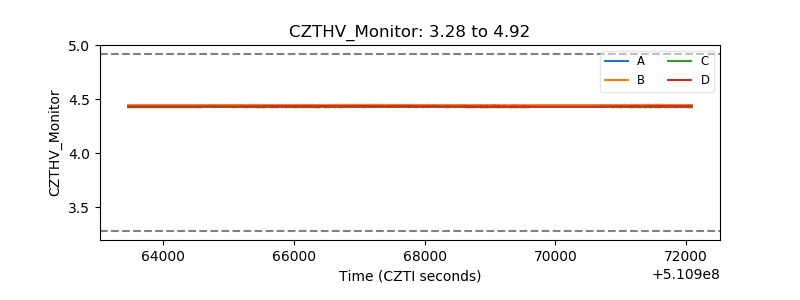 |
| D_VDD | 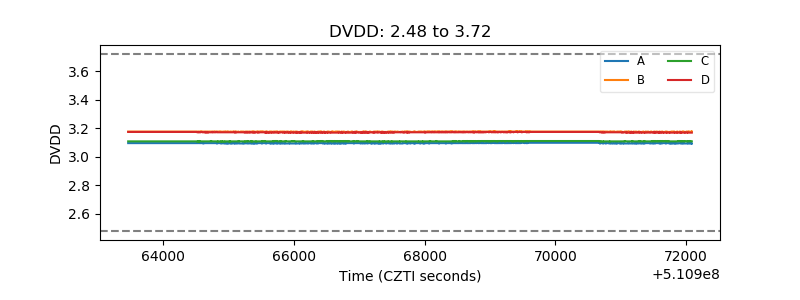 |
| Temperature 1 | 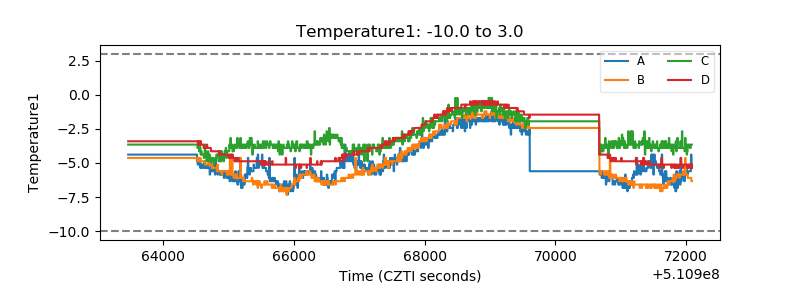 |
| Veto HV Monitor | 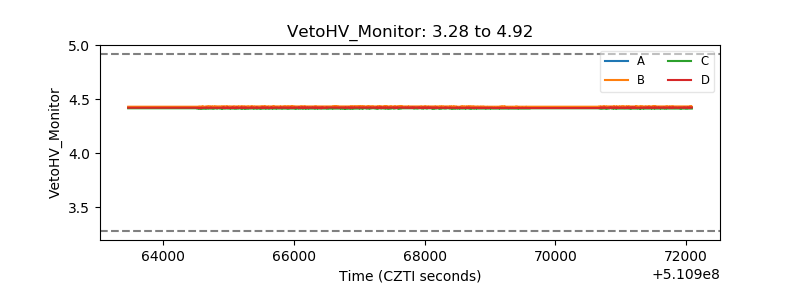 |
| Veto LLD | 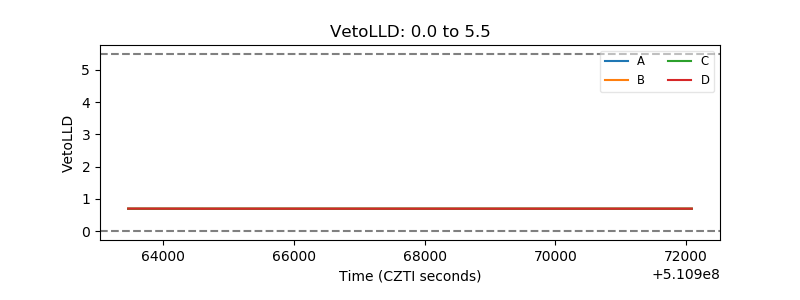 |
| Alpha Counter | 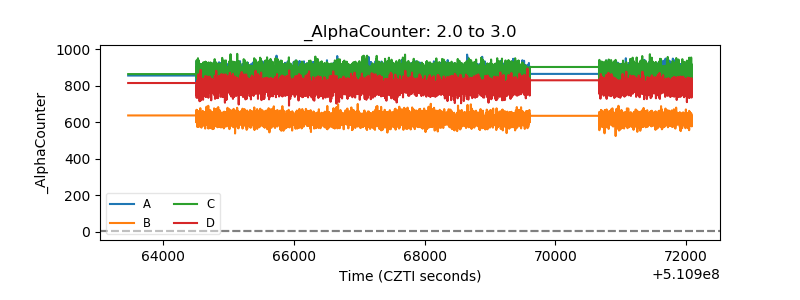 |
| _CPM_Rate | 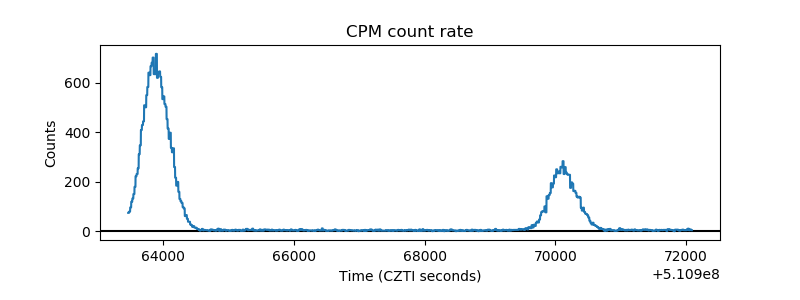 |
| CZT Counter | 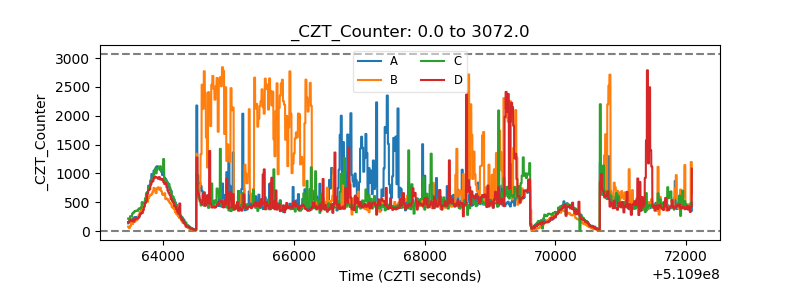 |
| +2.5 Volts monitor |  |
| +5 Volts monitor |  |
| _ROLL_ROT | 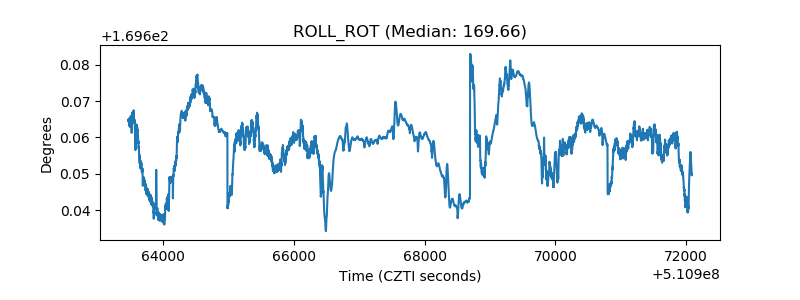 |
| _Roll_DEC | 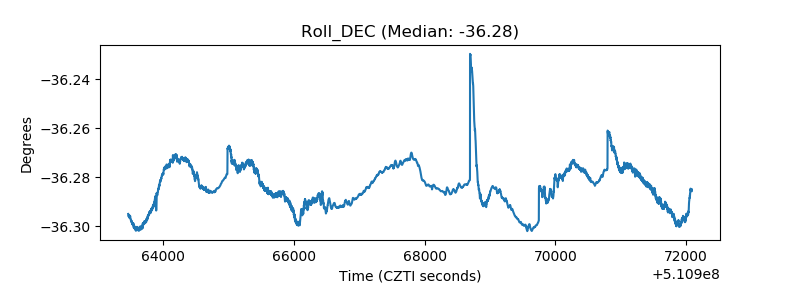 |
| _Roll_RA | 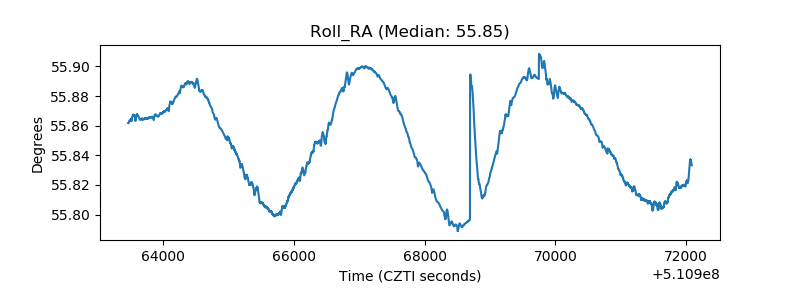 |
| Veto Counter | 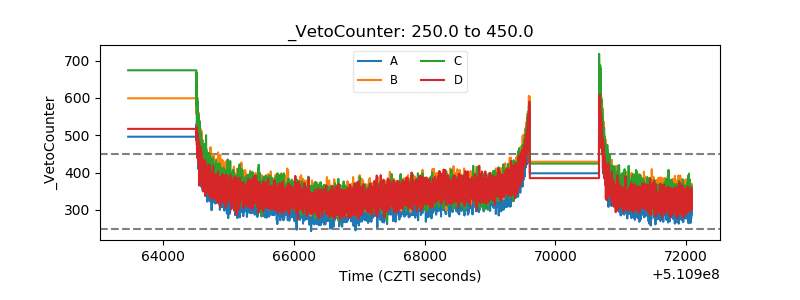 |