| Param | Original file | Final file |
|---|---|---|
| Filename | modeM0/AS1A14_060T01_9000006556_56553cztM0_level2.fits | modeM0/AS1A14_060T01_9000006556_56553cztM0_level2_quad_clean.evt |
| Size (bytes) | 514,103,040 | 100,990,080 |
| Size | 490.3 MB | 96.3 MB |
| Events in quadrant A | 3,366,835 | 674,917 |
| Events in quadrant B | 6,492,081 | 659,668 |
| Events in quadrant C | 4,202,197 | 640,481 |
| Events in quadrant D | 4,418,595 | 589,004 |
| Mode M0 | |||
|---|---|---|---|
| Quadrant | BADHDUFLAG | Total packets | Discarded packets |
| A | 0 | 15063 | 2 |
| B | 0 | 24249 | 2 |
| C | 0 | 17392 | 3 |
| D | 0 | 18143 | 2 |
| Mode M9 | |||
|---|---|---|---|
| Quadrant | BADHDUFLAG | Total packets | Discarded packets |
| A | 0 | 14 | 0 |
| B | 0 | 15 | 0 |
| C | 0 | 15 | 0 |
| D | 0 | 15 | 0 |
| Mode SS | |||
|---|---|---|---|
| Quadrant | BADHDUFLAG | Total packets | Discarded packets |
| A | 0 | 144 | 0 |
| B | 0 | 144 | 0 |
| C | 0 | 144 | 0 |
| D | 0 | 144 | 0 |
| Quadrant | Total seconds | Saturated seconds | Saturation percentage |
|---|---|---|---|
| A | 7089 | 52 | 0.733531% |
| B | 7089 | 923 | 13.020172% |
| C | 7088 | 137 | 1.932844% |
| D | 7088 | 254 | 3.583521% |
Noise dominated data is calculated using 1-second bins in cleaned event files. If a bin has >2000 counts, and if more than 50% of those come from <1% of pixels, then it is considered to be noise-dominated and hence unusable.
| Quadrant | # 1 sec bins | Bins with >0 counts | Bins with >2000 counts | High rate bins dominated by noise | Noise dominated (total time) | Noise dominated (detector-on time) | Marked lightcurve |
|---|---|---|---|---|---|---|---|
| A | 7869 | 7090 | 14 | 14 | 0.18% | 0.20% | 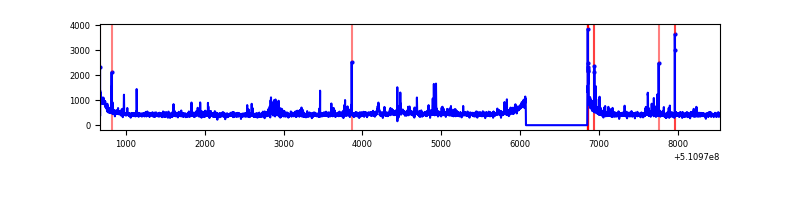 |
| B | 7869 | 7089 | 557 | 557 | 7.08% | 7.86% | 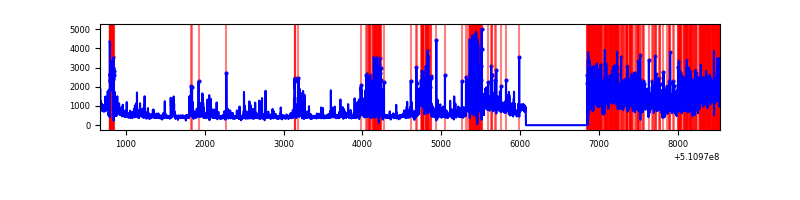 |
| C | 7868 | 7089 | 100 | 100 | 1.27% | 1.41% | 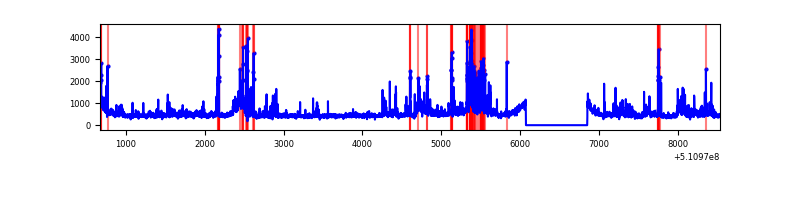 |
| D | 7868 | 7089 | 191 | 191 | 2.43% | 2.69% | 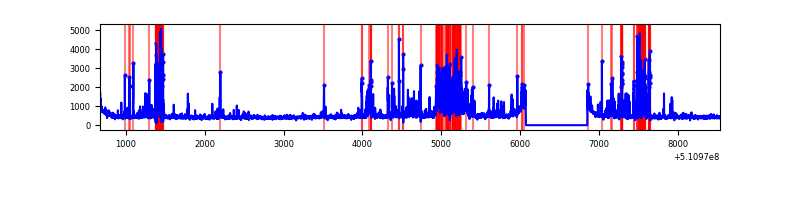 |
Top three noisy pixels from each quadrant. If the there are fewer than three noisy pixels in the level2.evt file, extra rows are filled as -1
| Pixel properties | Quadrant properties | ||||||
|---|---|---|---|---|---|---|---|
| Quadrant | DetID | PixID | Counts | Sigma | Mean | Median | Sigma |
| A | 3 | 45 | 96722 | 497.06 | 781 | 762 | 193.1 |
| A | 11 | 31 | 55419 | 283.11 | 781 | 762 | 193.1 |
| A | 8 | 249 | 48224 | 245.85 | 781 | 762 | 193.1 |
| B | 5 | 172 | 2484318 | 15610.27 | 742 | 715 | 159.1 |
| B | 4 | 206 | 501986 | 3150.65 | 742 | 715 | 159.1 |
| B | 5 | 185 | 174073 | 1089.61 | 742 | 715 | 159.1 |
| C | 12 | 252 | 528701 | 2524.19 | 761 | 752 | 209.2 |
| C | 6 | 223 | 429542 | 2050.1 | 761 | 752 | 209.2 |
| C | 9 | 38 | 87139 | 413.03 | 761 | 752 | 209.2 |
| D | 2 | 249 | 726863 | 3418.51 | 747 | 715 | 212.4 |
| D | 2 | 207 | 225033 | 1056.03 | 747 | 715 | 212.4 |
| D | 8 | 240 | 103052 | 481.77 | 747 | 715 | 212.4 |
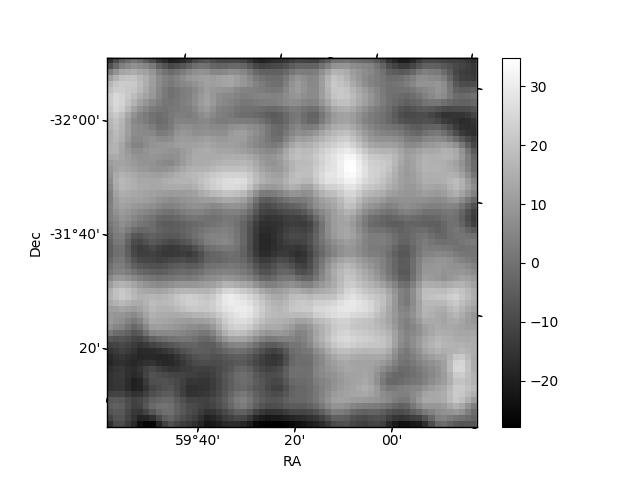
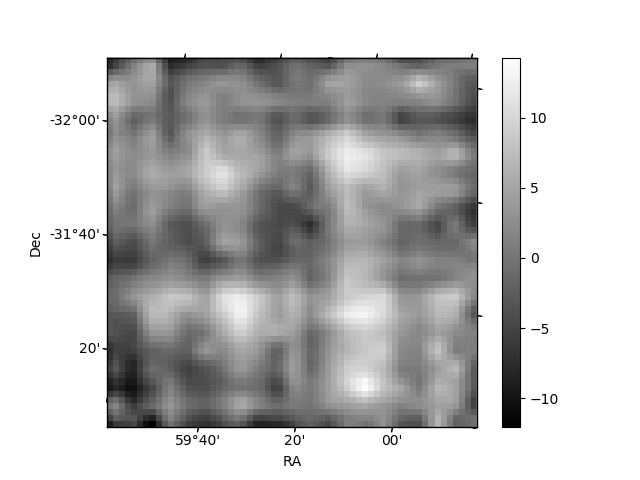
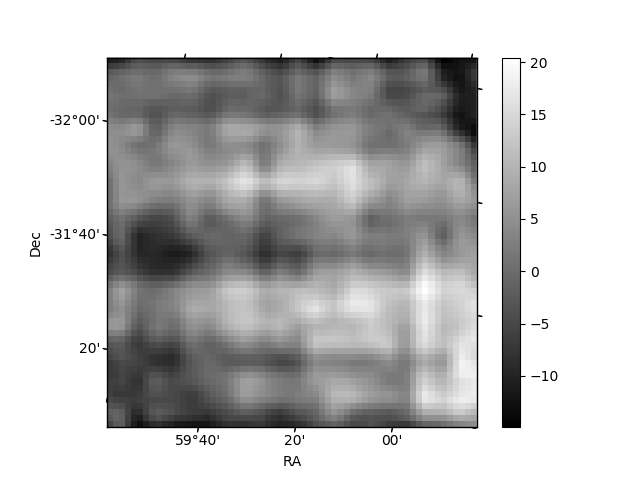
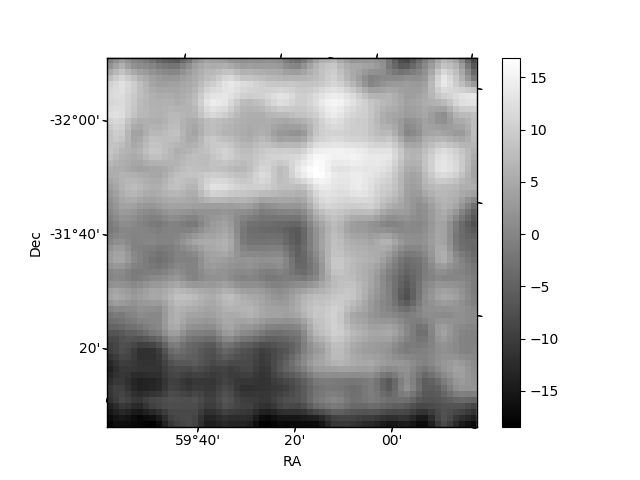
Histogram calculated using DETX and DETY for each event in the final _common_clean file
| Quadrant A | 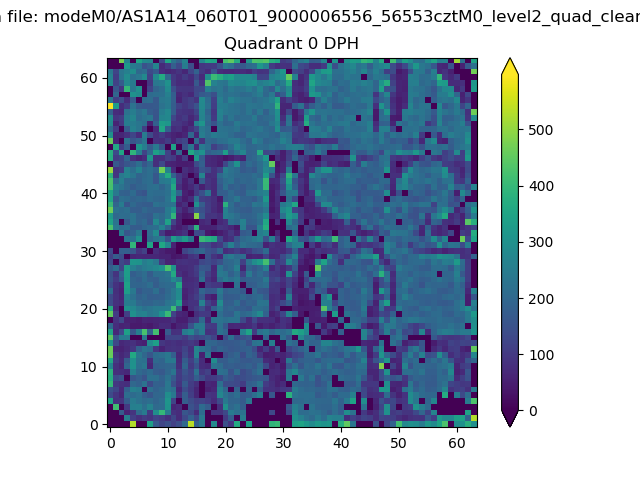 |
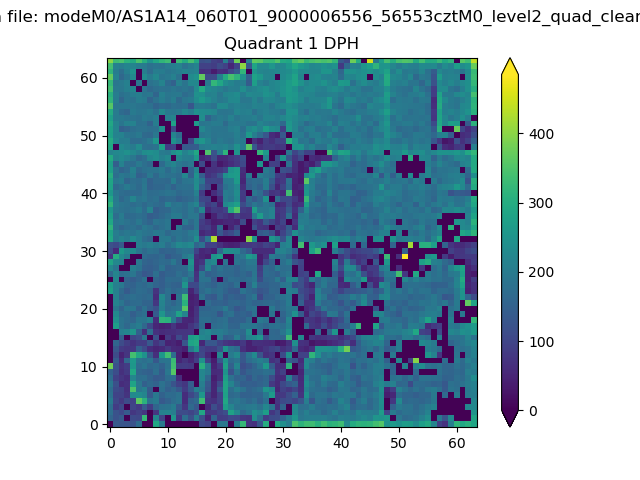 |
Quadrant B |
|---|---|---|---|
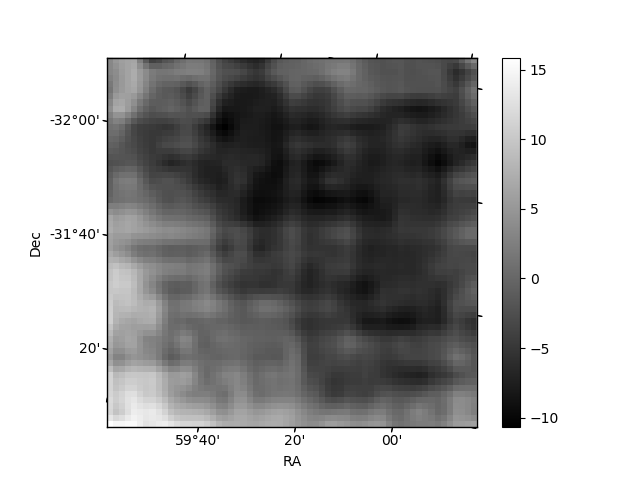
| Quadrant D | 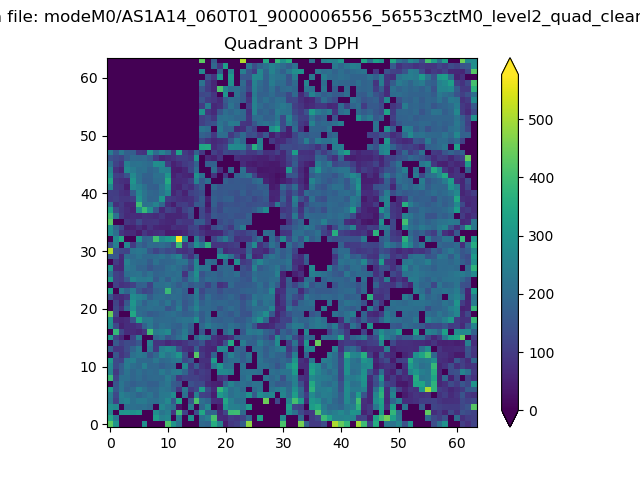 |
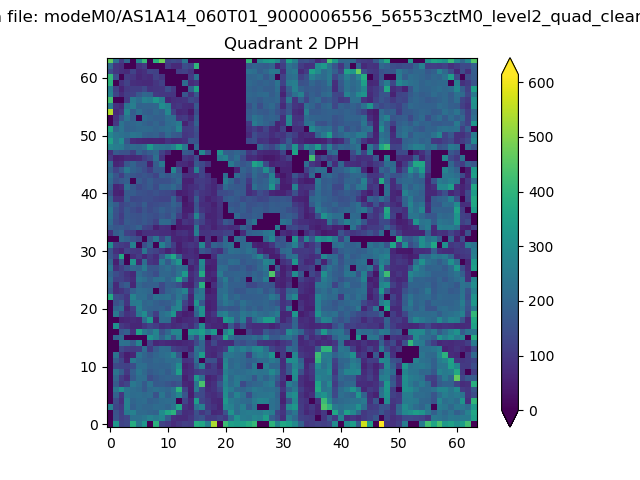 |
Quadrant C |
| Plot type | Count rate plots | Images |
|---|---|---|
| Comparison with Poisson distribution Blue bars denote a histogram of data divided into 1 sec bins. Red curve is a Poisson curve with rate = median count rate of data. |
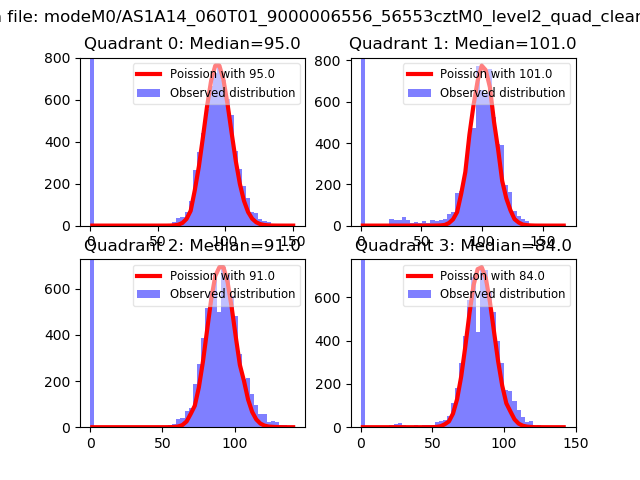 |
 |
| Quadrant-wise count rates Data is divided into 100 sec bins |
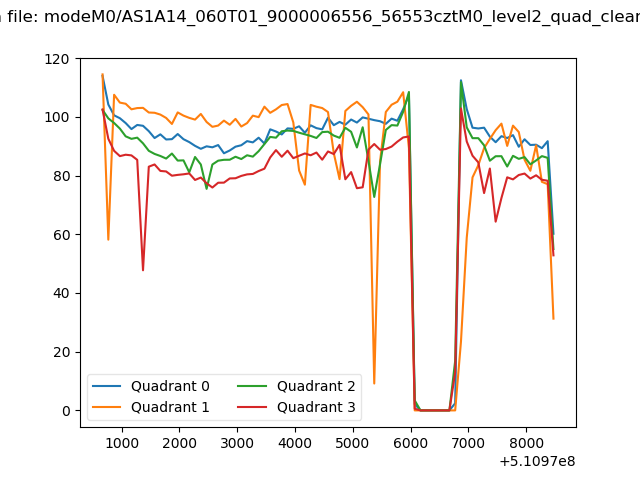 |
|
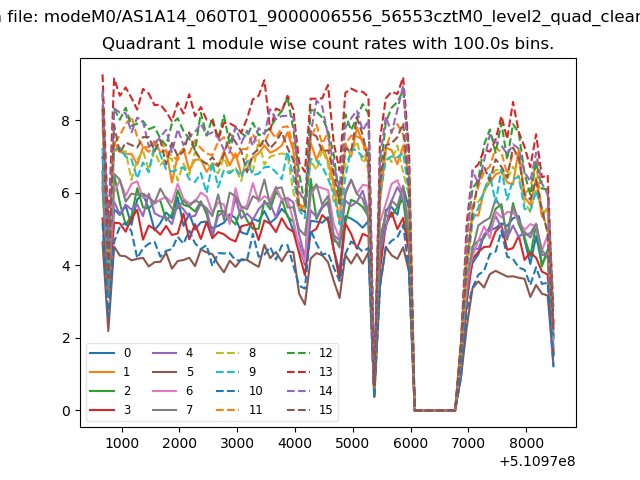
| Module-wise count rates for Quadrant A Data is divided into 100 sec bins |
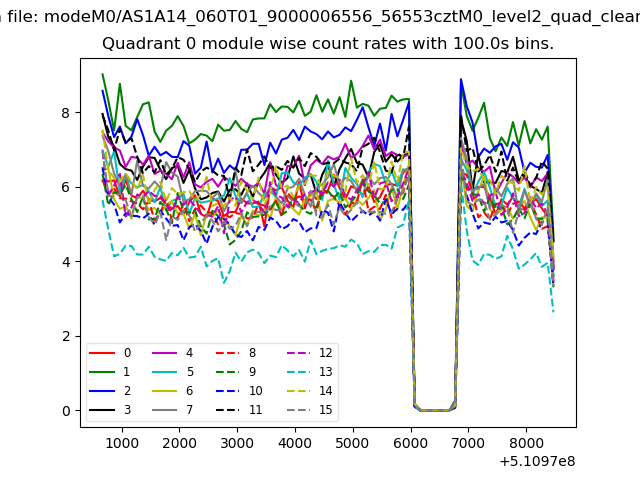 |
 |
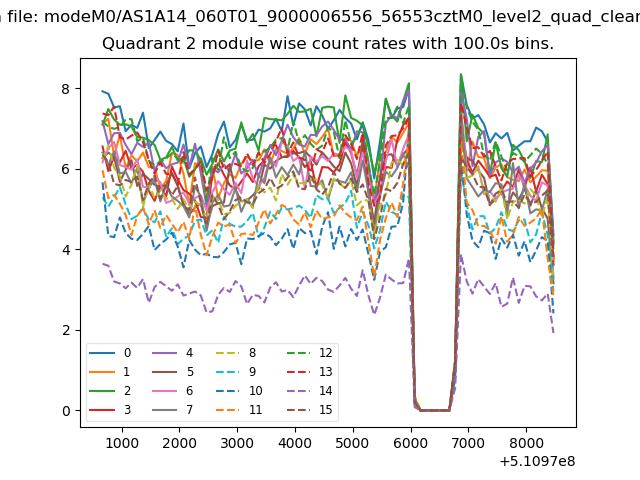
| Module-wise count rates for Quadrant B Data is divided into 100 sec bins |
 |
 |
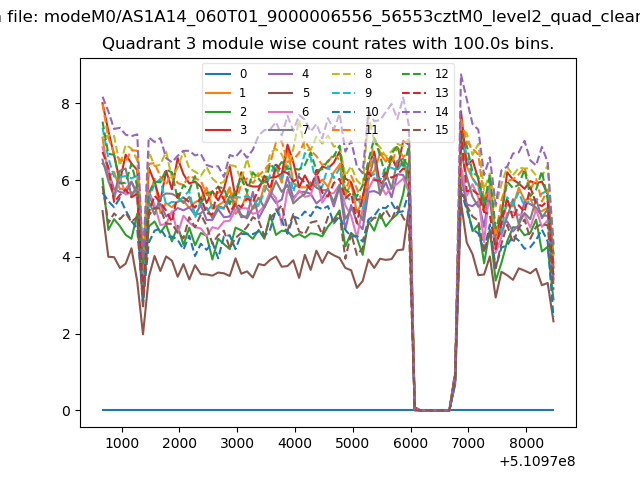
| Module-wise count rates for Quadrant C Data is divided into 100 sec bins |
 |
 |
| Module-wise count rates for Quadrant D Data is divided into 100 sec bins |
 |
 |
| Parameter | Plot |
|---|---|
| CZT HV Monitor | 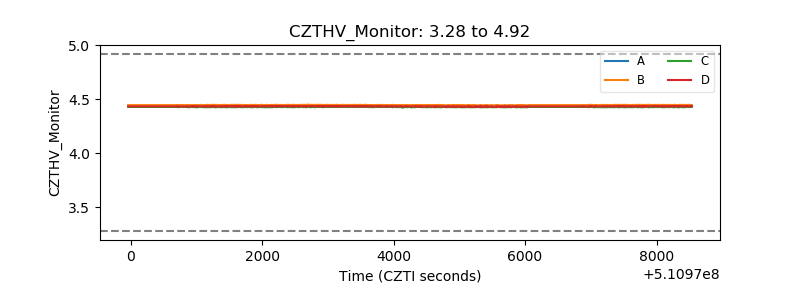 |
| D_VDD | 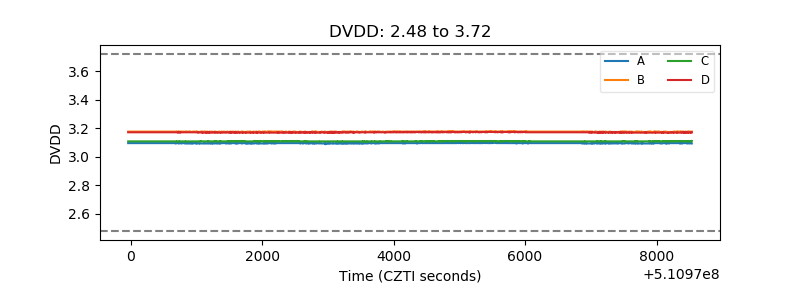 |
| Temperature 1 | 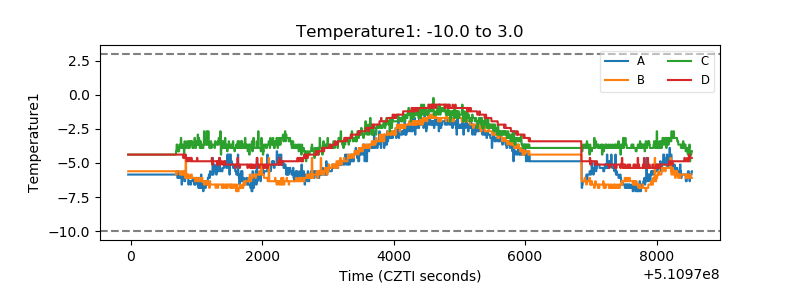 |
| Veto HV Monitor | 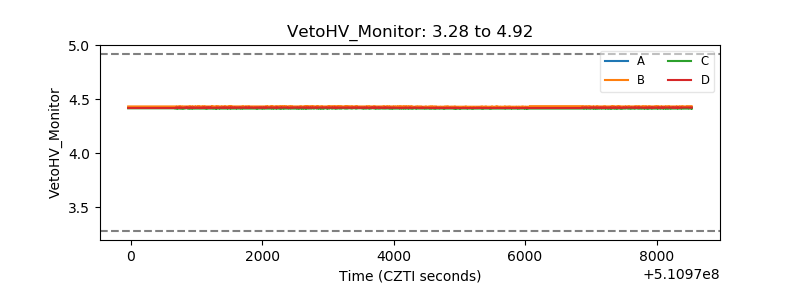 |
| Veto LLD | 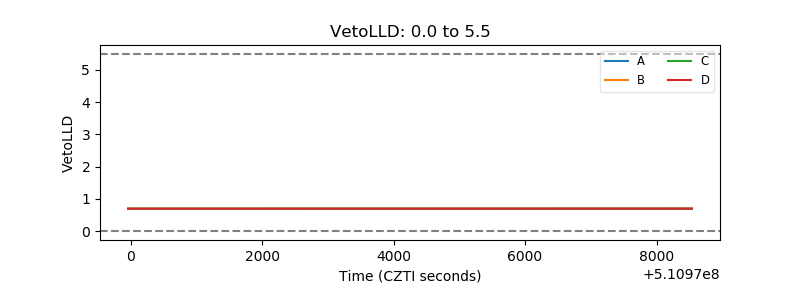 |
| Alpha Counter | 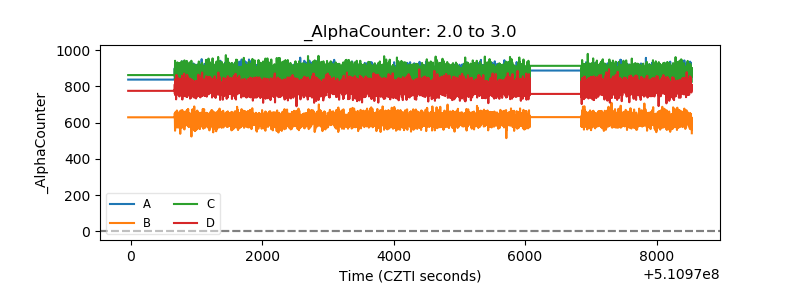 |
| _CPM_Rate | 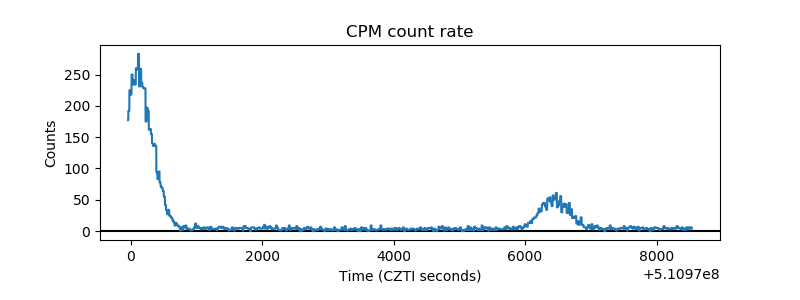 |
| CZT Counter | 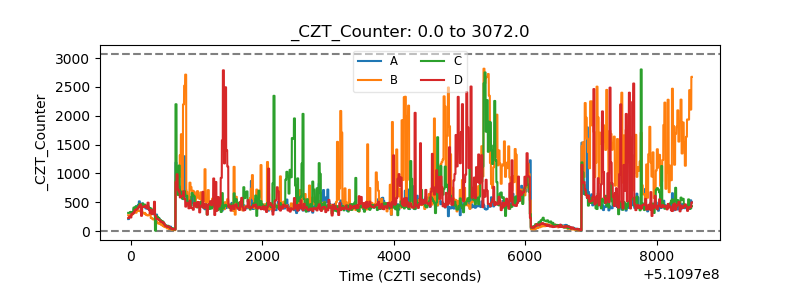 |
| +2.5 Volts monitor | 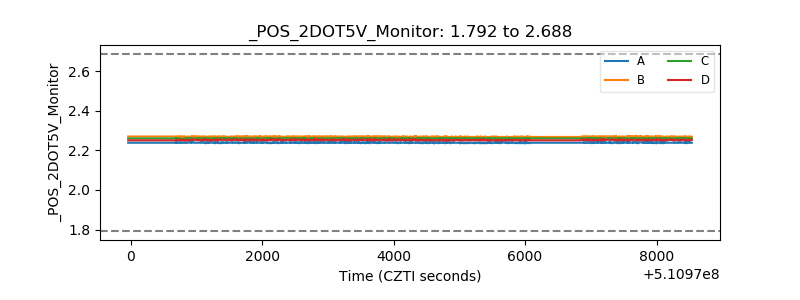 |
| +5 Volts monitor | 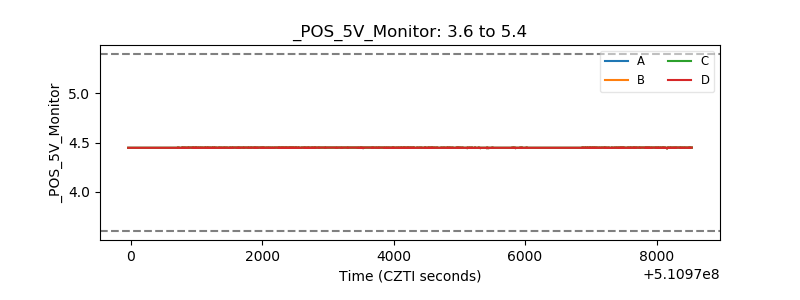 |
| _ROLL_ROT | 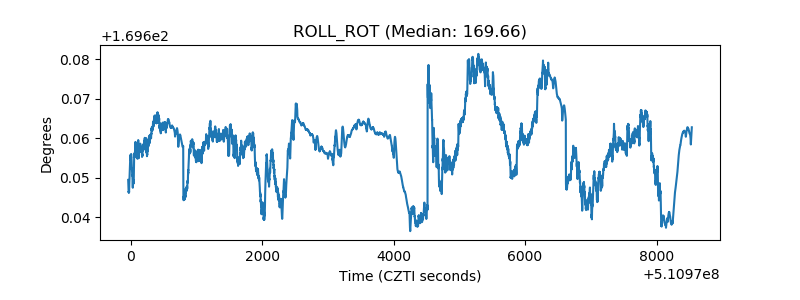 |
| _Roll_DEC | 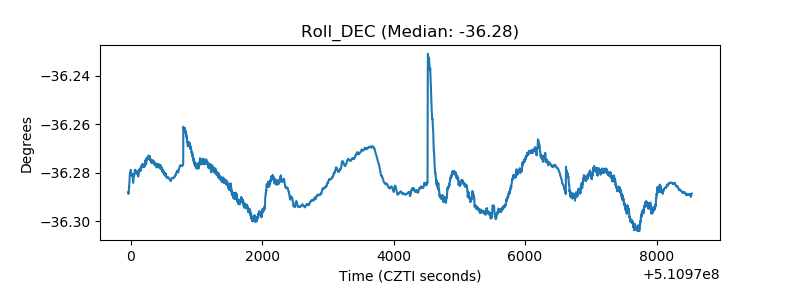 |
| _Roll_RA | 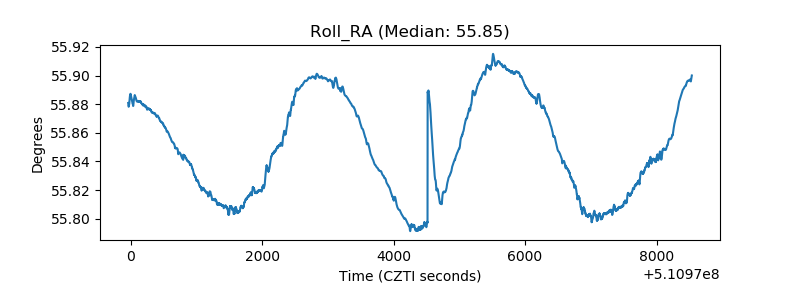 |
| Veto Counter | 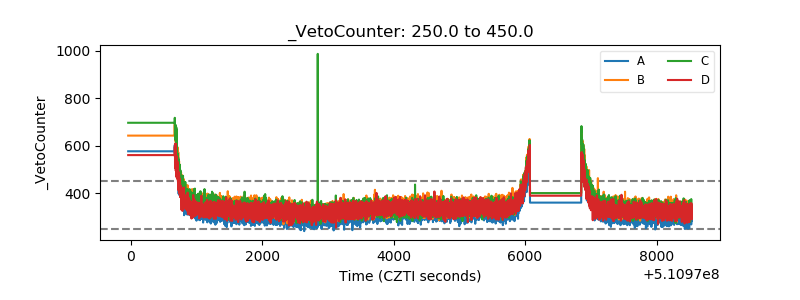 |