| Param | Original file | Final file |
|---|---|---|
| Filename | modeM0/AS1A14_060T01_9000006556_56555cztM0_level2.fits | modeM0/AS1A14_060T01_9000006556_56555cztM0_level2_quad_clean.evt |
| Size (bytes) | 689,388,480 | 116,674,560 |
| Size | 657.5 MB | 111.3 MB |
| Events in quadrant A | 4,220,134 | 820,964 |
| Events in quadrant B | 9,921,836 | 610,905 |
| Events in quadrant C | 4,366,362 | 797,828 |
| Events in quadrant D | 6,328,017 | 693,366 |
| Mode M0 | |||
|---|---|---|---|
| Quadrant | BADHDUFLAG | Total packets | Discarded packets |
| A | 0 | 18920 | 0 |
| B | 0 | 35554 | 0 |
| C | 0 | 19393 | 0 |
| D | 0 | 24940 | 1 |
| Mode SS | |||
|---|---|---|---|
| Quadrant | BADHDUFLAG | Total packets | Discarded packets |
| A | 0 | 176 | 0 |
| B | 0 | 176 | 0 |
| C | 0 | 176 | 0 |
| D | 0 | 176 | 0 |
| Quadrant | Total seconds | Saturated seconds | Saturation percentage |
|---|---|---|---|
| A | 8782 | 176 | 2.004099% |
| B | 8783 | 2856 | 32.517363% |
| C | 8783 | 163 | 1.855858% |
| D | 8782 | 686 | 7.811432% |
Noise dominated data is calculated using 1-second bins in cleaned event files. If a bin has >2000 counts, and if more than 50% of those come from <1% of pixels, then it is considered to be noise-dominated and hence unusable.
| Quadrant | # 1 sec bins | Bins with >0 counts | Bins with >2000 counts | High rate bins dominated by noise | Noise dominated (total time) | Noise dominated (detector-on time) | Marked lightcurve |
|---|---|---|---|---|---|---|---|
| A | 8782 | 8782 | 6 | 6 | 0.07% | 0.07% | 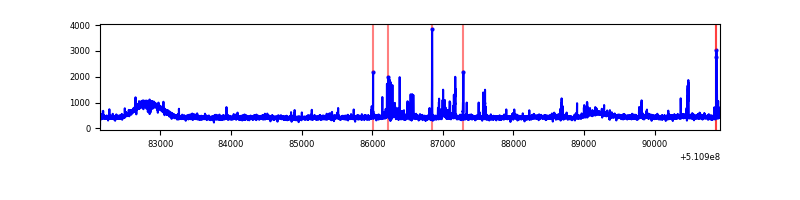 |
| B | 8782 | 8782 | 2096 | 2096 | 23.87% | 23.87% | 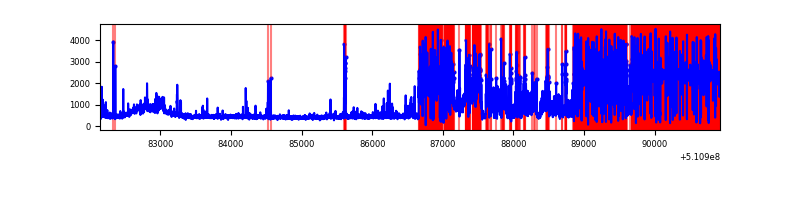 |
| C | 8783 | 8783 | 40 | 40 | 0.46% | 0.46% | 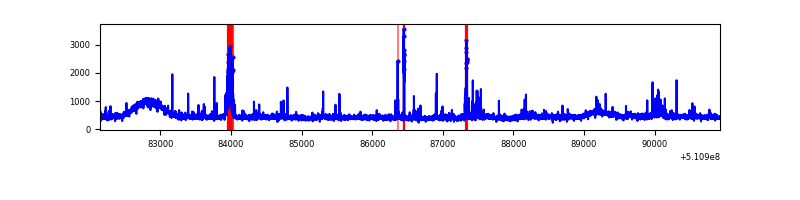 |
| D | 8782 | 8782 | 409 | 409 | 4.66% | 4.66% | 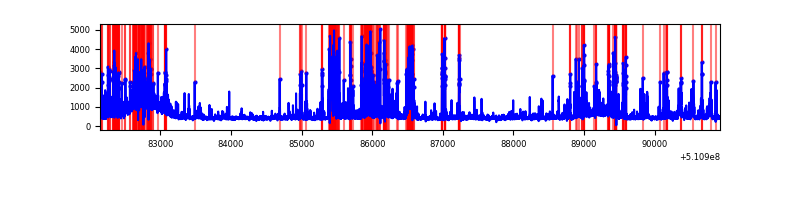 |
Top three noisy pixels from each quadrant. If the there are fewer than three noisy pixels in the level2.evt file, extra rows are filled as -1
| Pixel properties | Quadrant properties | ||||||
|---|---|---|---|---|---|---|---|
| Quadrant | DetID | PixID | Counts | Sigma | Mean | Median | Sigma |
| A | 0 | 8 | 182518 | 727.9 | 1009 | 981 | 249.4 |
| A | 8 | 249 | 23241 | 89.25 | 1009 | 981 | 249.4 |
| A | 7 | 64 | 21699 | 83.07 | 1009 | 981 | 249.4 |
| B | 5 | 172 | 6337618 | 36761.92 | 792 | 763 | 172.4 |
| B | 4 | 206 | 171131 | 988.35 | 792 | 763 | 172.4 |
| B | 10 | 247 | 87378 | 502.48 | 792 | 763 | 172.4 |
| C | 15 | 230 | 217569 | 802.74 | 994 | 985 | 269.8 |
| C | 12 | 252 | 120370 | 442.49 | 994 | 985 | 269.8 |
| C | 7 | 2 | 25620 | 91.31 | 994 | 985 | 269.8 |
| D | 2 | 249 | 1624003 | 6139.02 | 944 | 902 | 264.4 |
| D | 8 | 129 | 343600 | 1296.18 | 944 | 902 | 264.4 |
| D | 14 | 52 | 157652 | 592.87 | 944 | 902 | 264.4 |
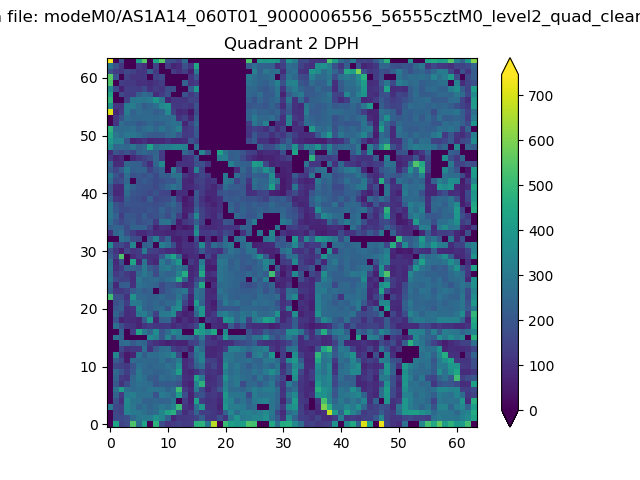
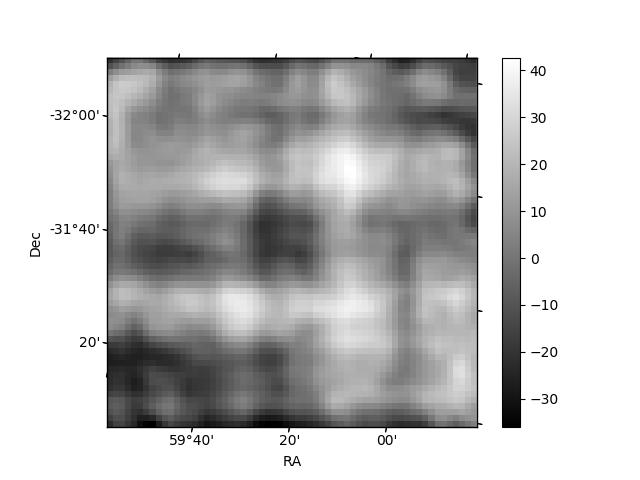
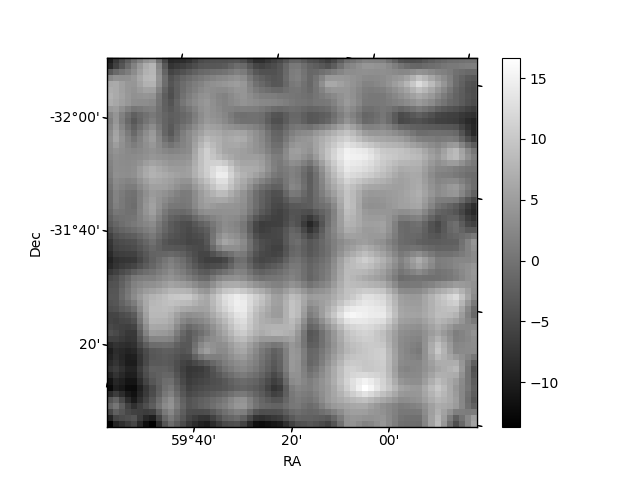
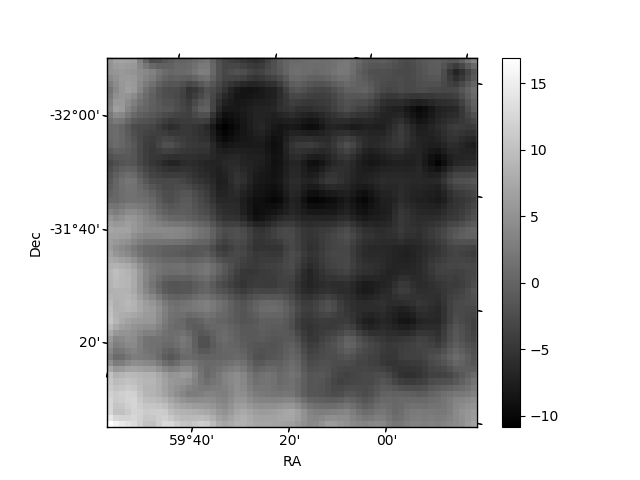
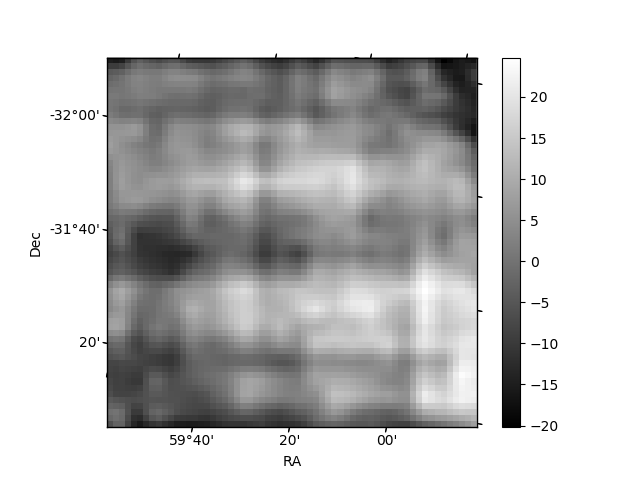
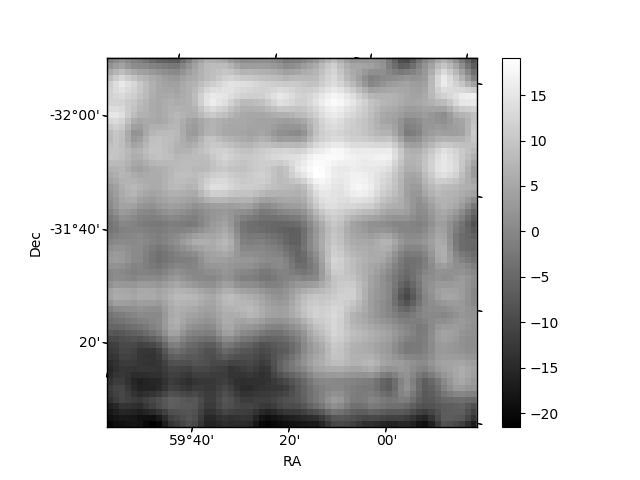
Histogram calculated using DETX and DETY for each event in the final _common_clean file
| Quadrant A | 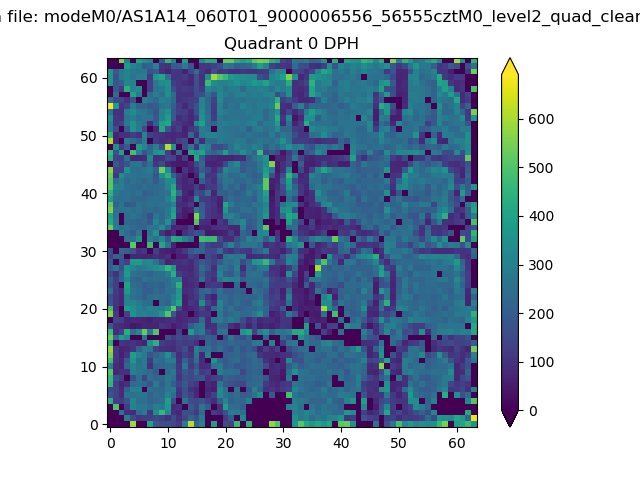 |
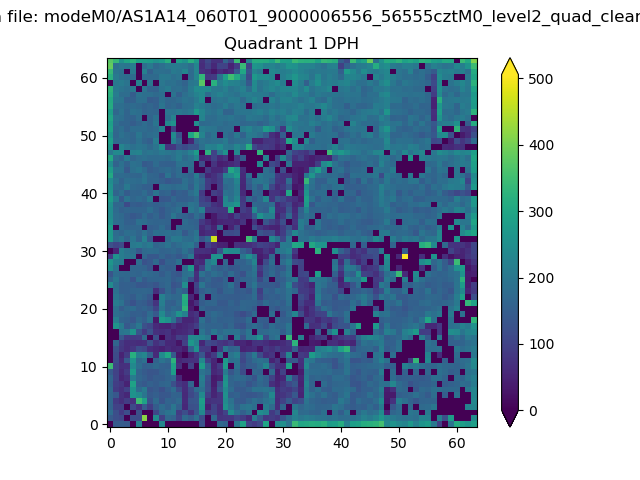 |
Quadrant B |
|---|---|---|---|
| Quadrant D | 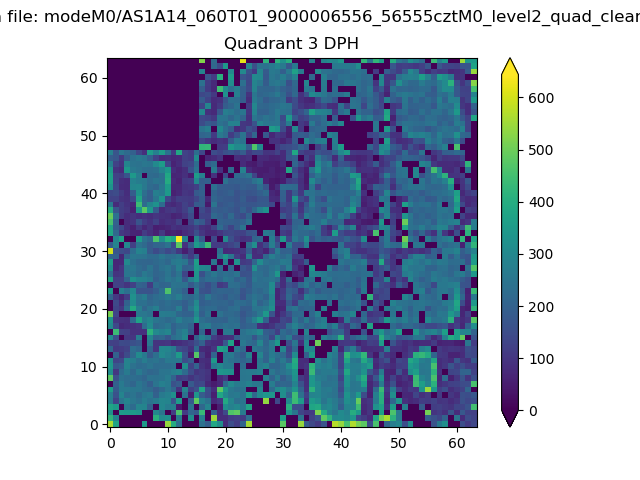 |
 |
Quadrant C |
| Plot type | Count rate plots | Images |
|---|---|---|
| Comparison with Poisson distribution Blue bars denote a histogram of data divided into 1 sec bins. Red curve is a Poisson curve with rate = median count rate of data. |
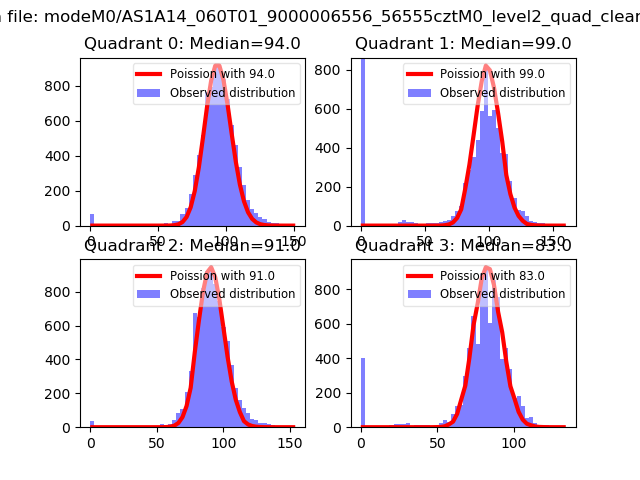 |
 |
| Quadrant-wise count rates Data is divided into 100 sec bins |
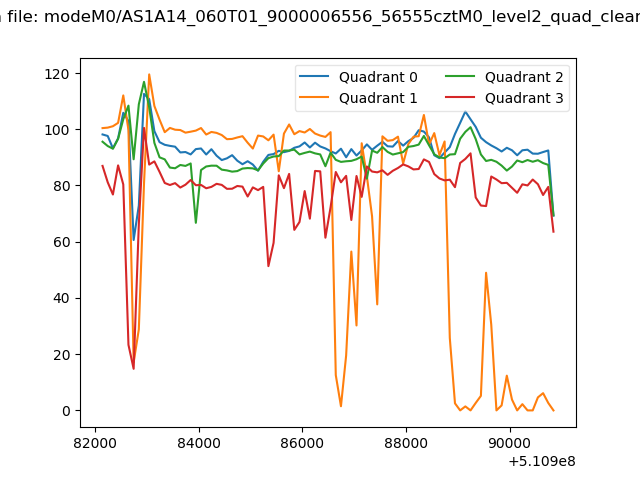 |
|
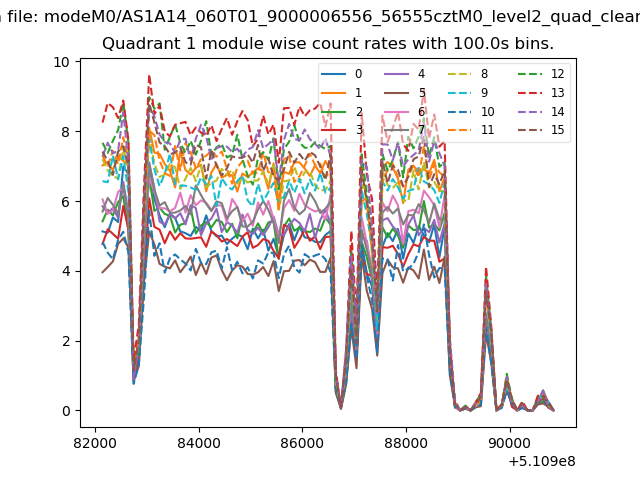
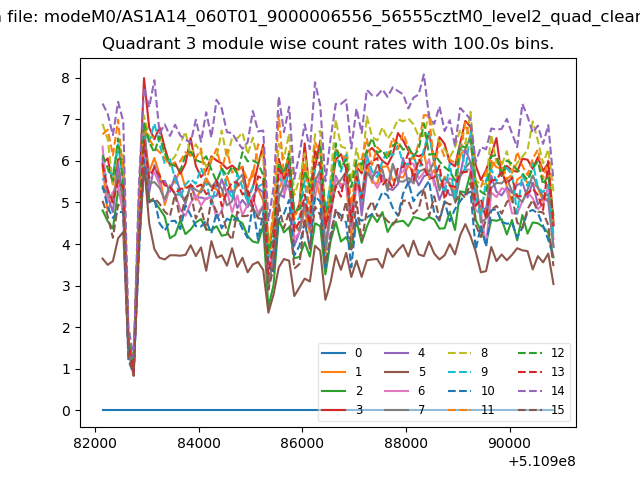
| Module-wise count rates for Quadrant A Data is divided into 100 sec bins |
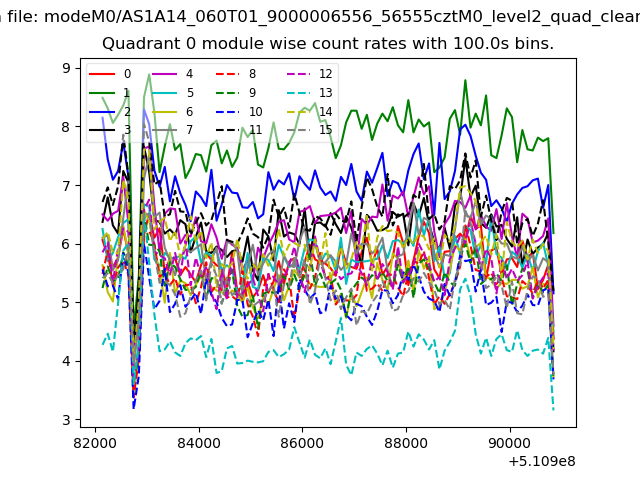 |
 |
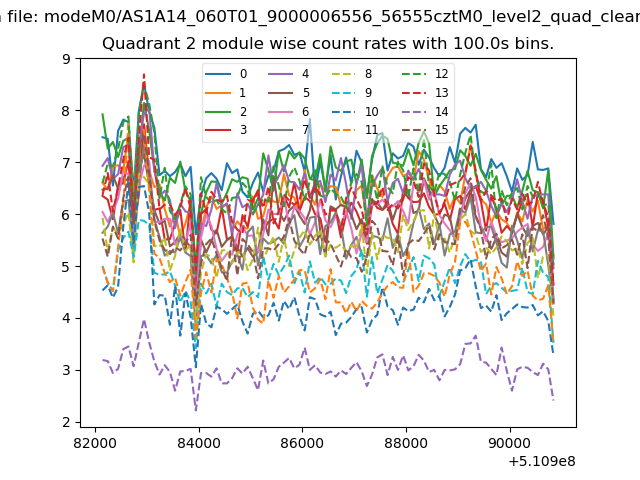
| Module-wise count rates for Quadrant B Data is divided into 100 sec bins |
 |
 |
| Module-wise count rates for Quadrant C Data is divided into 100 sec bins |
 |
 |
| Module-wise count rates for Quadrant D Data is divided into 100 sec bins |
 |
 |
| Parameter | Plot |
|---|---|
| CZT HV Monitor |  |
| D_VDD | 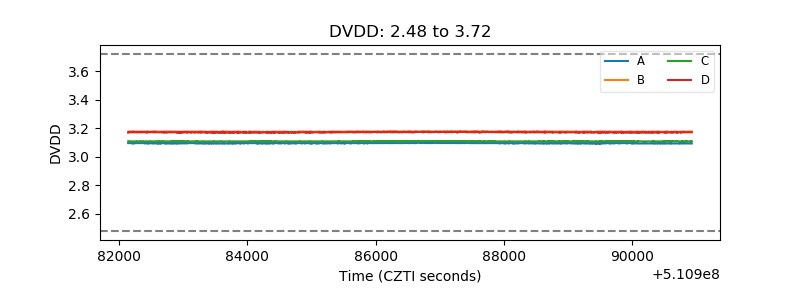 |
| Temperature 1 | 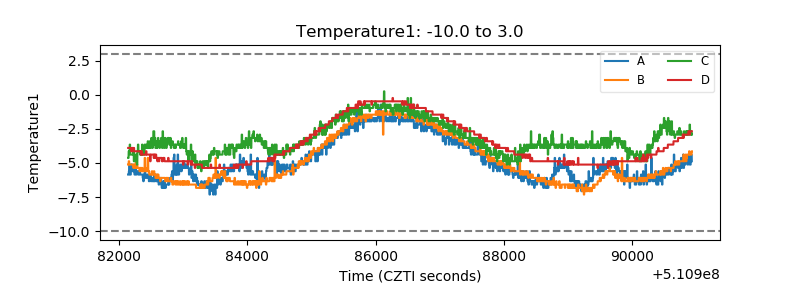 |
| Veto HV Monitor | 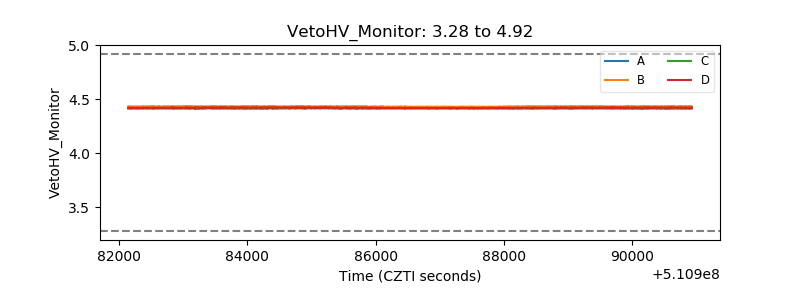 |
| Veto LLD | 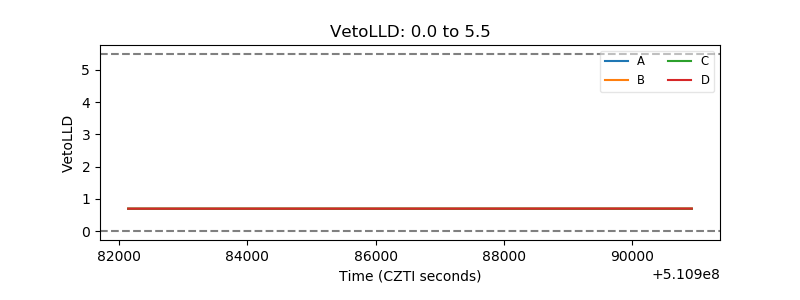 |
| Alpha Counter | 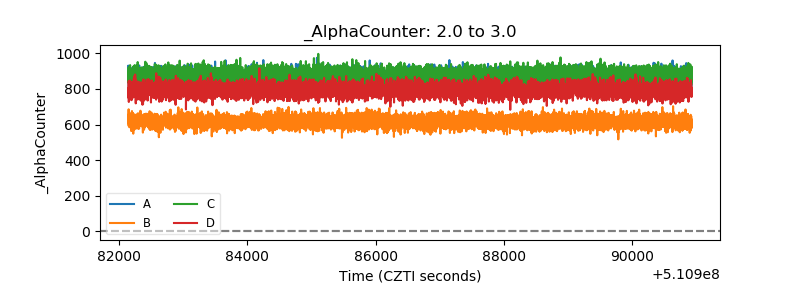 |
| _CPM_Rate | 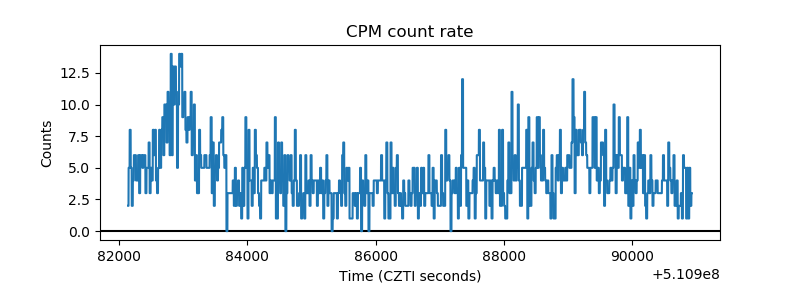 |
| CZT Counter | 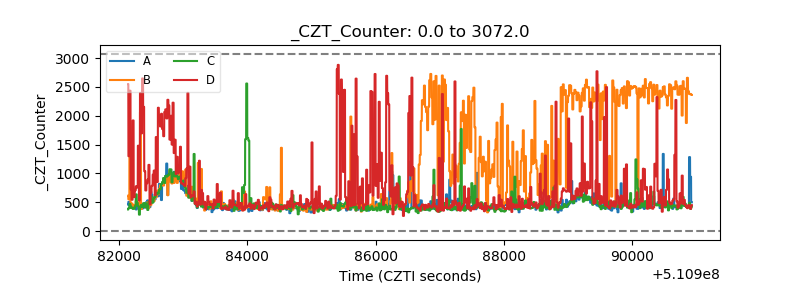 |
| +2.5 Volts monitor | 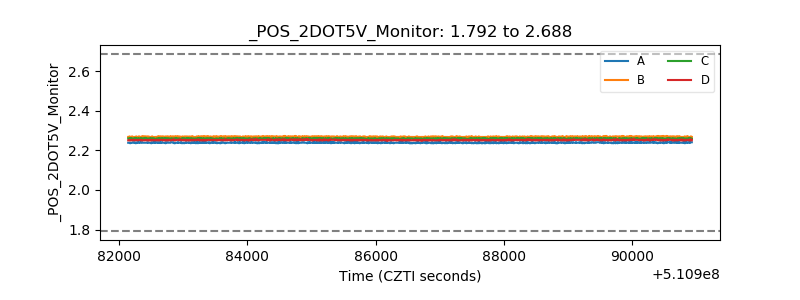 |
| +5 Volts monitor | 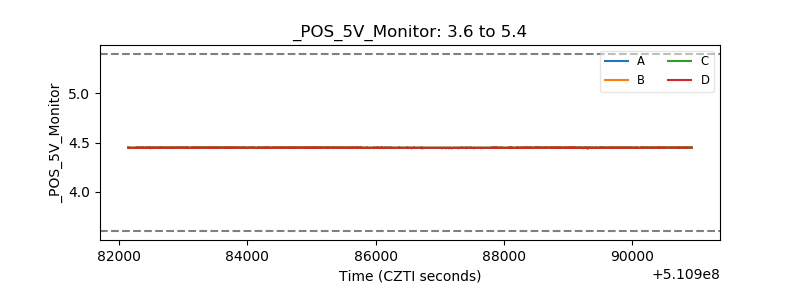 |
| _ROLL_ROT | 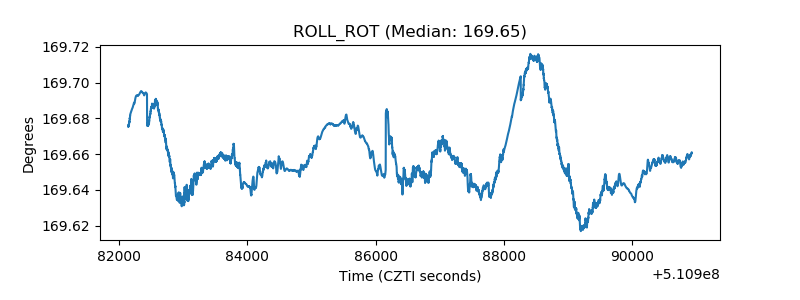 |
| _Roll_DEC | 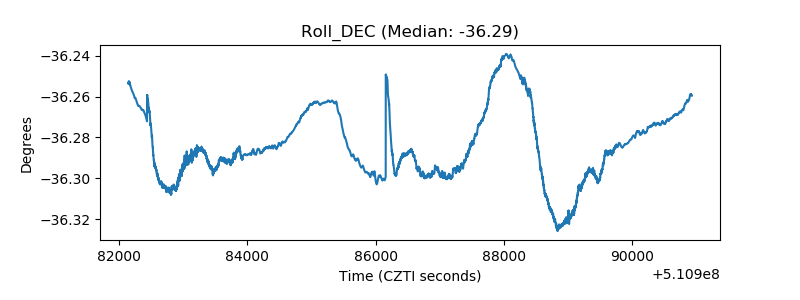 |
| _Roll_RA | 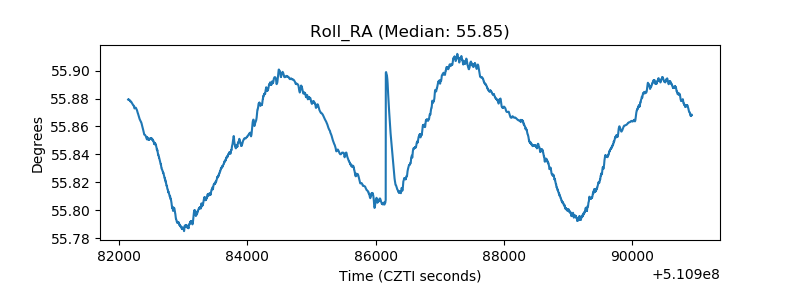 |
| Veto Counter | 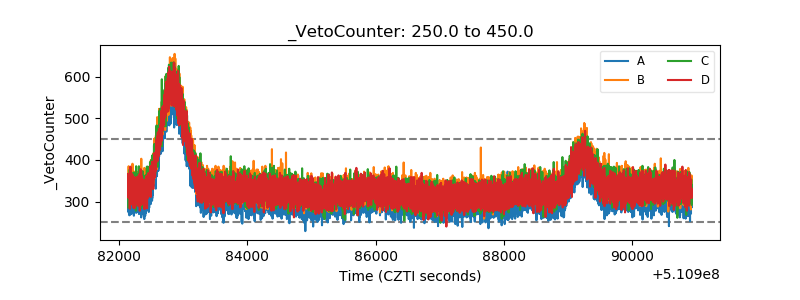 |