| Param | Original file | Final file |
|---|---|---|
| Filename | modeM0/AS1A14_083T06_9000006558_56559cztM0_level2.fits | modeM0/AS1A14_083T06_9000006558_56559cztM0_level2_quad_clean.evt |
| Size (bytes) | 1,351,486,080 | 266,100,480 |
| Size | 1.3 GB | 253.8 MB |
| Events in quadrant A | 13,155,097 | 1,681,560 |
| Events in quadrant B | 9,722,676 | 1,918,776 |
| Events in quadrant C | 12,685,086 | 1,633,393 |
| Events in quadrant D | 12,968,475 | 1,490,559 |
| Mode SS | |||
|---|---|---|---|
| Quadrant | BADHDUFLAG | Total packets | Discarded packets |
| A | 0 | 392 | 0 |
| B | 0 | 392 | 0 |
| C | 0 | 392 | 0 |
| D | 0 | 392 | 0 |
| Mode M9 | |||
|---|---|---|---|
| Quadrant | BADHDUFLAG | Total packets | Discarded packets |
| A | 0 | 10 | 0 |
| B | 0 | 10 | 0 |
| C | 0 | 10 | 0 |
| D | 0 | 10 | 0 |
| Mode M0 | |||
|---|---|---|---|
| Quadrant | BADHDUFLAG | Total packets | Discarded packets |
| A | 0 | 52997 | 2 |
| B | 0 | 42532 | 8 |
| C | 0 | 51580 | 2 |
| D | 0 | 52038 | 2 |
| Quadrant | Total seconds | Saturated seconds | Saturation percentage |
|---|---|---|---|
| A | 19331 | 1447 | 7.485386% |
| B | 19328 | 474 | 2.452401% |
| C | 19332 | 993 | 5.136561% |
| D | 19332 | 1246 | 6.445272% |
Noise dominated data is calculated using 1-second bins in cleaned event files. If a bin has >2000 counts, and if more than 50% of those come from <1% of pixels, then it is considered to be noise-dominated and hence unusable.
| Quadrant | # 1 sec bins | Bins with >0 counts | Bins with >2000 counts | High rate bins dominated by noise | Noise dominated (total time) | Noise dominated (detector-on time) | Marked lightcurve |
|---|---|---|---|---|---|---|---|
| A | 20361 | 19333 | 907 | 907 | 4.45% | 4.69% | 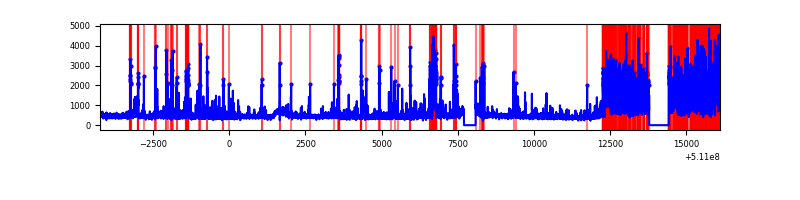 |
| B | 20362 | 19332 | 68 | 68 | 0.33% | 0.35% | 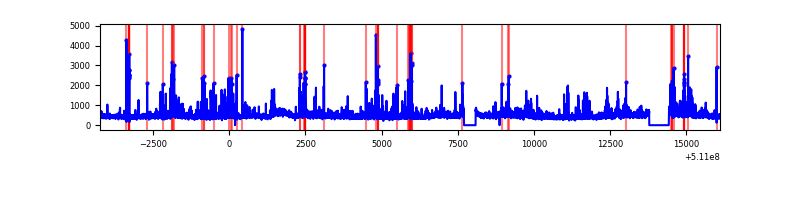 |
| C | 20362 | 19334 | 652 | 652 | 3.20% | 3.37% | 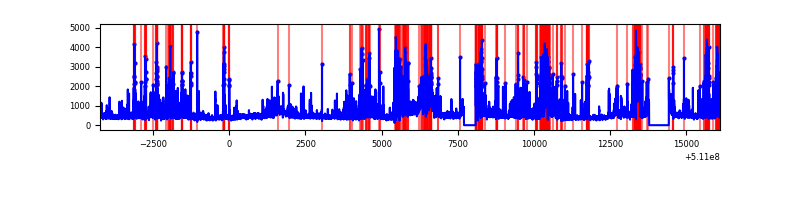 |
| D | 20362 | 19334 | 872 | 872 | 4.28% | 4.51% | 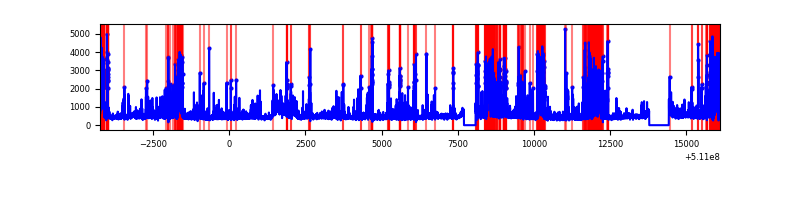 |
Top three noisy pixels from each quadrant. If the there are fewer than three noisy pixels in the level2.evt file, extra rows are filled as -1
| Pixel properties | Quadrant properties | ||||||
|---|---|---|---|---|---|---|---|
| Quadrant | DetID | PixID | Counts | Sigma | Mean | Median | Sigma |
| A | 7 | 64 | 3563598 | 7055.65 | 2048 | 1990 | 504.8 |
| A | 3 | 130 | 594043 | 1172.87 | 2048 | 1990 | 504.8 |
| A | 4 | 249 | 584142 | 1153.26 | 2048 | 1990 | 504.8 |
| B | 5 | 185 | 252564 | 568.7 | 2069 | 1993 | 440.6 |
| B | 4 | 21 | 217145 | 488.32 | 2069 | 1993 | 440.6 |
| B | 4 | 171 | 200769 | 451.15 | 2069 | 1993 | 440.6 |
| C | 12 | 252 | 1683091 | 3092.36 | 1997 | 1974 | 543.6 |
| C | 13 | 3 | 1149209 | 2110.3 | 1997 | 1974 | 543.6 |
| C | 15 | 230 | 953548 | 1750.39 | 1997 | 1974 | 543.6 |
| D | 2 | 249 | 2938749 | 5258.49 | 1976 | 1883 | 558.5 |
| D | 2 | 252 | 355099 | 632.44 | 1976 | 1883 | 558.5 |
| D | 8 | 240 | 290541 | 516.84 | 1976 | 1883 | 558.5 |
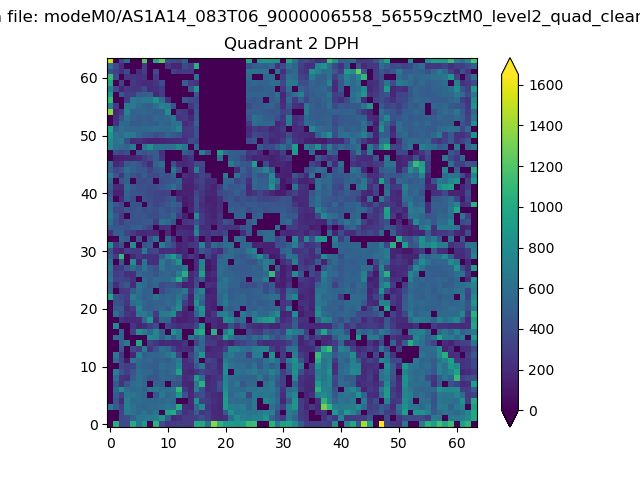
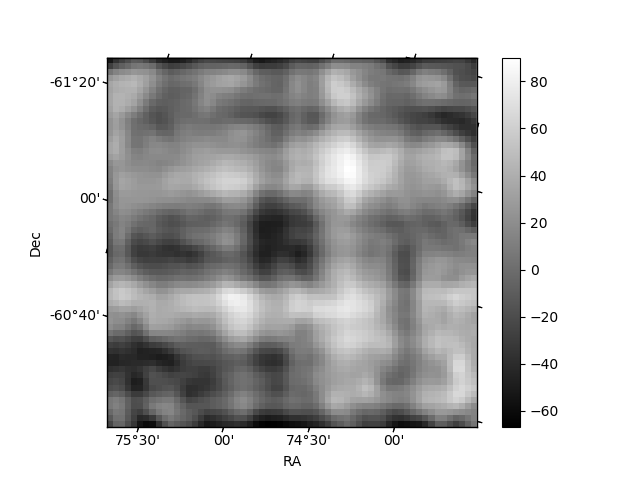
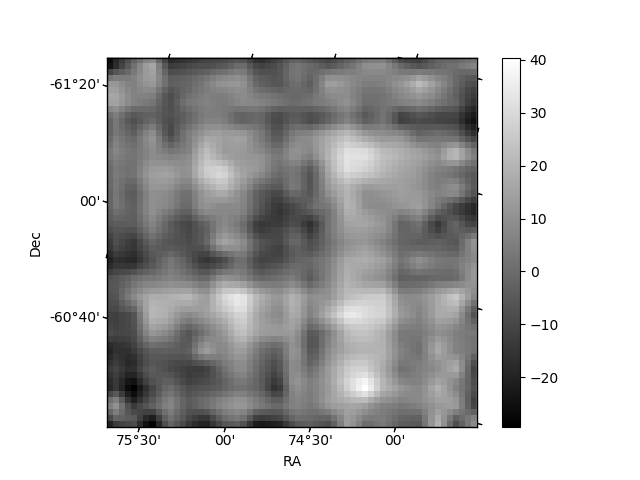
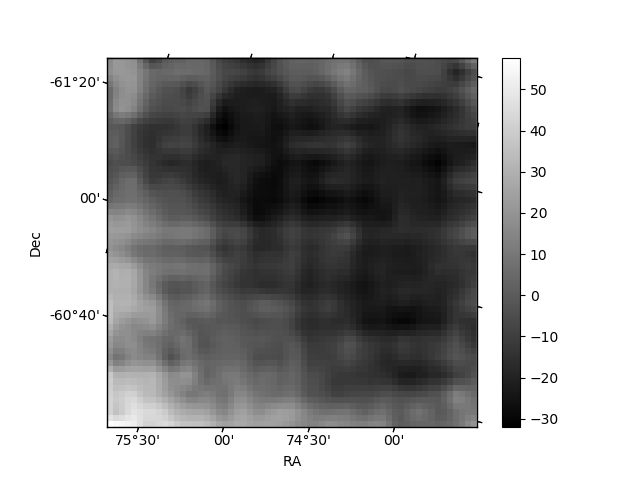
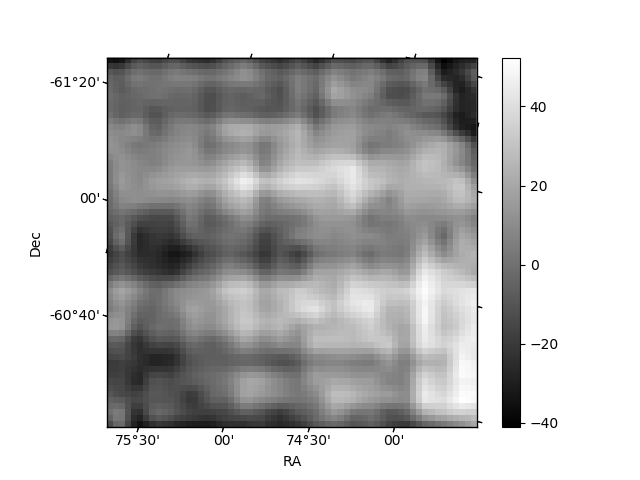
Histogram calculated using DETX and DETY for each event in the final _common_clean file
| Quadrant A | 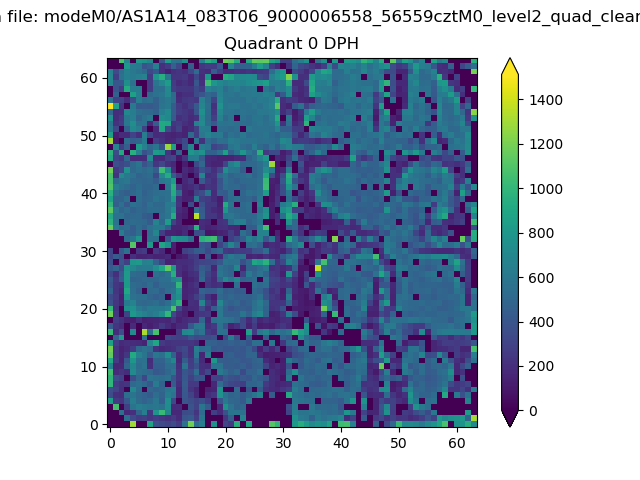 |
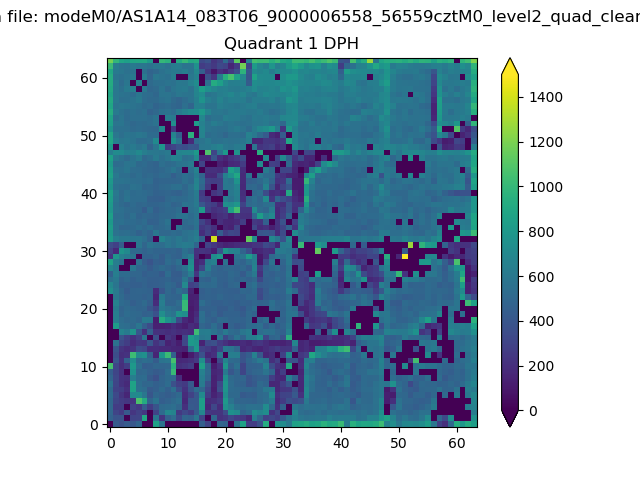 |
Quadrant B |
|---|---|---|---|
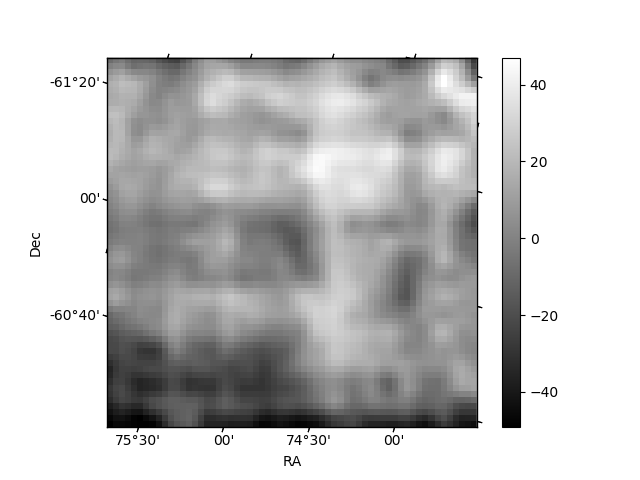
| Quadrant D | 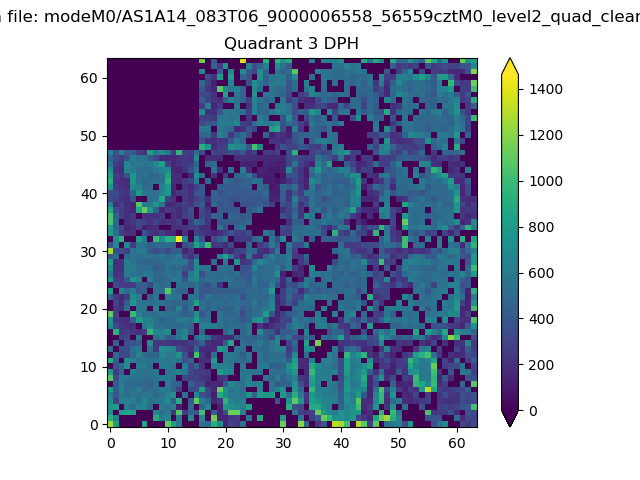 |
 |
Quadrant C |
| Plot type | Count rate plots | Images |
|---|---|---|
| Comparison with Poisson distribution Blue bars denote a histogram of data divided into 1 sec bins. Red curve is a Poisson curve with rate = median count rate of data. |
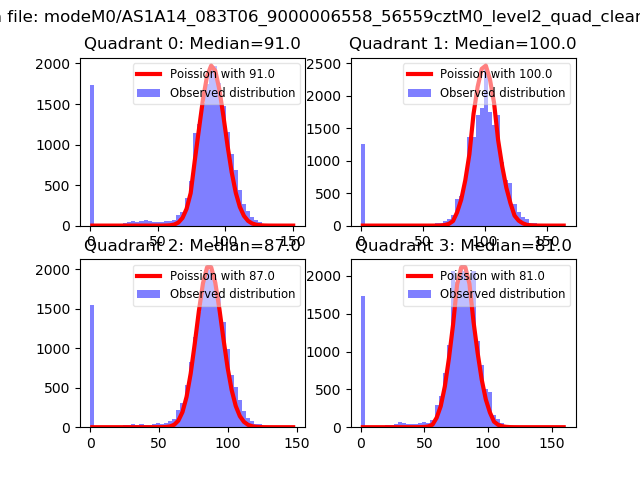 |
 |
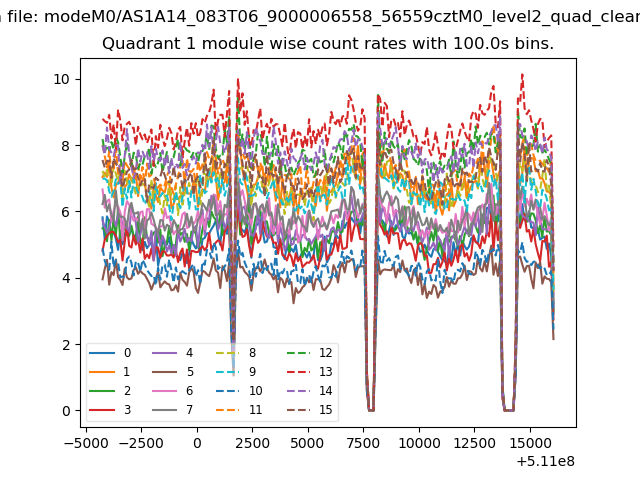
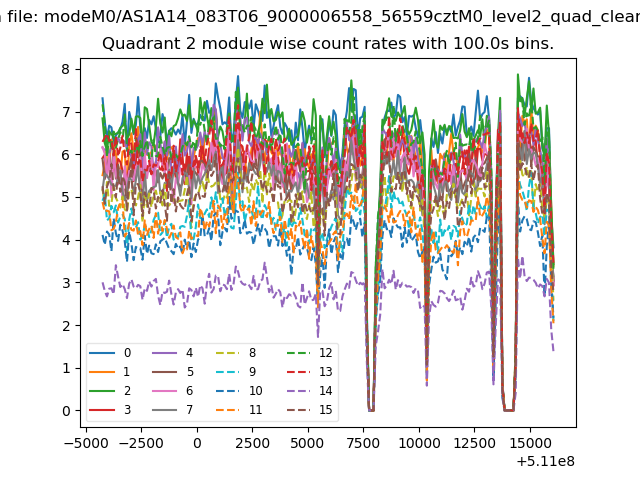
| Quadrant-wise count rates Data is divided into 100 sec bins |
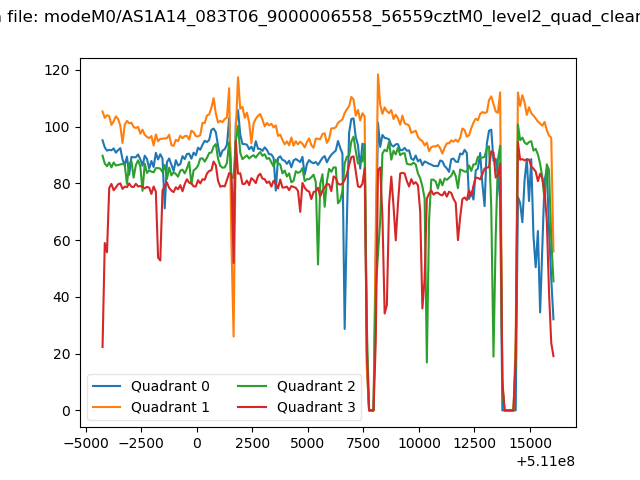 |
|
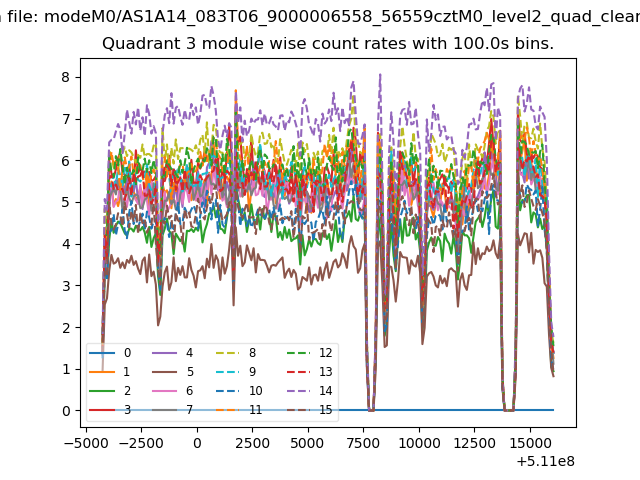
| Module-wise count rates for Quadrant A Data is divided into 100 sec bins |
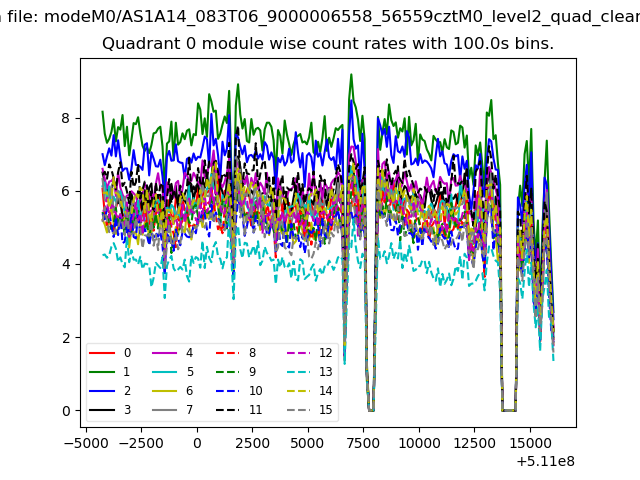 |
 |
| Module-wise count rates for Quadrant B Data is divided into 100 sec bins |
 |
 |
| Module-wise count rates for Quadrant C Data is divided into 100 sec bins |
 |
 |
| Module-wise count rates for Quadrant D Data is divided into 100 sec bins |
 |
 |
| Parameter | Plot |
|---|---|
| CZT HV Monitor | 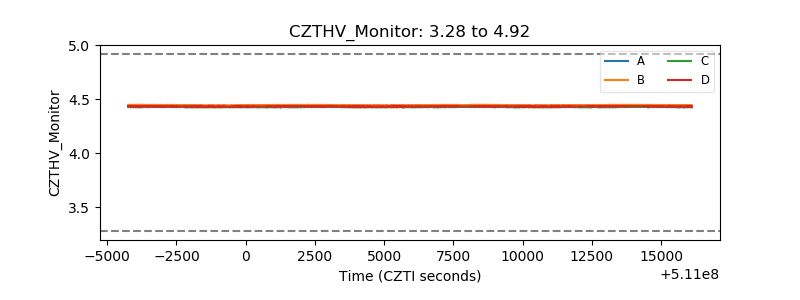 |
| D_VDD | 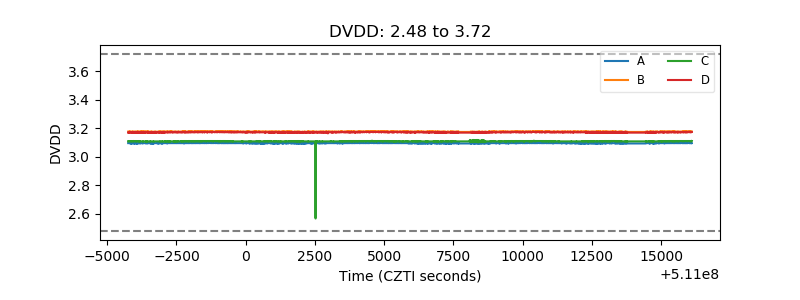 |
| Temperature 1 | 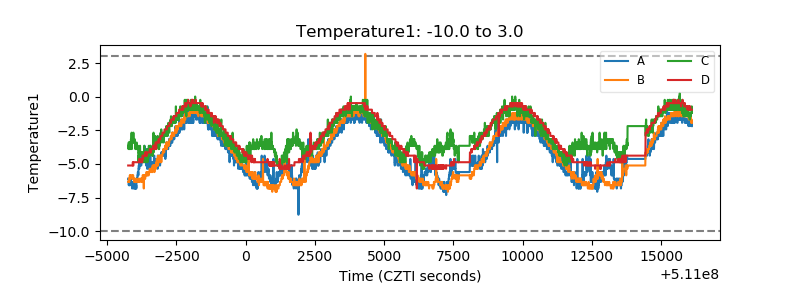 |
| Veto HV Monitor |  |
| Veto LLD | 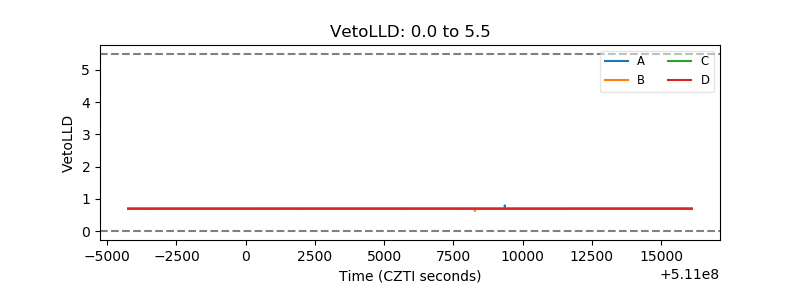 |
| Alpha Counter | 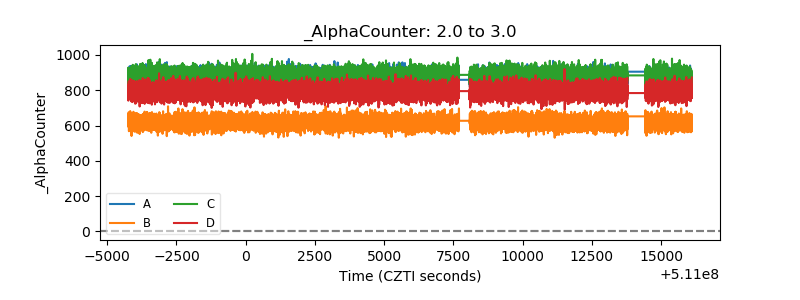 |
| _CPM_Rate | 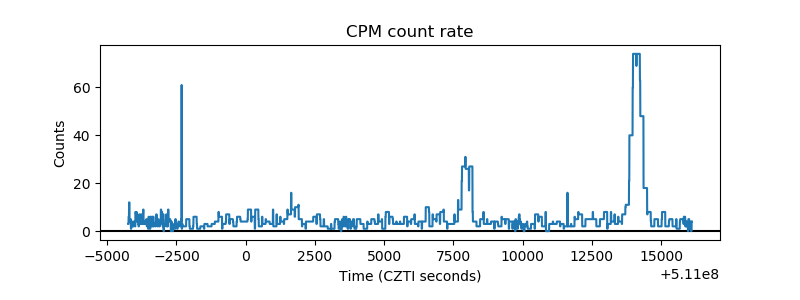 |
| CZT Counter | 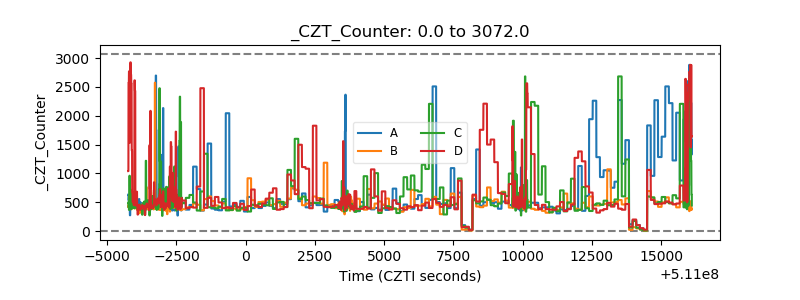 |
| +2.5 Volts monitor |  |
| +5 Volts monitor |  |
| _ROLL_ROT | 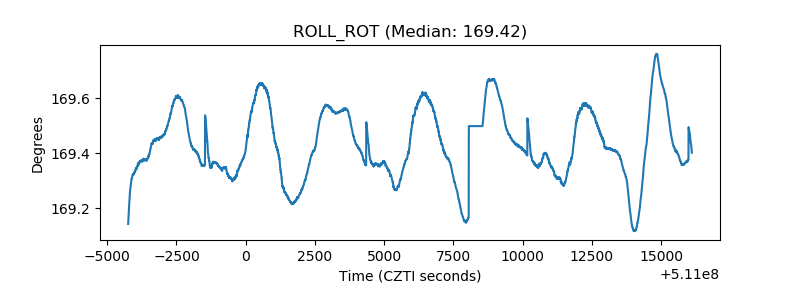 |
| _Roll_DEC | 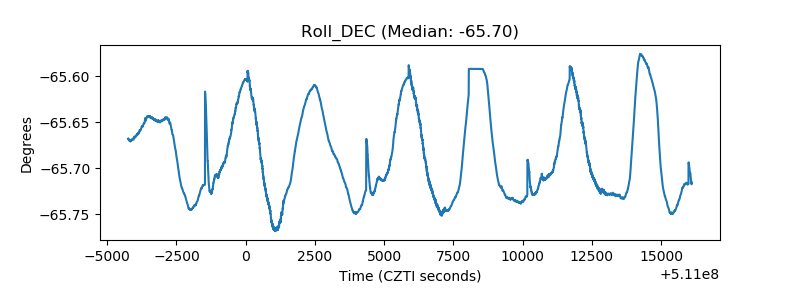 |
| _Roll_RA | 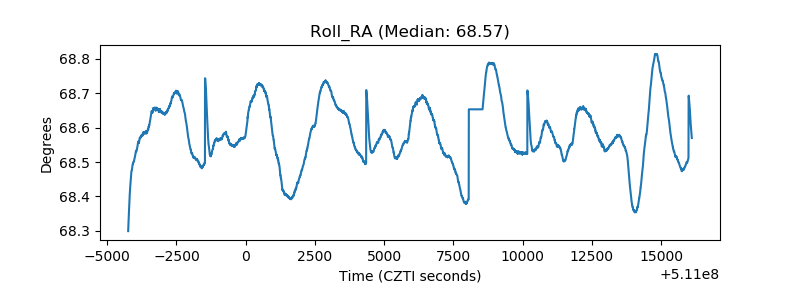 |
| Veto Counter | 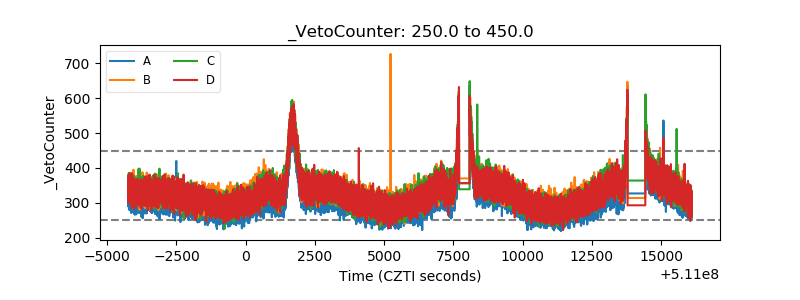 |