| Param | Original file | Final file |
|---|---|---|
| Filename | modeM0/AS1A14_083T06_9000006558_56562cztM0_level2.fits | modeM0/AS1A14_083T06_9000006558_56562cztM0_level2_quad_clean.evt |
| Size (bytes) | 550,149,120 | 89,951,040 |
| Size | 524.7 MB | 85.8 MB |
| Events in quadrant A | 5,158,312 | 550,795 |
| Events in quadrant B | 3,493,550 | 667,808 |
| Events in quadrant C | 5,857,356 | 534,415 |
| Events in quadrant D | 5,349,538 | 516,075 |
| Mode SS | |||
|---|---|---|---|
| Quadrant | BADHDUFLAG | Total packets | Discarded packets |
| A | 0 | 132 | 0 |
| B | 0 | 132 | 0 |
| C | 0 | 132 | 0 |
| D | 0 | 132 | 0 |
| Mode M9 | |||
|---|---|---|---|
| Quadrant | BADHDUFLAG | Total packets | Discarded packets |
| A | 0 | 10 | 0 |
| B | 0 | 10 | 0 |
| C | 0 | 10 | 0 |
| D | 0 | 10 | 0 |
| Mode M0 | |||
|---|---|---|---|
| Quadrant | BADHDUFLAG | Total packets | Discarded packets |
| A | 0 | 19951 | 1 |
| B | 0 | 14959 | 1 |
| C | 0 | 21978 | 1 |
| D | 0 | 20357 | 1 |
| Quadrant | Total seconds | Saturated seconds | Saturation percentage |
|---|---|---|---|
| A | 6515 | 852 | 13.077513% |
| B | 6516 | 94 | 1.442603% |
| C | 6516 | 776 | 11.909147% |
| D | 6516 | 591 | 9.069982% |
Noise dominated data is calculated using 1-second bins in cleaned event files. If a bin has >2000 counts, and if more than 50% of those come from <1% of pixels, then it is considered to be noise-dominated and hence unusable.
| Quadrant | # 1 sec bins | Bins with >0 counts | Bins with >2000 counts | High rate bins dominated by noise | Noise dominated (total time) | Noise dominated (detector-on time) | Marked lightcurve |
|---|---|---|---|---|---|---|---|
| A | 7505 | 6516 | 764 | 764 | 10.18% | 11.72% | 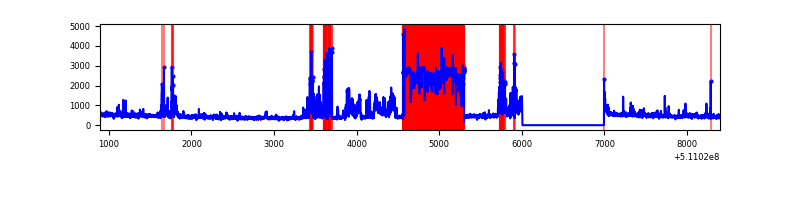 |
| B | 7506 | 6517 | 52 | 52 | 0.69% | 0.80% | 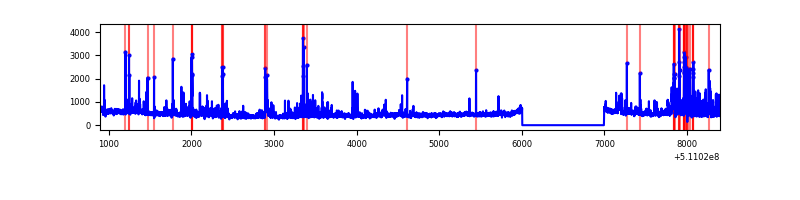 |
| C | 7506 | 6517 | 687 | 687 | 9.15% | 10.54% | 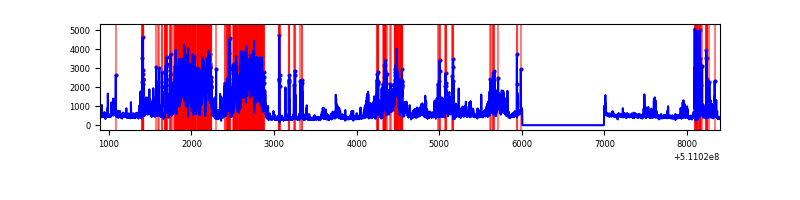 |
| D | 7506 | 6517 | 508 | 508 | 6.77% | 7.79% | 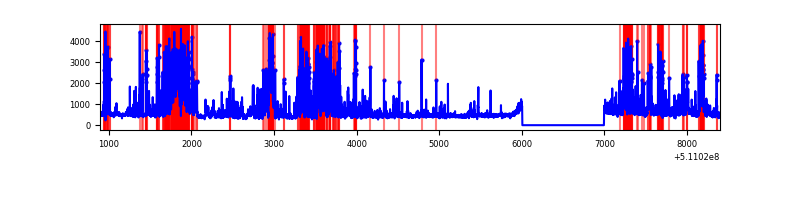 |
Top three noisy pixels from each quadrant. If the there are fewer than three noisy pixels in the level2.evt file, extra rows are filled as -1
| Pixel properties | Quadrant properties | ||||||
|---|---|---|---|---|---|---|---|
| Quadrant | DetID | PixID | Counts | Sigma | Mean | Median | Sigma |
| A | 0 | 12 | 1711422 | 10518.75 | 659 | 643 | 162.6 |
| A | 7 | 64 | 409049 | 2511.09 | 659 | 643 | 162.6 |
| A | 4 | 95 | 352835 | 2165.46 | 659 | 643 | 162.6 |
| B | 8 | 128 | 202576 | 1359.55 | 696 | 673 | 148.5 |
| B | 10 | 247 | 139164 | 932.55 | 696 | 673 | 148.5 |
| B | 4 | 21 | 103106 | 689.75 | 696 | 673 | 148.5 |
| C | 15 | 230 | 2684459 | 15218.54 | 644 | 637 | 176.4 |
| C | 13 | 3 | 181975 | 1028.27 | 644 | 637 | 176.4 |
| C | 12 | 249 | 147842 | 834.72 | 644 | 637 | 176.4 |
| D | 2 | 249 | 1645152 | 8960.13 | 648 | 616 | 183.5 |
| D | 2 | 31 | 303150 | 1648.33 | 648 | 616 | 183.5 |
| D | 8 | 129 | 262856 | 1428.79 | 648 | 616 | 183.5 |
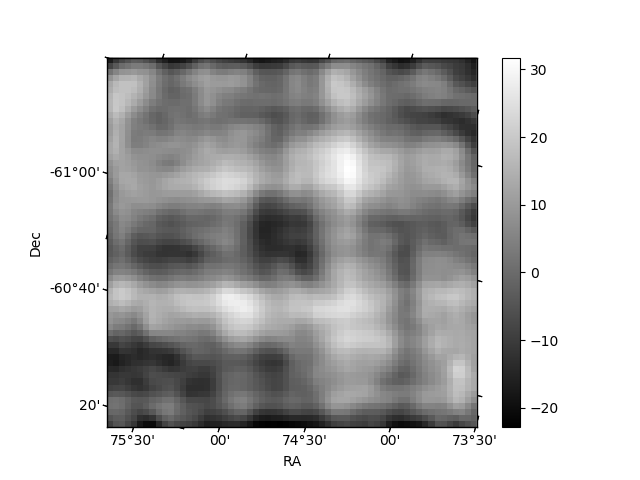
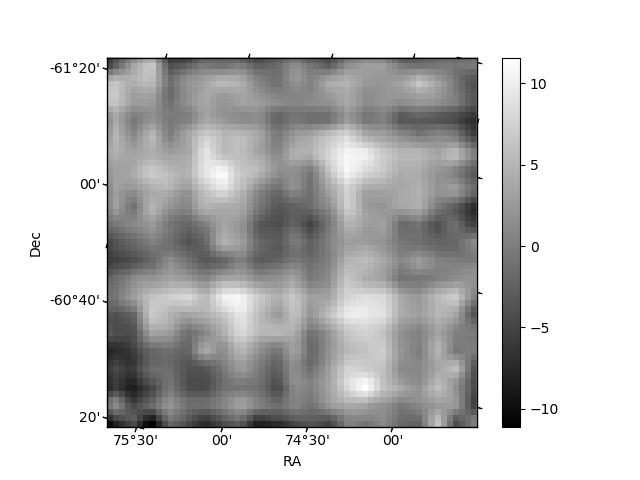
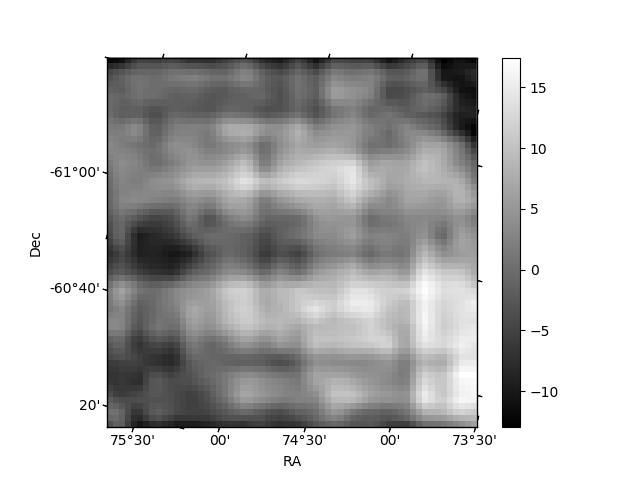
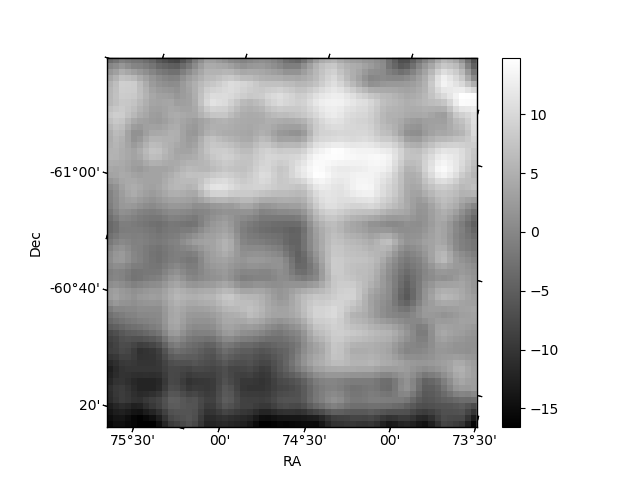
Histogram calculated using DETX and DETY for each event in the final _common_clean file
| Quadrant A | 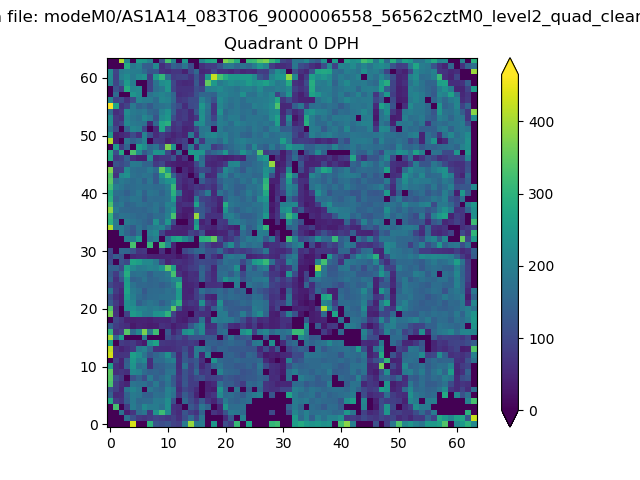 |
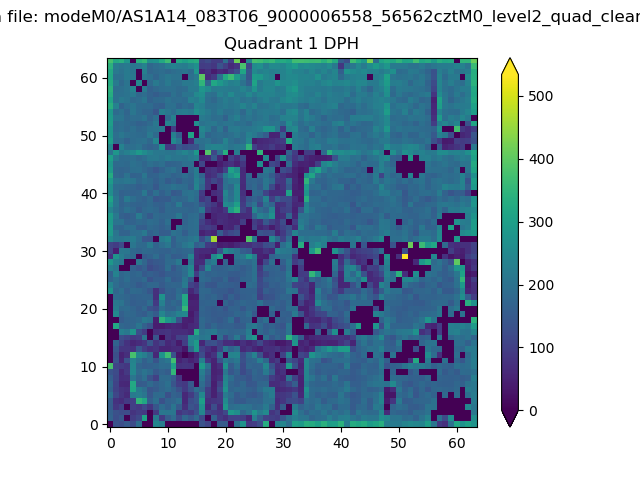 |
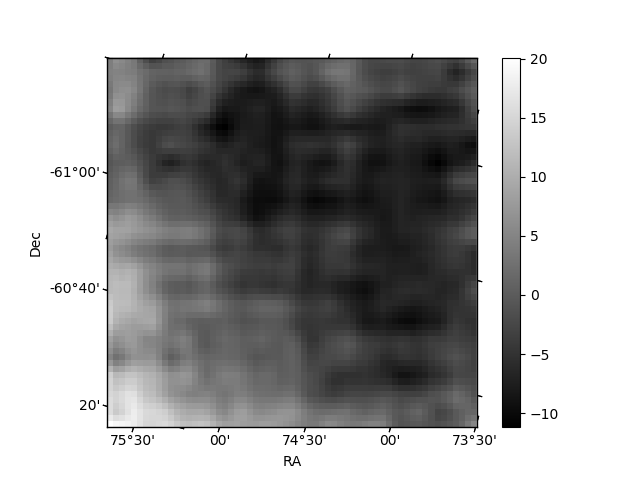
Quadrant B |
|---|---|---|---|
| Quadrant D | 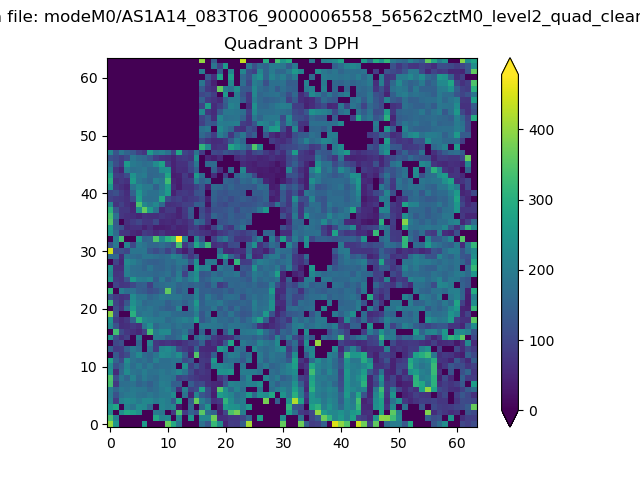 |
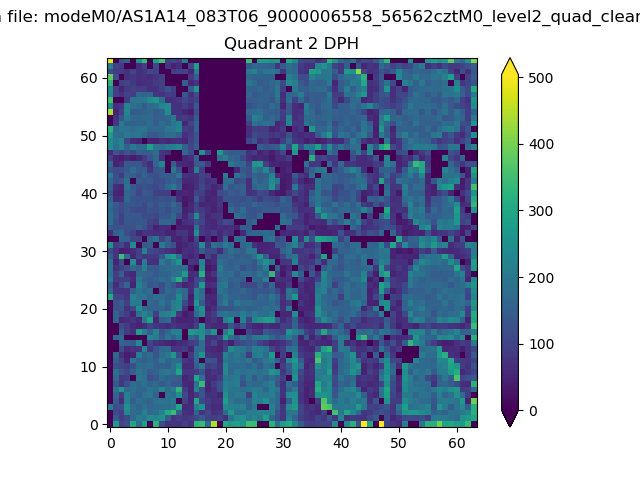 |
Quadrant C |
| Plot type | Count rate plots | Images |
|---|---|---|
| Comparison with Poisson distribution Blue bars denote a histogram of data divided into 1 sec bins. Red curve is a Poisson curve with rate = median count rate of data. |
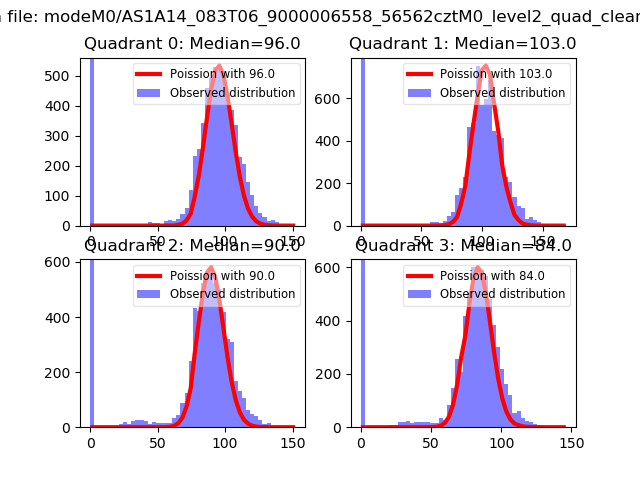 |
 |
| Quadrant-wise count rates Data is divided into 100 sec bins |
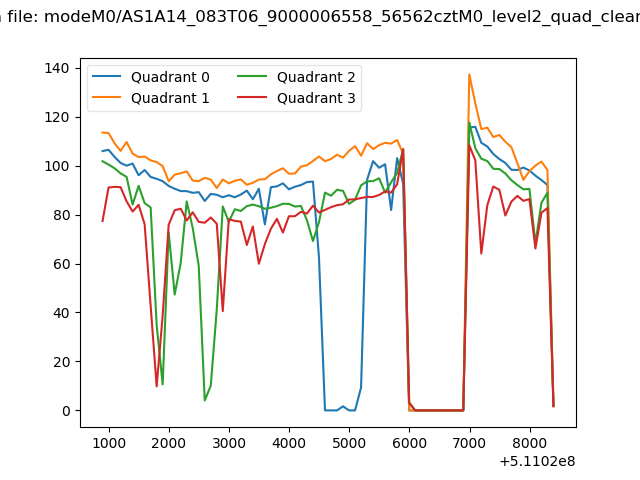 |
|
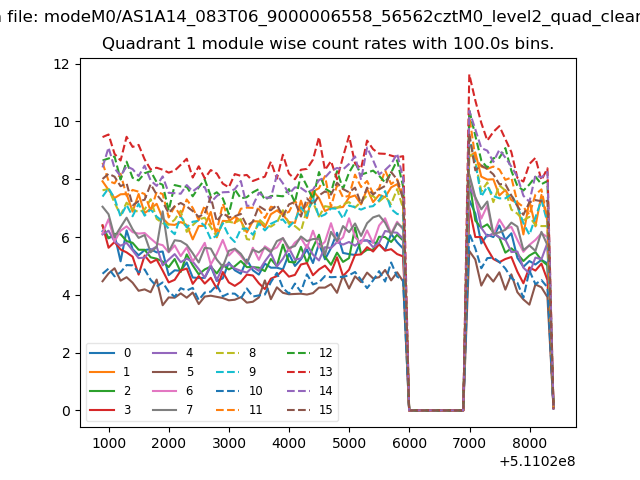
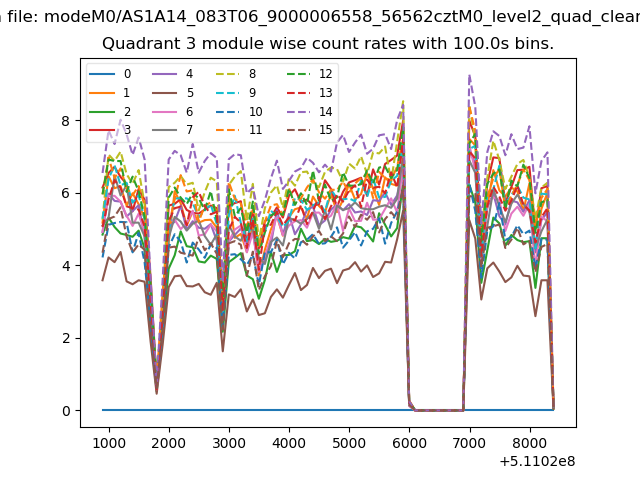
| Module-wise count rates for Quadrant A Data is divided into 100 sec bins |
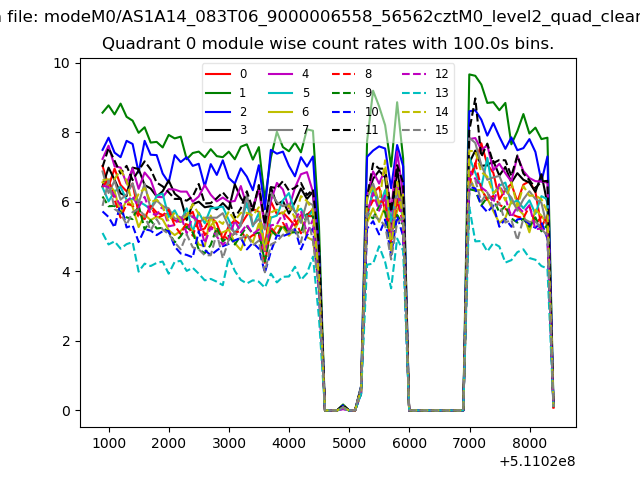 |
 |
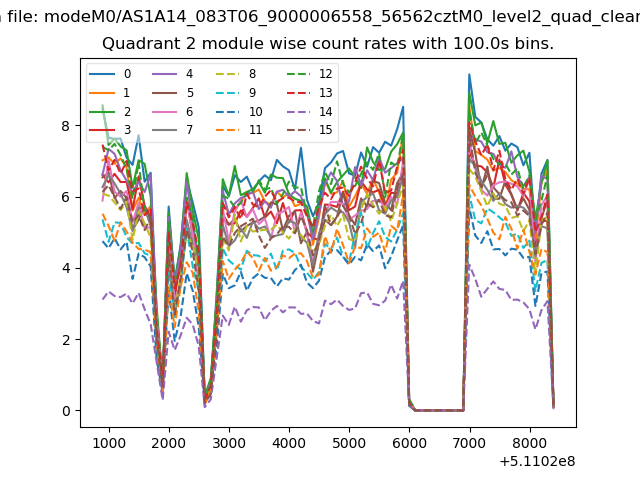
| Module-wise count rates for Quadrant B Data is divided into 100 sec bins |
 |
 |
| Module-wise count rates for Quadrant C Data is divided into 100 sec bins |
 |
 |
| Module-wise count rates for Quadrant D Data is divided into 100 sec bins |
 |
 |
| Parameter | Plot |
|---|---|
| CZT HV Monitor | 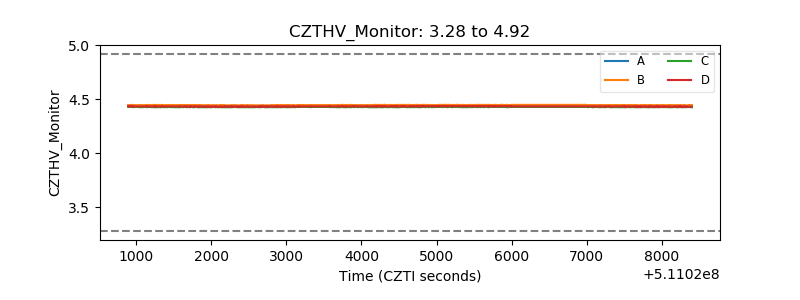 |
| D_VDD | 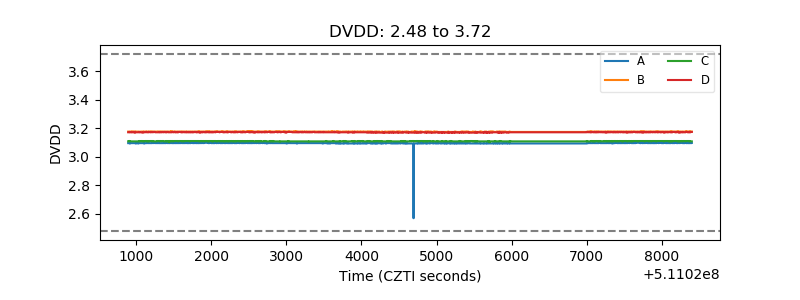 |
| Temperature 1 | 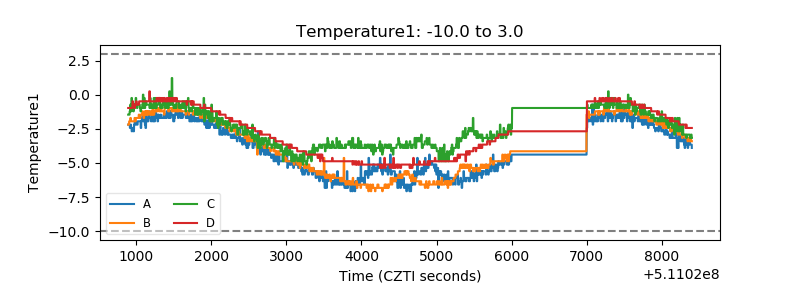 |
| Veto HV Monitor | 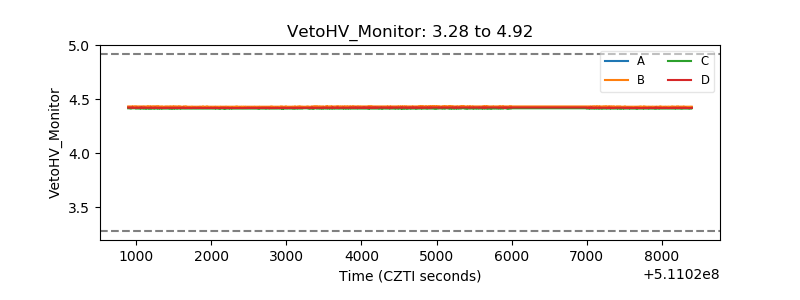 |
| Veto LLD | 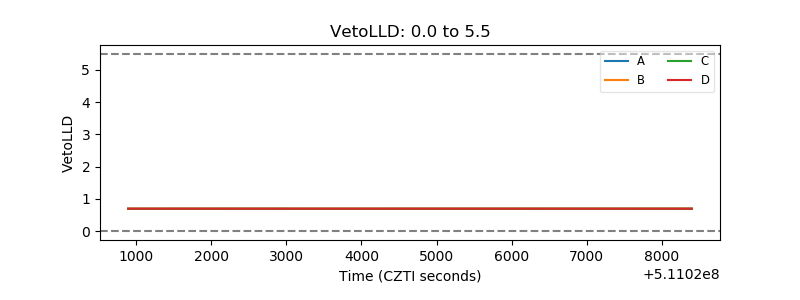 |
| Alpha Counter | 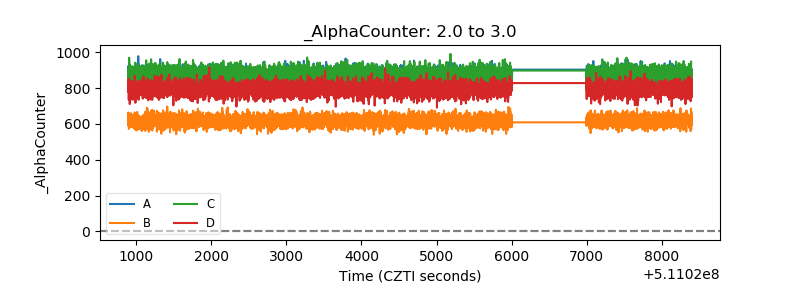 |
| _CPM_Rate | 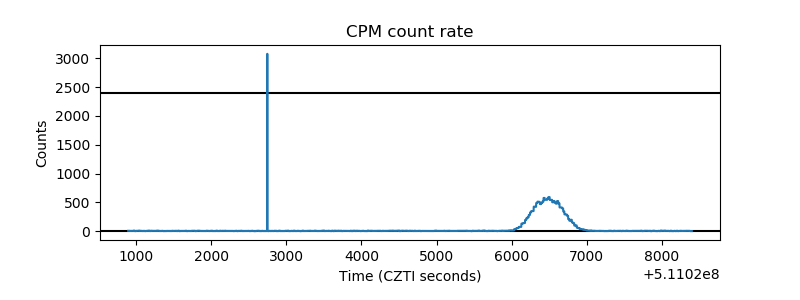 |
| CZT Counter | 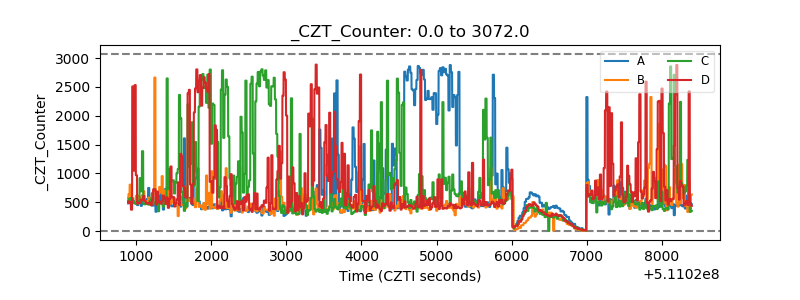 |
| +2.5 Volts monitor |  |
| +5 Volts monitor |  |
| _ROLL_ROT | 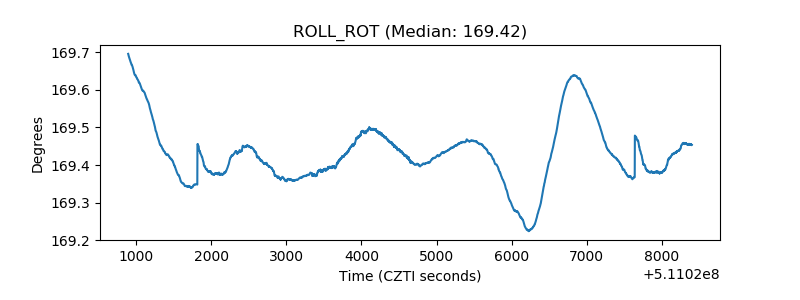 |
| _Roll_DEC | 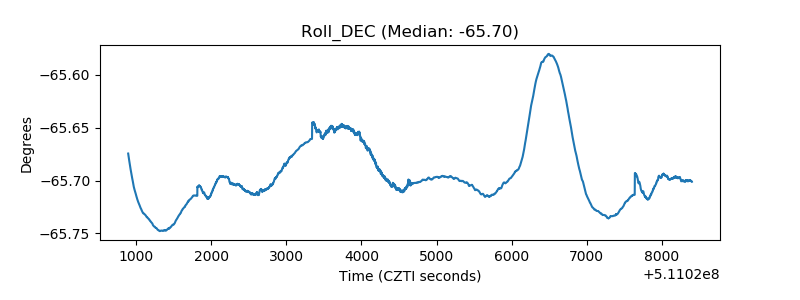 |
| _Roll_RA | 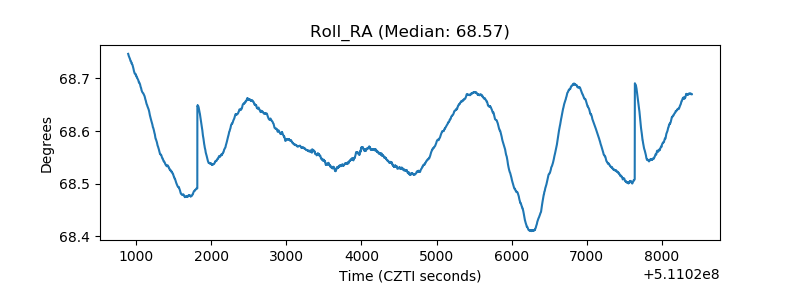 |
| Veto Counter | 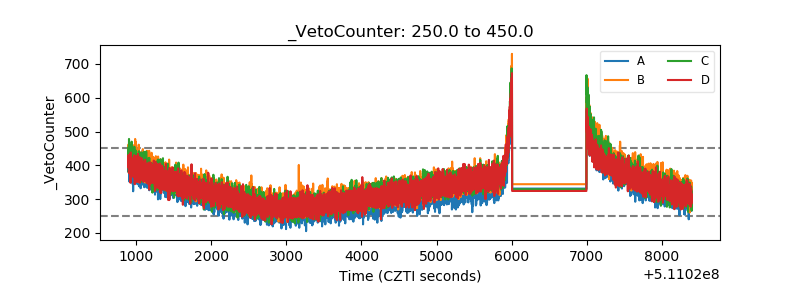 |