| Param | Original file | Final file |
|---|---|---|
| Filename | modeM0/AS1A14_083T06_9000006558_56563cztM0_level2.fits | modeM0/AS1A14_083T06_9000006558_56563cztM0_level2_quad_clean.evt |
| Size (bytes) | 536,106,240 | 90,573,120 |
| Size | 511.3 MB | 86.4 MB |
| Events in quadrant A | 5,002,044 | 580,729 |
| Events in quadrant B | 3,464,500 | 677,414 |
| Events in quadrant C | 4,302,707 | 570,257 |
| Events in quadrant D | 6,572,368 | 462,260 |
| Mode SS | |||
|---|---|---|---|
| Quadrant | BADHDUFLAG | Total packets | Discarded packets |
| A | 0 | 130 | 0 |
| B | 0 | 130 | 0 |
| C | 0 | 130 | 0 |
| D | 0 | 130 | 0 |
| Mode M9 | |||
|---|---|---|---|
| Quadrant | BADHDUFLAG | Total packets | Discarded packets |
| A | 0 | 11 | 0 |
| B | 0 | 11 | 0 |
| C | 0 | 11 | 0 |
| D | 0 | 11 | 0 |
| Mode M0 | |||
|---|---|---|---|
| Quadrant | BADHDUFLAG | Total packets | Discarded packets |
| A | 0 | 19440 | 1 |
| B | 0 | 14884 | 1 |
| C | 0 | 17557 | 1 |
| D | 0 | 23940 | 1 |
| Quadrant | Total seconds | Saturated seconds | Saturation percentage |
|---|---|---|---|
| A | 6477 | 609 | 9.402501% |
| B | 6477 | 99 | 1.528485% |
| C | 6478 | 363 | 5.603581% |
| D | 6478 | 1212 | 18.709478% |
Noise dominated data is calculated using 1-second bins in cleaned event files. If a bin has >2000 counts, and if more than 50% of those come from <1% of pixels, then it is considered to be noise-dominated and hence unusable.
| Quadrant | # 1 sec bins | Bins with >0 counts | Bins with >2000 counts | High rate bins dominated by noise | Noise dominated (total time) | Noise dominated (detector-on time) | Marked lightcurve |
|---|---|---|---|---|---|---|---|
| A | 7582 | 6478 | 463 | 463 | 6.11% | 7.15% | 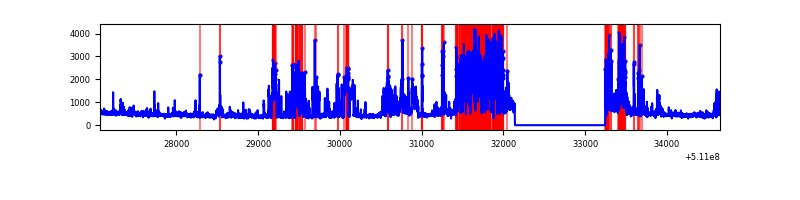 |
| B | 7582 | 6478 | 52 | 52 | 0.69% | 0.80% | 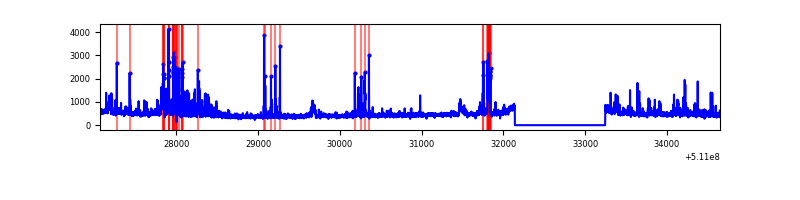 |
| C | 7583 | 6479 | 307 | 307 | 4.05% | 4.74% | 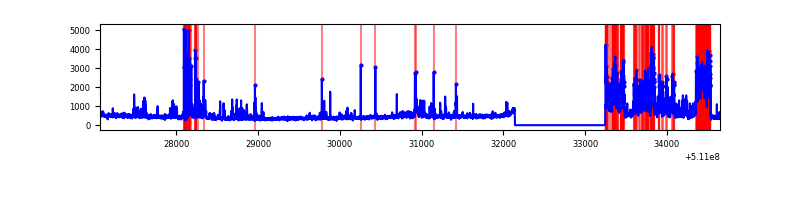 |
| D | 7583 | 6479 | 1026 | 1026 | 13.53% | 15.84% | 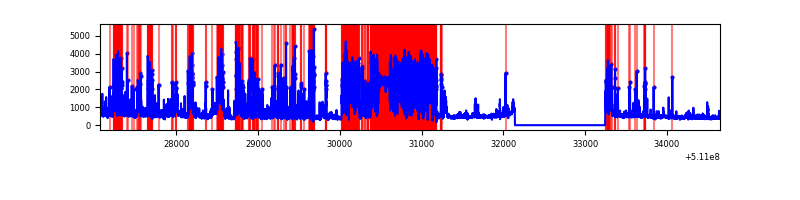 |
Top three noisy pixels from each quadrant. If the there are fewer than three noisy pixels in the level2.evt file, extra rows are filled as -1
| Pixel properties | Quadrant properties | ||||||
|---|---|---|---|---|---|---|---|
| Quadrant | DetID | PixID | Counts | Sigma | Mean | Median | Sigma |
| A | 12 | 3 | 852651 | 5073.25 | 677 | 660 | 167.9 |
| A | 4 | 95 | 574142 | 3414.85 | 677 | 660 | 167.9 |
| A | 4 | 249 | 395228 | 2349.49 | 677 | 660 | 167.9 |
| B | 10 | 247 | 198451 | 1340.56 | 697 | 675 | 147.5 |
| B | 8 | 128 | 166129 | 1121.47 | 697 | 675 | 147.5 |
| B | 4 | 141 | 69049 | 463.45 | 697 | 675 | 147.5 |
| C | 15 | 230 | 1333717 | 7345.56 | 656 | 648 | 181.5 |
| C | 13 | 3 | 126007 | 690.76 | 656 | 648 | 181.5 |
| C | 12 | 254 | 59752 | 325.68 | 656 | 648 | 181.5 |
| D | 2 | 249 | 3234805 | 18680.18 | 603 | 576 | 173.1 |
| D | 8 | 129 | 362142 | 2088.32 | 603 | 576 | 173.1 |
| D | 2 | 31 | 98870 | 567.72 | 603 | 576 | 173.1 |
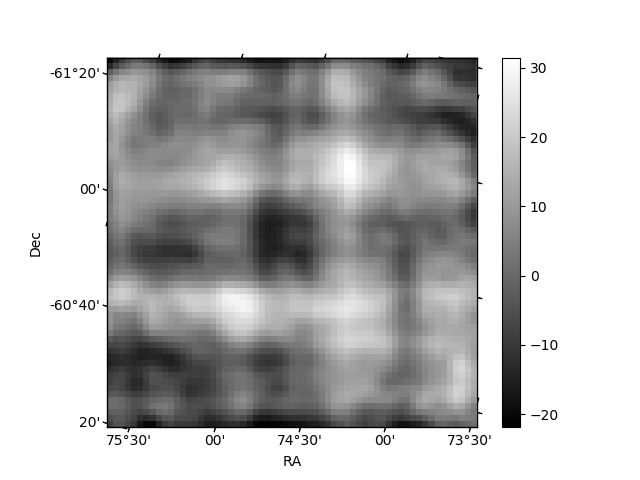
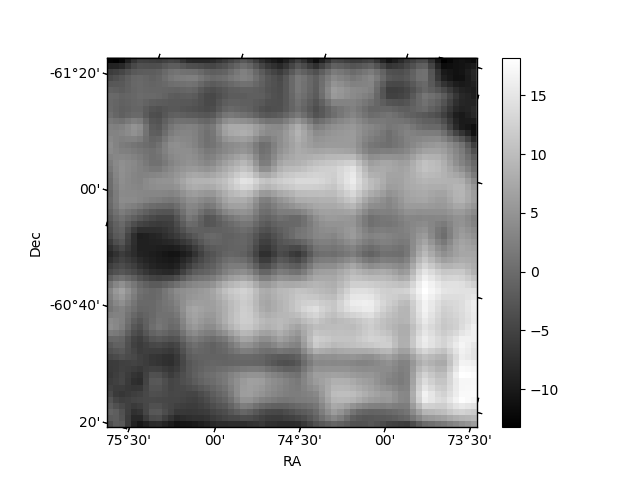
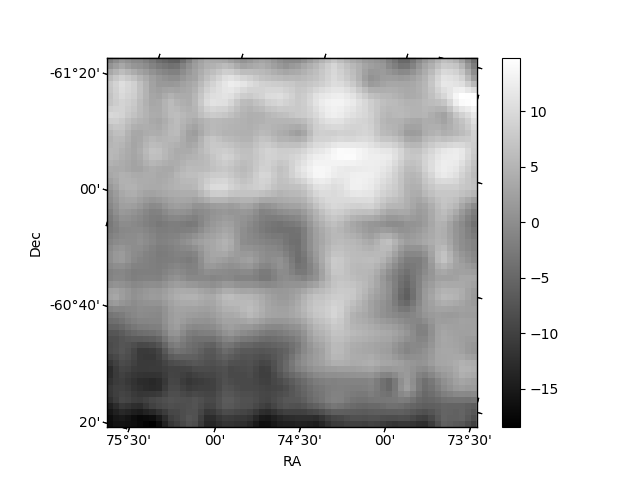
Histogram calculated using DETX and DETY for each event in the final _common_clean file
| Quadrant A | 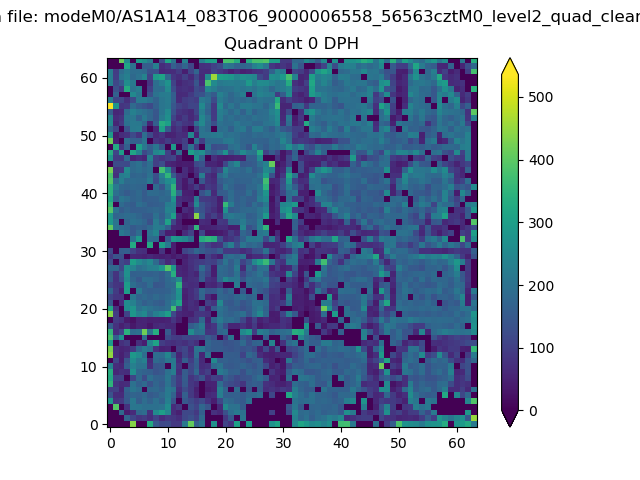 |
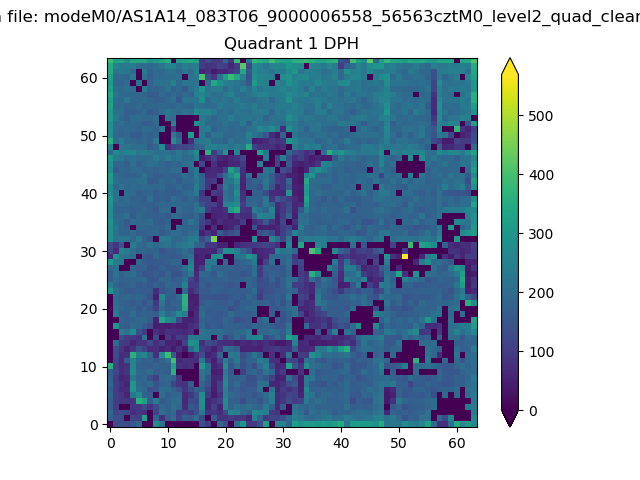 |
Quadrant B |
|---|---|---|---|
| Quadrant D | 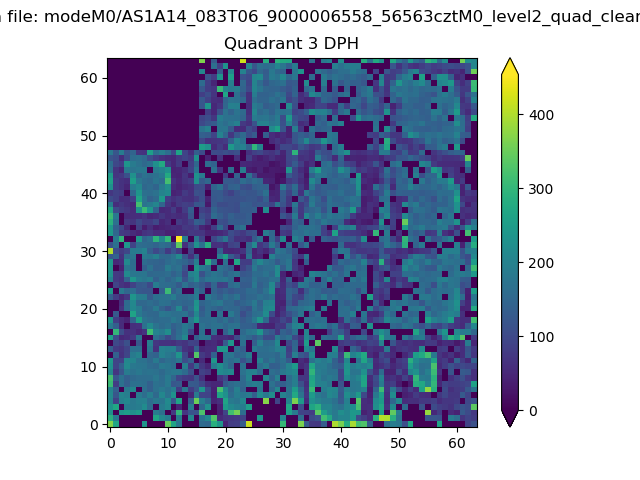 |
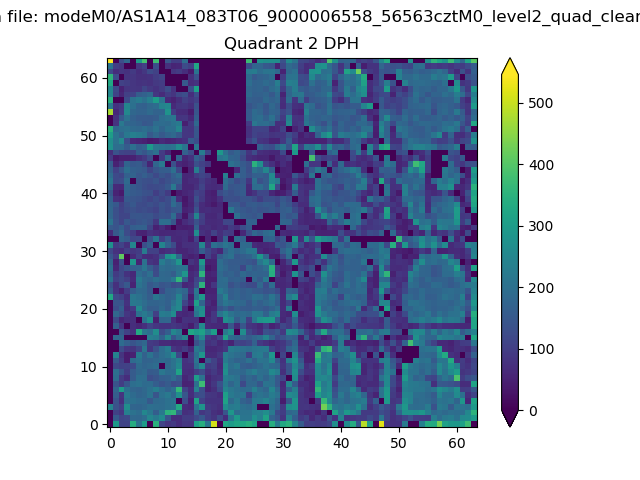 |
Quadrant C |
| Plot type | Count rate plots | Images |
|---|---|---|
| Comparison with Poisson distribution Blue bars denote a histogram of data divided into 1 sec bins. Red curve is a Poisson curve with rate = median count rate of data. |
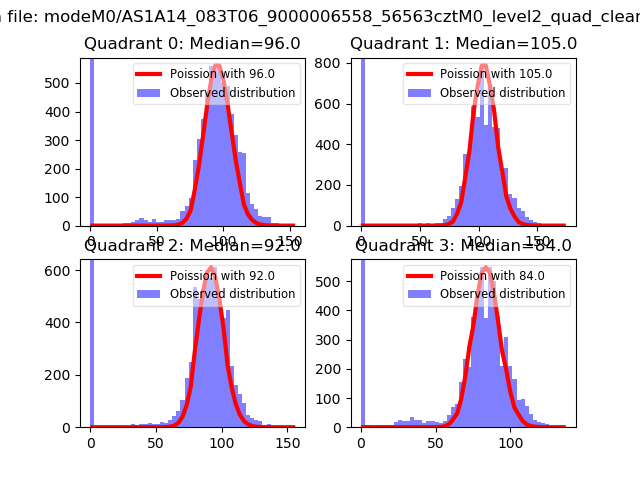 |
 |
| Quadrant-wise count rates Data is divided into 100 sec bins |
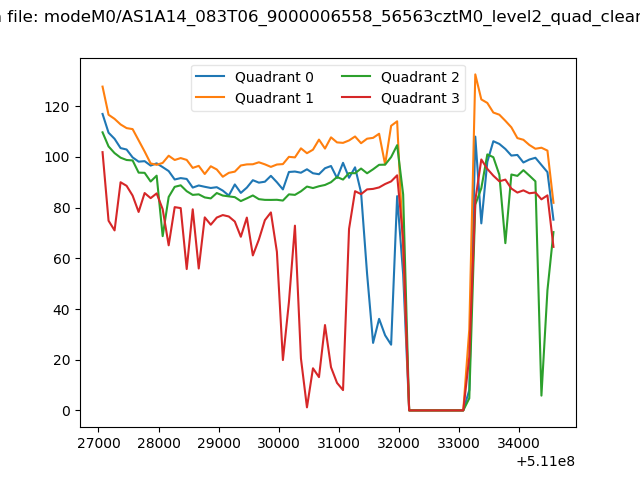 |
|
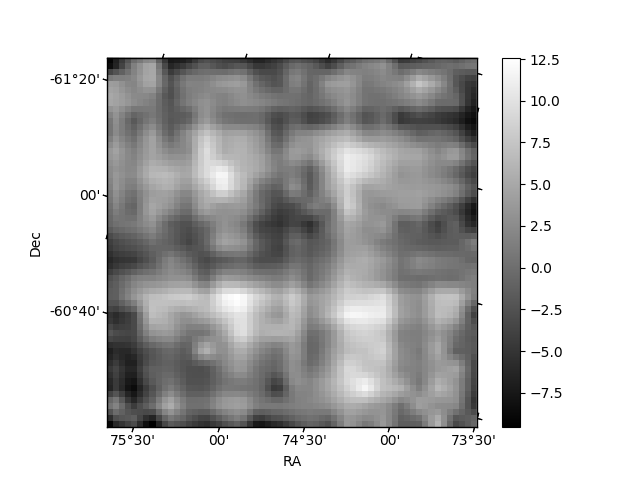
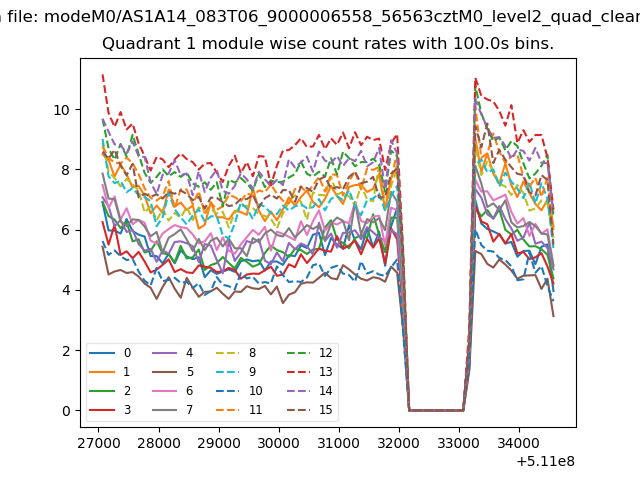
| Module-wise count rates for Quadrant A Data is divided into 100 sec bins |
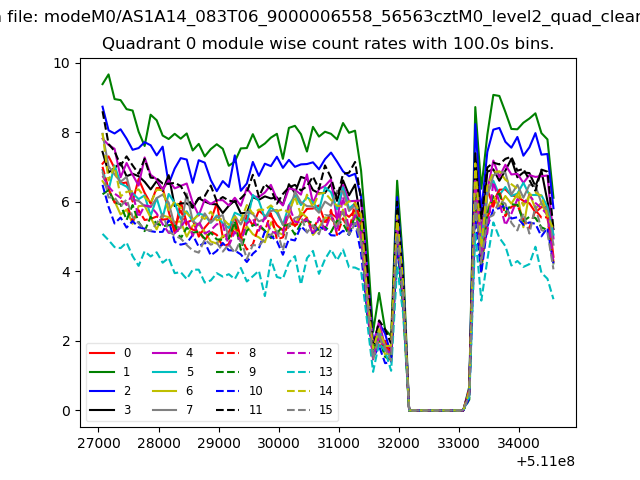 |
 |
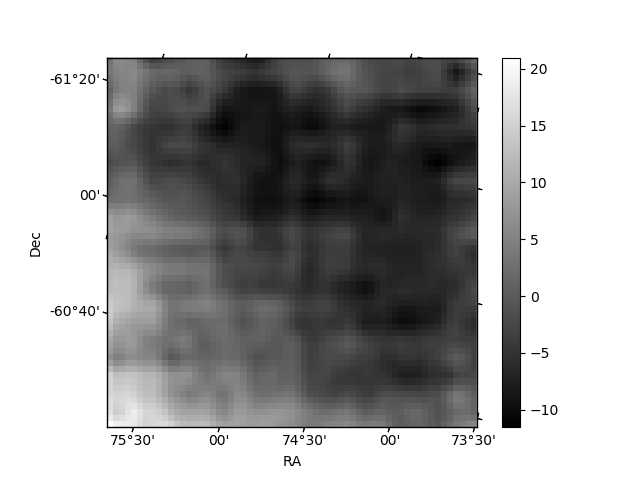
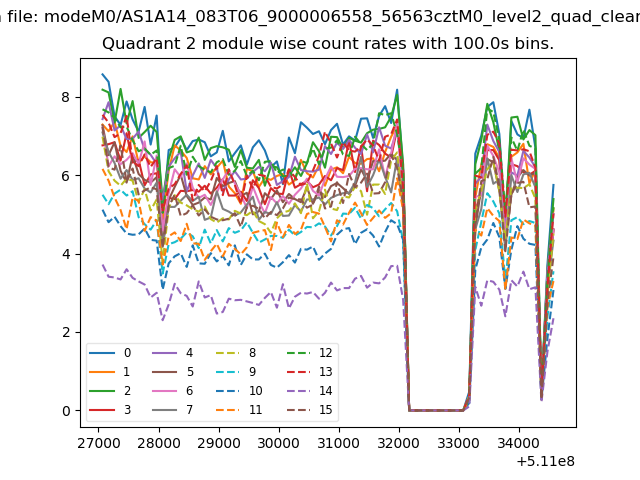
| Module-wise count rates for Quadrant B Data is divided into 100 sec bins |
 |
 |
| Module-wise count rates for Quadrant C Data is divided into 100 sec bins |
 |
 |
| Module-wise count rates for Quadrant D Data is divided into 100 sec bins |
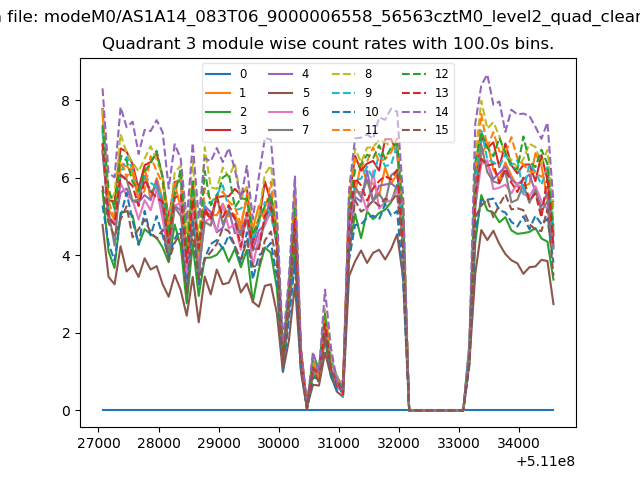 |
 |
| Parameter | Plot |
|---|---|
| CZT HV Monitor | 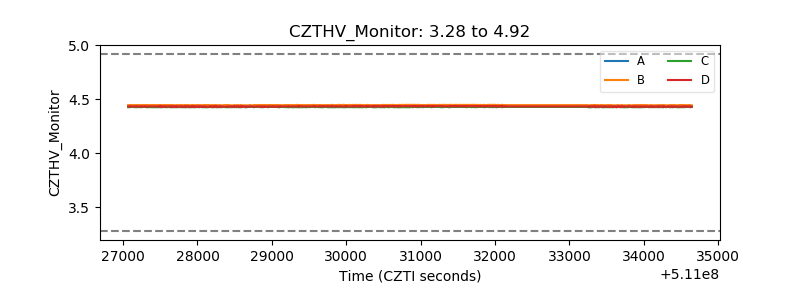 |
| D_VDD | 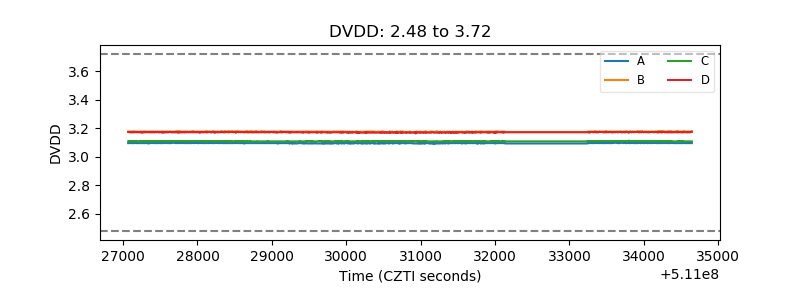 |
| Temperature 1 | 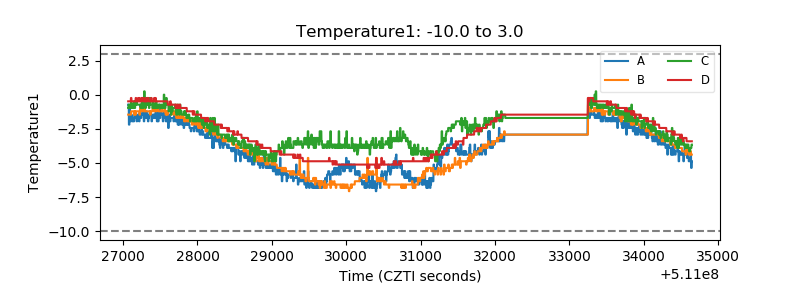 |
| Veto HV Monitor | 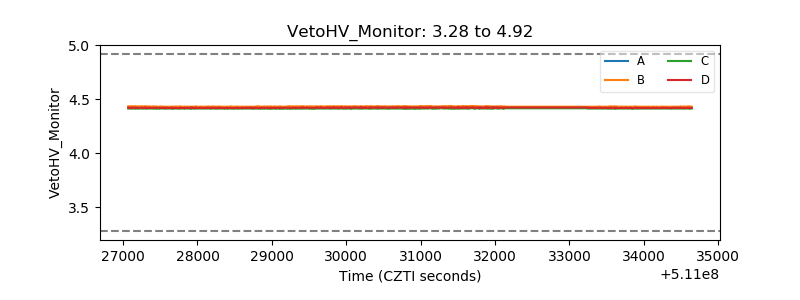 |
| Veto LLD | 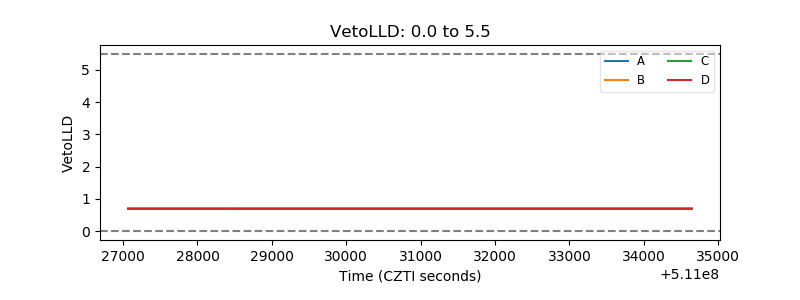 |
| Alpha Counter | 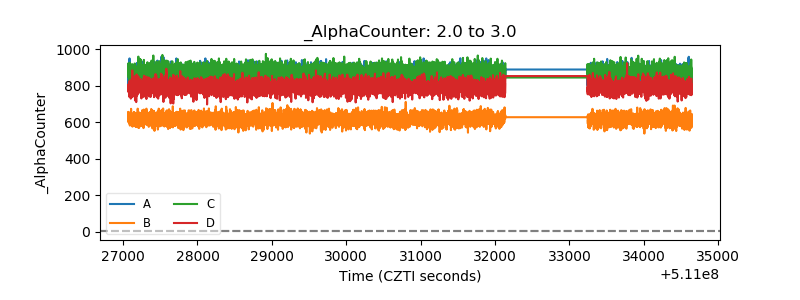 |
| _CPM_Rate | 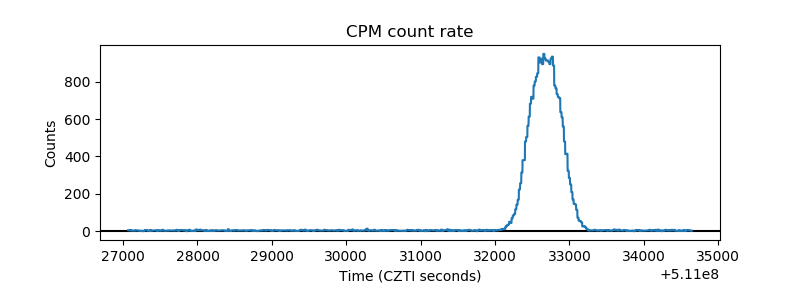 |
| CZT Counter | 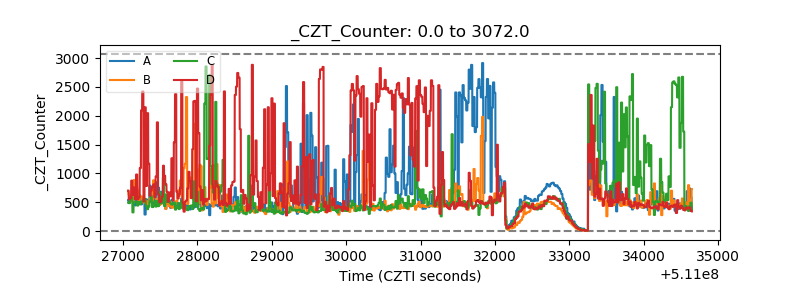 |
| +2.5 Volts monitor |  |
| +5 Volts monitor |  |
| _ROLL_ROT | 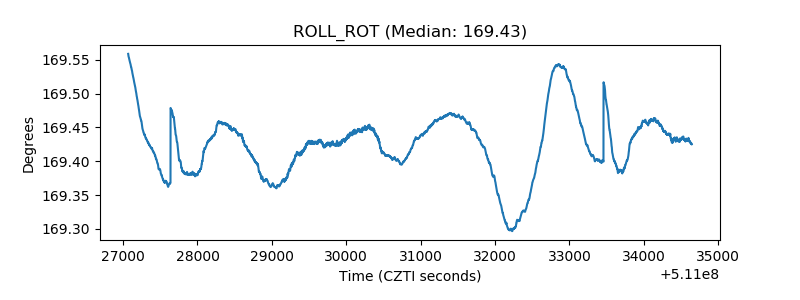 |
| _Roll_DEC | 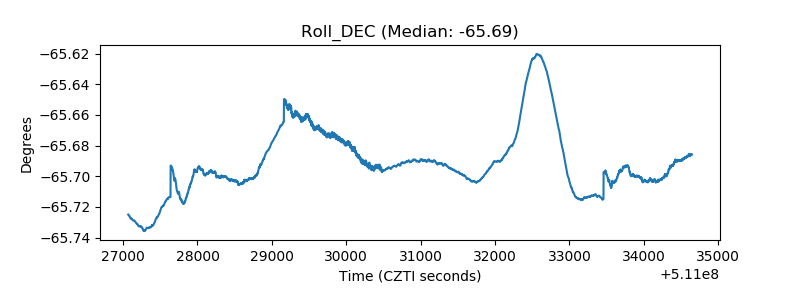 |
| _Roll_RA | 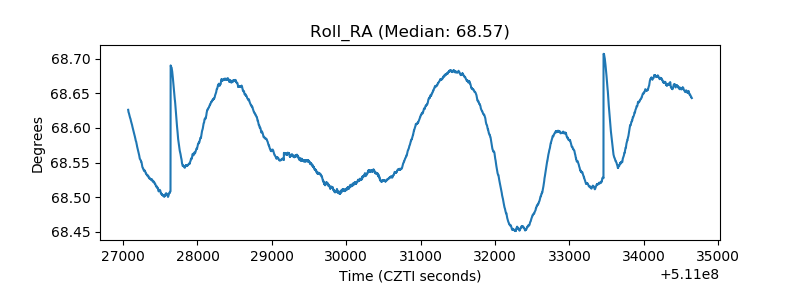 |
| Veto Counter | 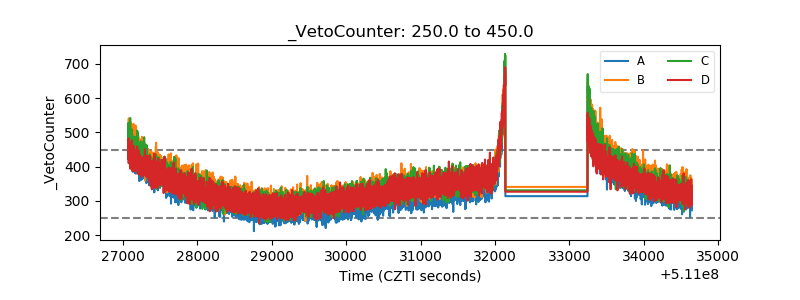 |