| Param | Original file | Final file |
|---|---|---|
| Filename | modeM0/AS1A14_083T06_9000006558_56565cztM0_level2.fits | modeM0/AS1A14_083T06_9000006558_56565cztM0_level2_quad_clean.evt |
| Size (bytes) | 431,861,760 | 92,128,320 |
| Size | 411.9 MB | 87.9 MB |
| Events in quadrant A | 3,940,817 | 611,561 |
| Events in quadrant B | 3,133,013 | 679,722 |
| Events in quadrant C | 4,460,217 | 519,581 |
| Events in quadrant D | 3,964,895 | 541,445 |
| Mode SS | |||
|---|---|---|---|
| Quadrant | BADHDUFLAG | Total packets | Discarded packets |
| A | 0 | 128 | 0 |
| B | 0 | 128 | 0 |
| C | 0 | 128 | 0 |
| D | 0 | 128 | 0 |
| Mode M9 | |||
|---|---|---|---|
| Quadrant | BADHDUFLAG | Total packets | Discarded packets |
| A | 0 | 12 | 0 |
| B | 0 | 12 | 0 |
| C | 0 | 12 | 0 |
| D | 0 | 12 | 0 |
| Mode M0 | |||
|---|---|---|---|
| Quadrant | BADHDUFLAG | Total packets | Discarded packets |
| A | 0 | 15973 | 2 |
| B | 0 | 13583 | 3 |
| C | 0 | 17870 | 2 |
| D | 0 | 16095 | 2 |
| Quadrant | Total seconds | Saturated seconds | Saturation percentage |
|---|---|---|---|
| A | 6264 | 205 | 3.272669% |
| B | 6263 | 33 | 0.526904% |
| C | 6263 | 717 | 11.448188% |
| D | 6263 | 153 | 2.442919% |
Noise dominated data is calculated using 1-second bins in cleaned event files. If a bin has >2000 counts, and if more than 50% of those come from <1% of pixels, then it is considered to be noise-dominated and hence unusable.
| Quadrant | # 1 sec bins | Bins with >0 counts | Bins with >2000 counts | High rate bins dominated by noise | Noise dominated (total time) | Noise dominated (detector-on time) | Marked lightcurve |
|---|---|---|---|---|---|---|---|
| A | 7489 | 6265 | 172 | 172 | 2.30% | 2.75% | 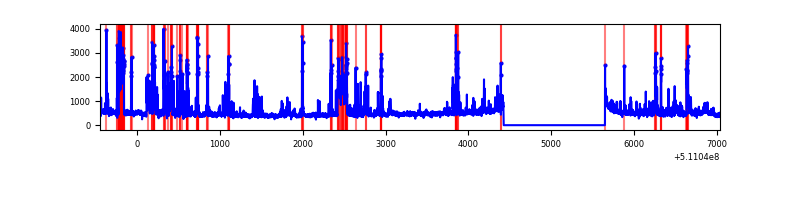 |
| B | 7488 | 6264 | 12 | 12 | 0.16% | 0.19% | 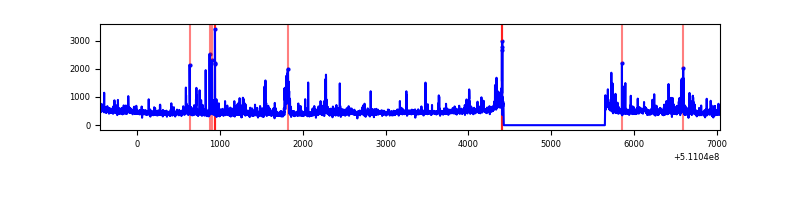 |
| C | 7488 | 6264 | 589 | 589 | 7.87% | 9.40% | 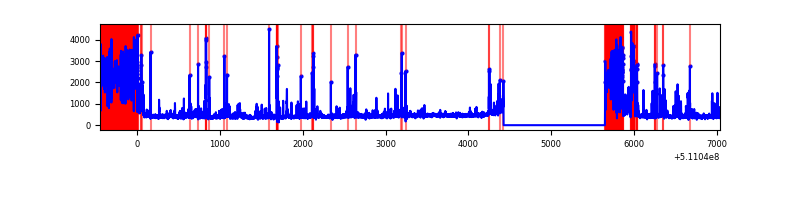 |
| D | 7488 | 6264 | 130 | 130 | 1.74% | 2.08% | 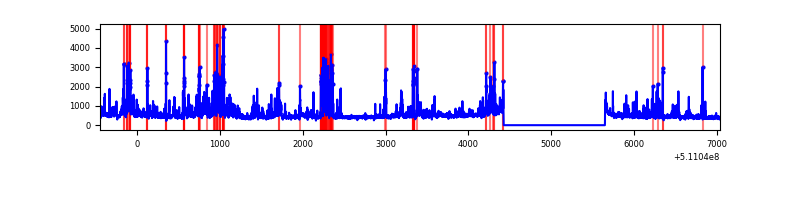 |
Top three noisy pixels from each quadrant. If the there are fewer than three noisy pixels in the level2.evt file, extra rows are filled as -1
| Pixel properties | Quadrant properties | ||||||
|---|---|---|---|---|---|---|---|
| Quadrant | DetID | PixID | Counts | Sigma | Mean | Median | Sigma |
| A | 0 | 8 | 447198 | 2692.58 | 670 | 653 | 165.8 |
| A | 4 | 249 | 252111 | 1516.24 | 670 | 653 | 165.8 |
| A | 7 | 64 | 224796 | 1351.54 | 670 | 653 | 165.8 |
| B | 4 | 171 | 105662 | 722.99 | 679 | 654 | 145.2 |
| B | 0 | 173 | 67391 | 459.49 | 679 | 654 | 145.2 |
| B | 7 | 252 | 67232 | 458.4 | 679 | 654 | 145.2 |
| C | 15 | 230 | 1533724 | 9183.08 | 603 | 596 | 167.0 |
| C | 6 | 223 | 174599 | 1042.24 | 603 | 596 | 167.0 |
| C | 5 | 250 | 101968 | 607.19 | 603 | 596 | 167.0 |
| D | 8 | 129 | 386860 | 2106.13 | 640 | 610 | 183.4 |
| D | 2 | 31 | 320490 | 1744.23 | 640 | 610 | 183.4 |
| D | 13 | 153 | 265133 | 1442.38 | 640 | 610 | 183.4 |
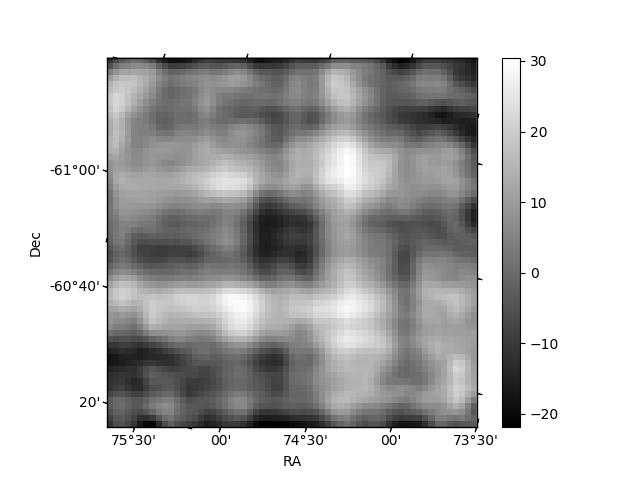
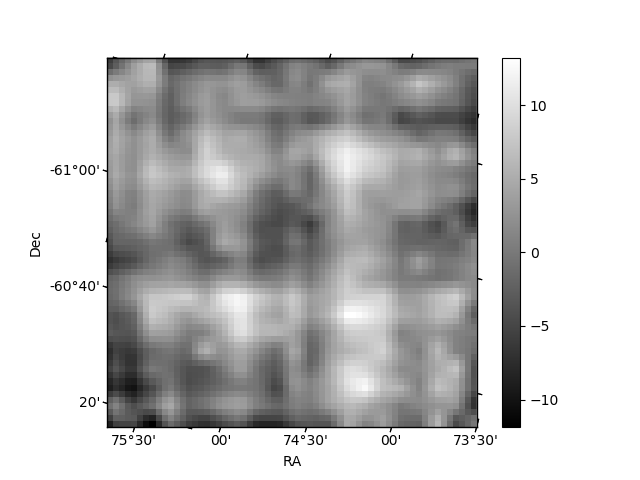
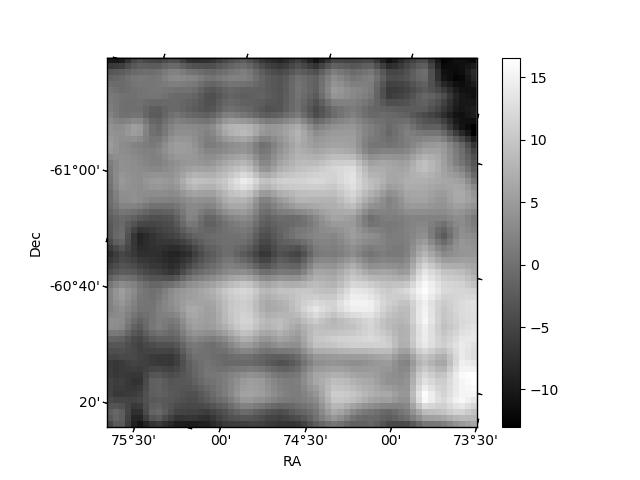
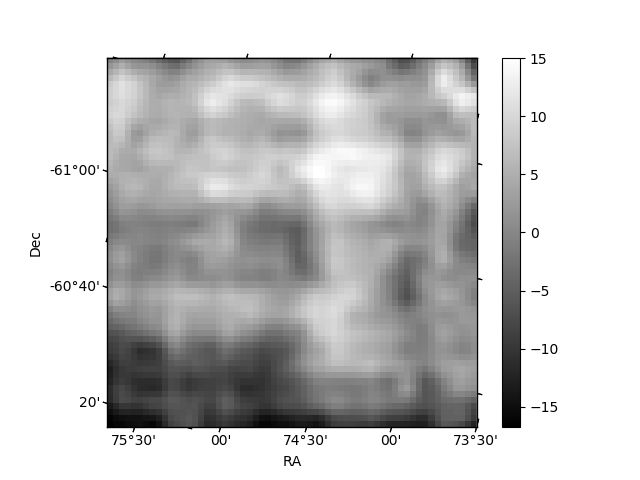
Histogram calculated using DETX and DETY for each event in the final _common_clean file
| Quadrant A | 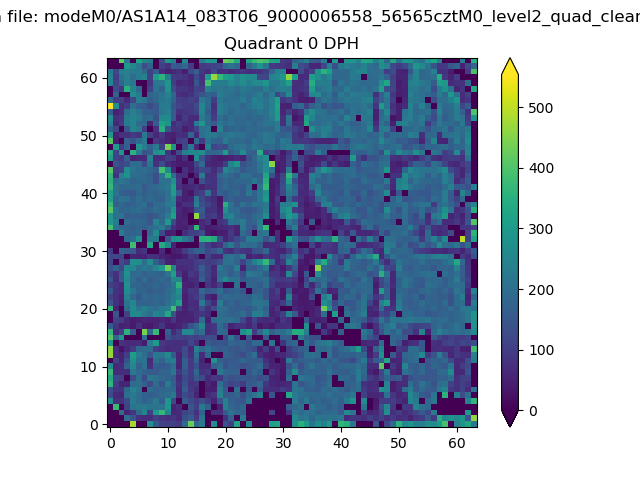 |
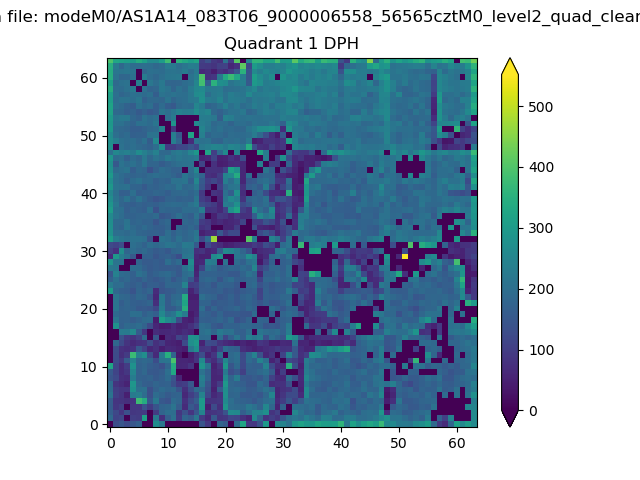 |
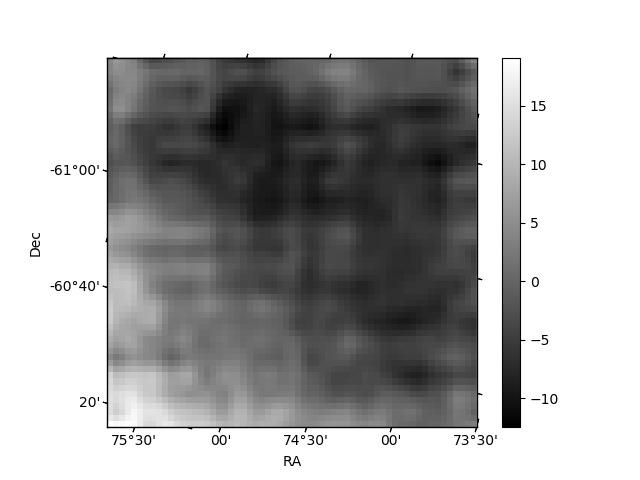
Quadrant B |
|---|---|---|---|
| Quadrant D | 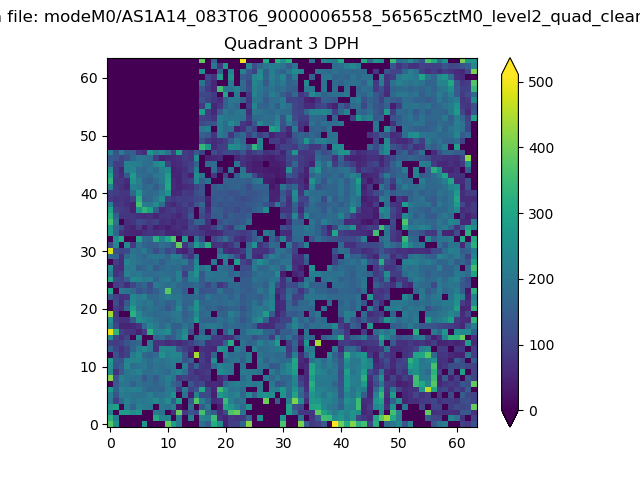 |
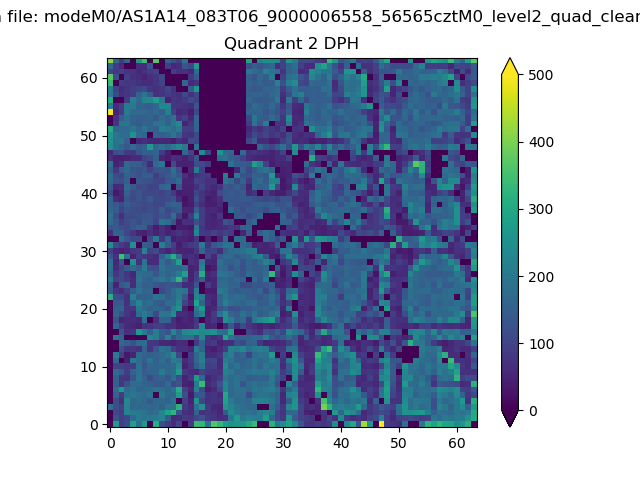 |
Quadrant C |
| Plot type | Count rate plots | Images |
|---|---|---|
| Comparison with Poisson distribution Blue bars denote a histogram of data divided into 1 sec bins. Red curve is a Poisson curve with rate = median count rate of data. |
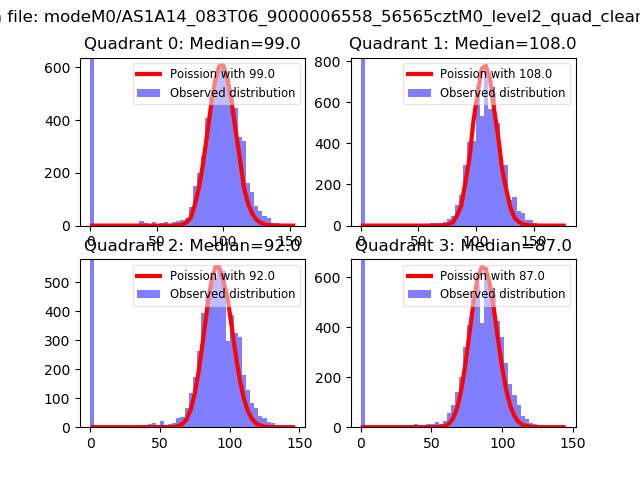 |
 |
| Quadrant-wise count rates Data is divided into 100 sec bins |
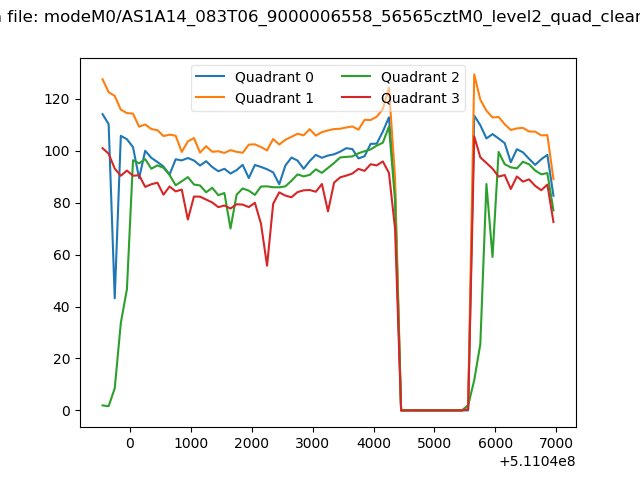 |
|
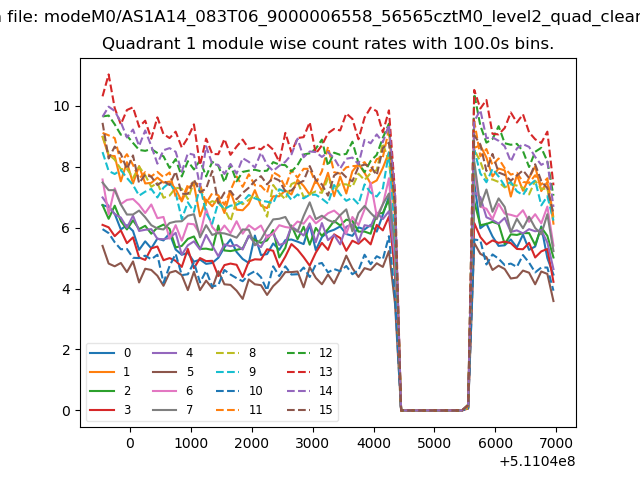
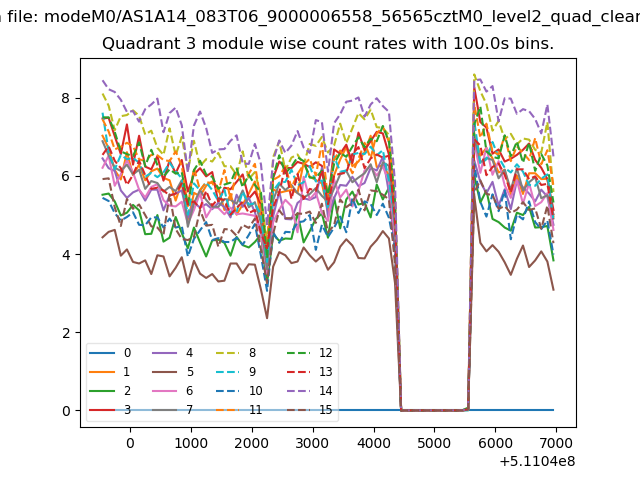
| Module-wise count rates for Quadrant A Data is divided into 100 sec bins |
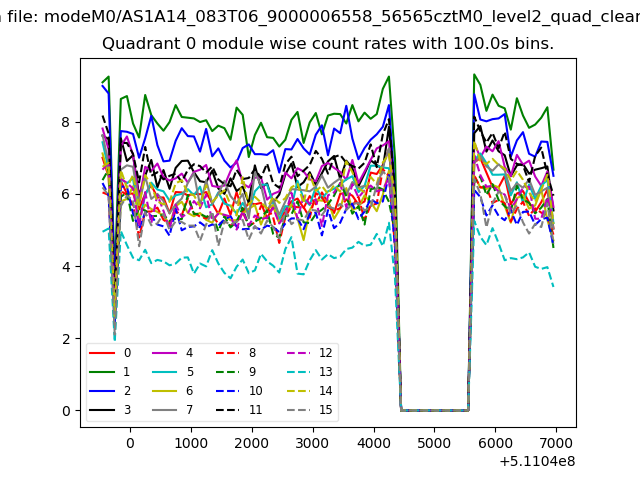 |
 |
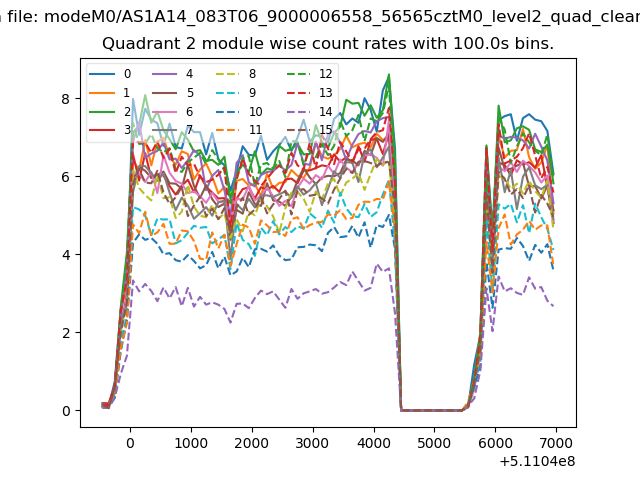
| Module-wise count rates for Quadrant B Data is divided into 100 sec bins |
 |
 |
| Module-wise count rates for Quadrant C Data is divided into 100 sec bins |
 |
 |
| Module-wise count rates for Quadrant D Data is divided into 100 sec bins |
 |
 |
| Parameter | Plot |
|---|---|
| CZT HV Monitor | 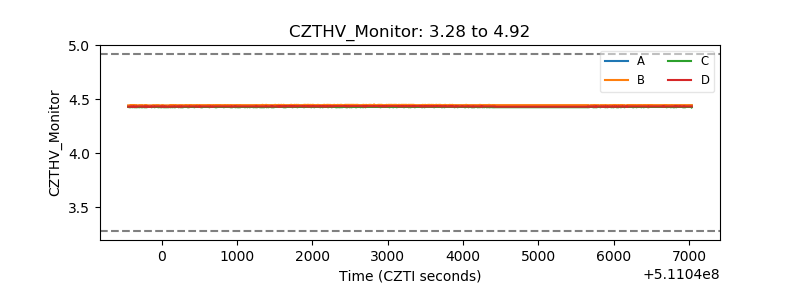 |
| D_VDD | 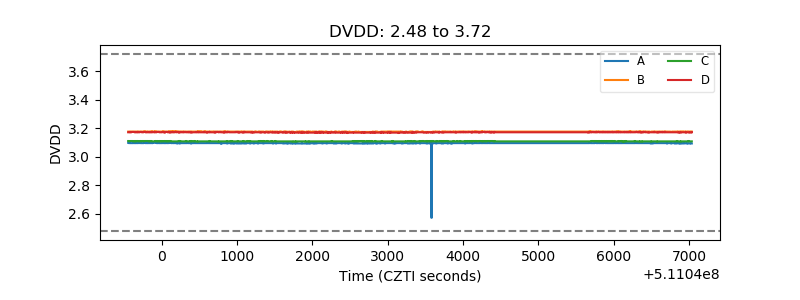 |
| Temperature 1 | 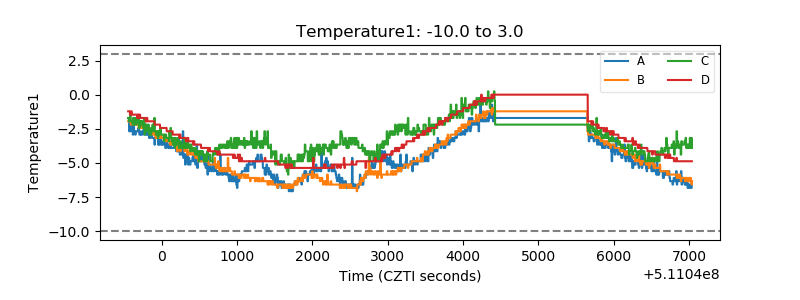 |
| Veto HV Monitor | 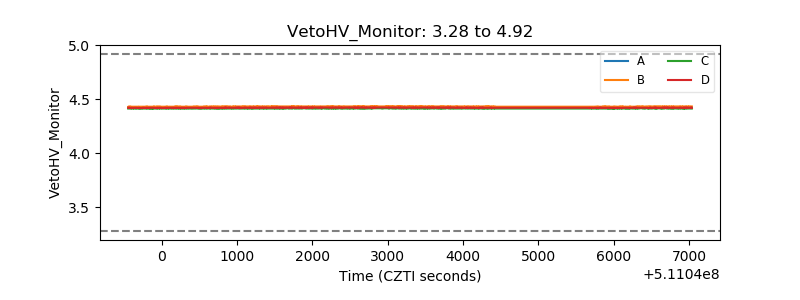 |
| Veto LLD | 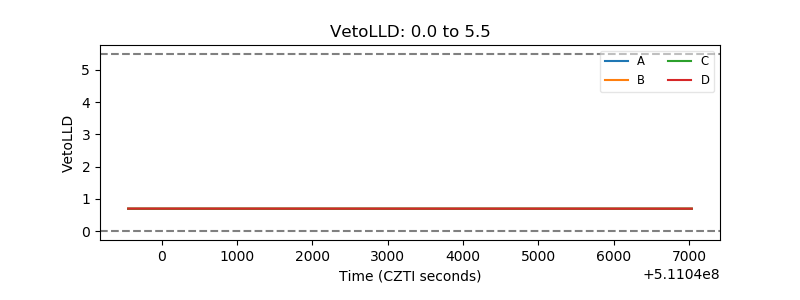 |
| Alpha Counter | 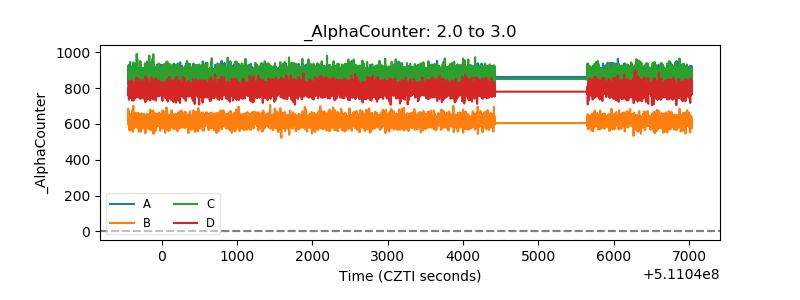 |
| _CPM_Rate | 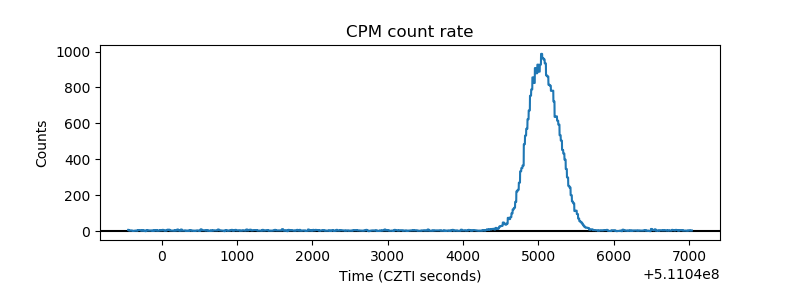 |
| CZT Counter | 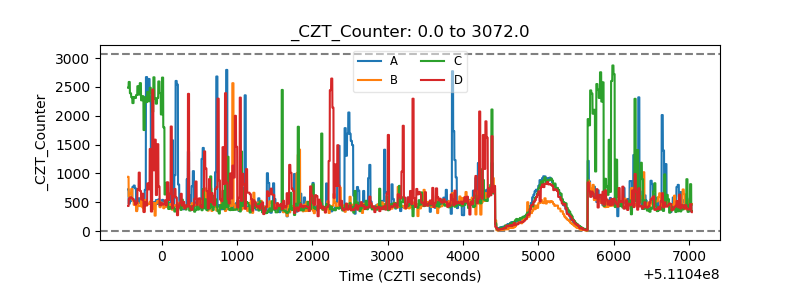 |
| +2.5 Volts monitor |  |
| +5 Volts monitor |  |
| _ROLL_ROT | 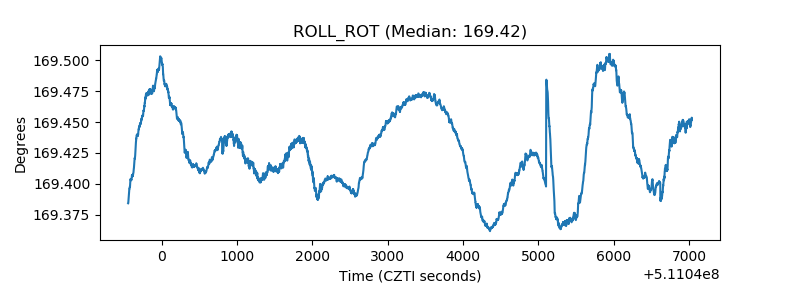 |
| _Roll_DEC | 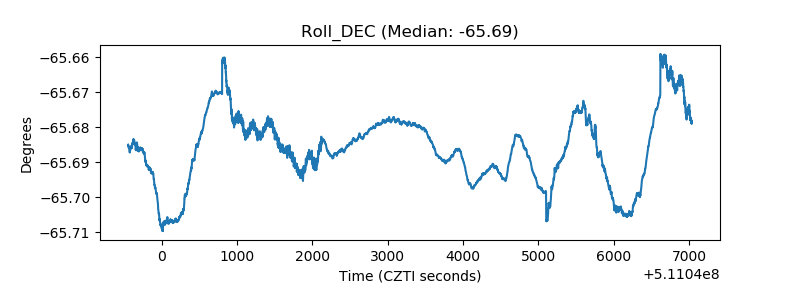 |
| _Roll_RA | 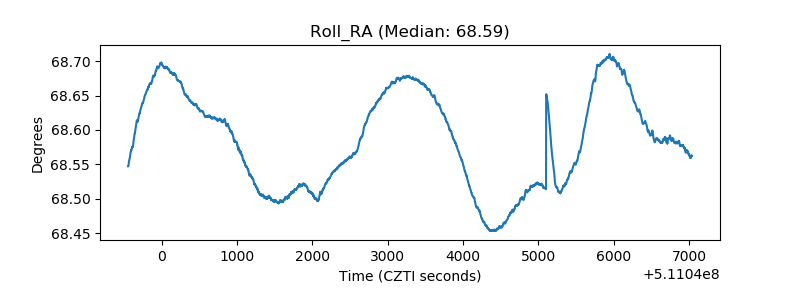 |
| Veto Counter | 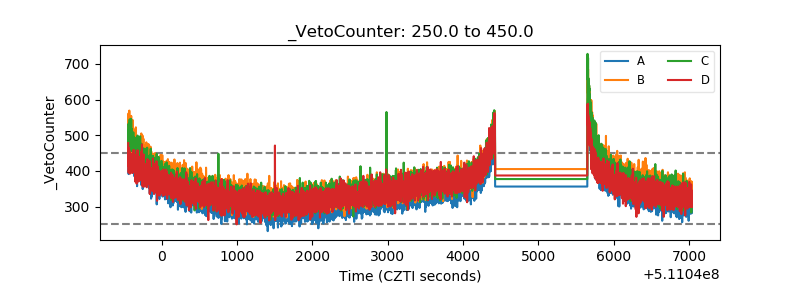 |