| Param | Original file | Final file |
|---|---|---|
| Filename | modeM0/AS1A14_083T06_9000006558_56566cztM0_level2.fits | modeM0/AS1A14_083T06_9000006558_56566cztM0_level2_quad_clean.evt |
| Size (bytes) | 576,446,400 | 84,274,560 |
| Size | 549.7 MB | 80.4 MB |
| Events in quadrant A | 9,729,361 | 358,216 |
| Events in quadrant B | 3,146,830 | 676,584 |
| Events in quadrant C | 3,781,434 | 561,831 |
| Events in quadrant D | 4,189,017 | 514,162 |
| Mode SS | |||
|---|---|---|---|
| Quadrant | BADHDUFLAG | Total packets | Discarded packets |
| A | 0 | 128 | 0 |
| B | 0 | 128 | 0 |
| C | 0 | 128 | 0 |
| D | 0 | 128 | 0 |
| Mode M9 | |||
|---|---|---|---|
| Quadrant | BADHDUFLAG | Total packets | Discarded packets |
| A | 0 | 16 | 0 |
| B | 0 | 17 | 0 |
| C | 0 | 17 | 0 |
| D | 0 | 17 | 0 |
| Mode M0 | |||
|---|---|---|---|
| Quadrant | BADHDUFLAG | Total packets | Discarded packets |
| A | 0 | 33158 | 3 |
| B | 0 | 13762 | 2 |
| C | 0 | 16032 | 2 |
| D | 0 | 17045 | 2 |
| Quadrant | Total seconds | Saturated seconds | Saturation percentage |
|---|---|---|---|
| A | 6320 | 2821 | 44.636076% |
| B | 6320 | 64 | 1.012658% |
| C | 6320 | 341 | 5.395570% |
| D | 6320 | 441 | 6.977848% |
Noise dominated data is calculated using 1-second bins in cleaned event files. If a bin has >2000 counts, and if more than 50% of those come from <1% of pixels, then it is considered to be noise-dominated and hence unusable.
| Quadrant | # 1 sec bins | Bins with >0 counts | Bins with >2000 counts | High rate bins dominated by noise | Noise dominated (total time) | Noise dominated (detector-on time) | Marked lightcurve |
|---|---|---|---|---|---|---|---|
| A | 7485 | 6320 | 2579 | 2579 | 34.46% | 40.81% | 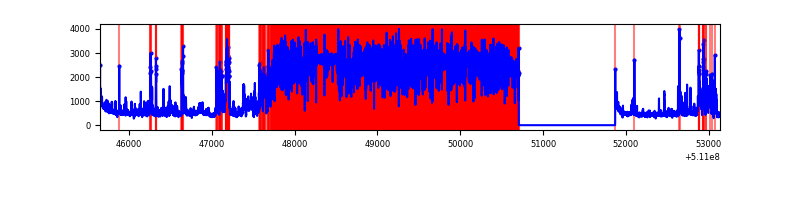 |
| B | 7485 | 6321 | 18 | 18 | 0.24% | 0.28% | 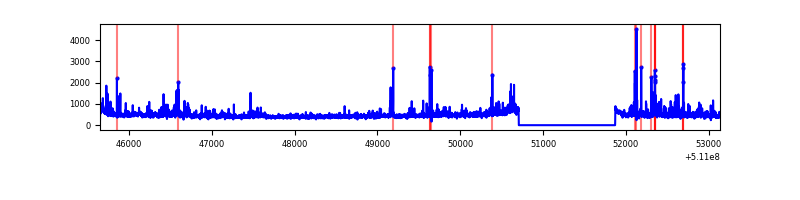 |
| C | 7485 | 6321 | 283 | 283 | 3.78% | 4.48% | 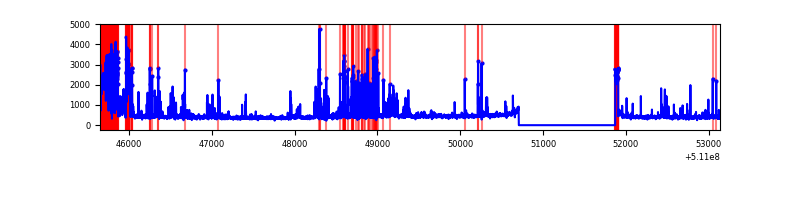 |
| D | 7485 | 6320 | 355 | 355 | 4.74% | 5.62% | 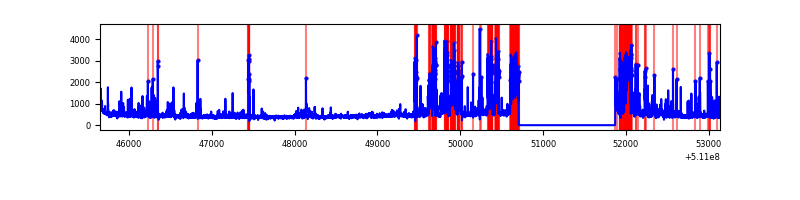 |
Top three noisy pixels from each quadrant. If the there are fewer than three noisy pixels in the level2.evt file, extra rows are filled as -1
| Pixel properties | Quadrant properties | ||||||
|---|---|---|---|---|---|---|---|
| Quadrant | DetID | PixID | Counts | Sigma | Mean | Median | Sigma |
| A | 7 | 64 | 5017159 | 37477.06 | 532 | 519 | 133.9 |
| A | 12 | 3 | 1789133 | 13361.93 | 532 | 519 | 133.9 |
| A | 4 | 95 | 332296 | 2478.56 | 532 | 519 | 133.9 |
| B | 10 | 247 | 116419 | 795.92 | 683 | 657 | 145.4 |
| B | 4 | 171 | 86750 | 591.93 | 683 | 657 | 145.4 |
| B | 4 | 21 | 80049 | 545.86 | 683 | 657 | 145.4 |
| C | 15 | 230 | 586729 | 3374.35 | 636 | 630 | 173.7 |
| C | 13 | 3 | 347315 | 1995.97 | 636 | 630 | 173.7 |
| C | 6 | 223 | 101471 | 580.57 | 636 | 630 | 173.7 |
| D | 2 | 249 | 773493 | 4328.57 | 626 | 597 | 178.6 |
| D | 8 | 129 | 441302 | 2468.15 | 626 | 597 | 178.6 |
| D | 5 | 32 | 125718 | 700.73 | 626 | 597 | 178.6 |
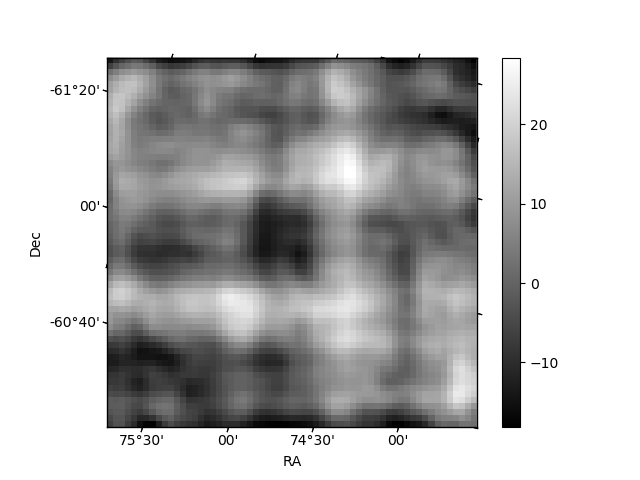
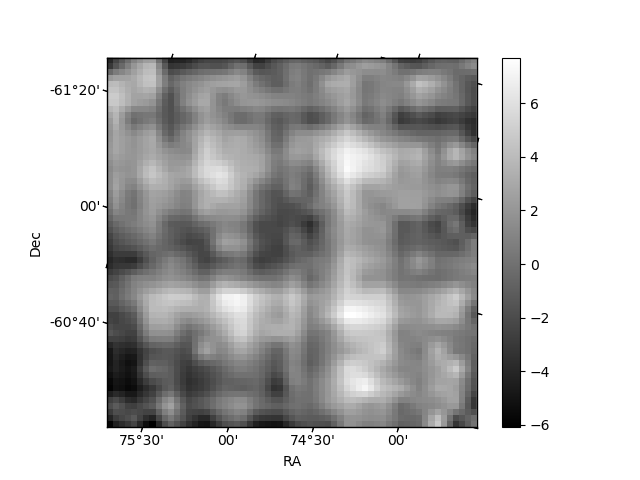
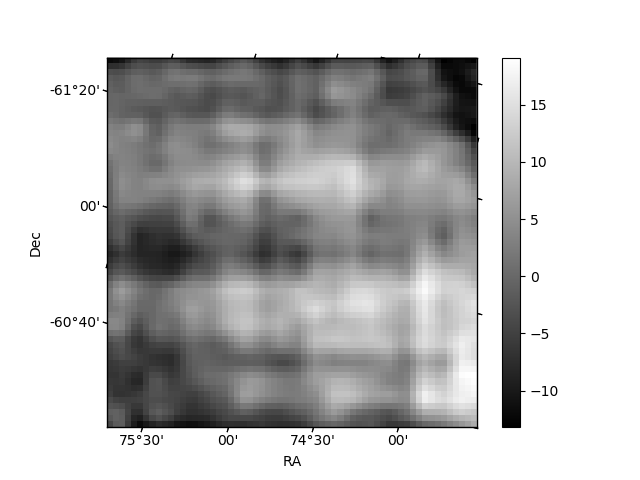
Histogram calculated using DETX and DETY for each event in the final _common_clean file
| Quadrant A | 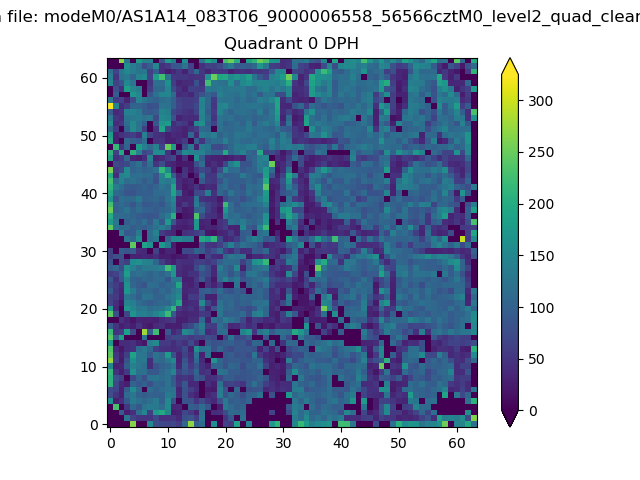 |
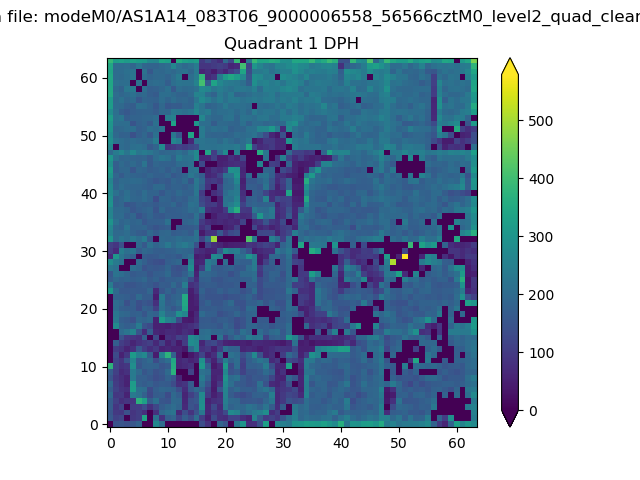 |
Quadrant B |
|---|---|---|---|
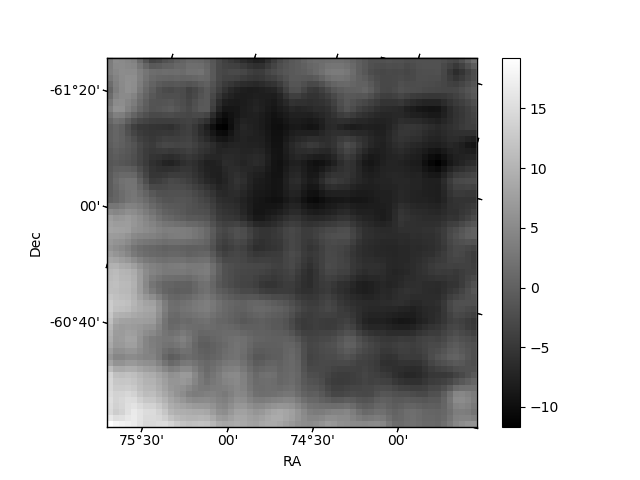
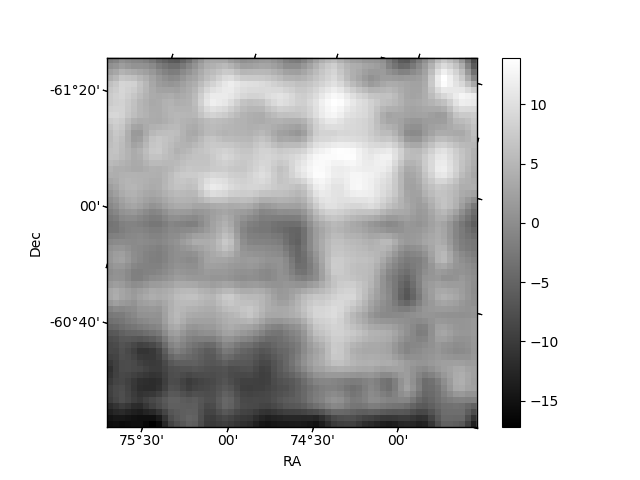
| Quadrant D | 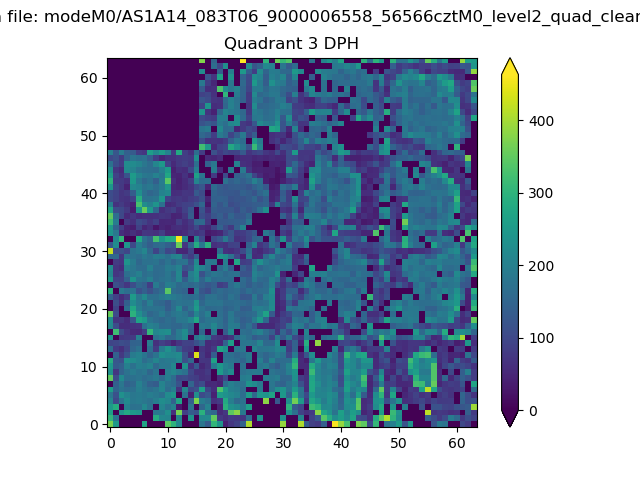 |
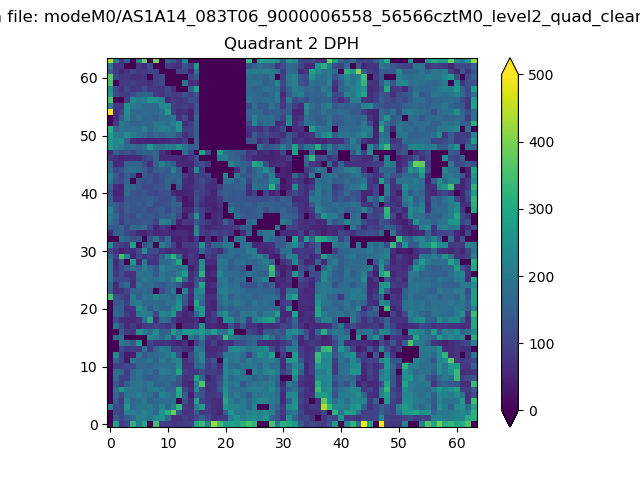 |
Quadrant C |
| Plot type | Count rate plots | Images |
|---|---|---|
| Comparison with Poisson distribution Blue bars denote a histogram of data divided into 1 sec bins. Red curve is a Poisson curve with rate = median count rate of data. |
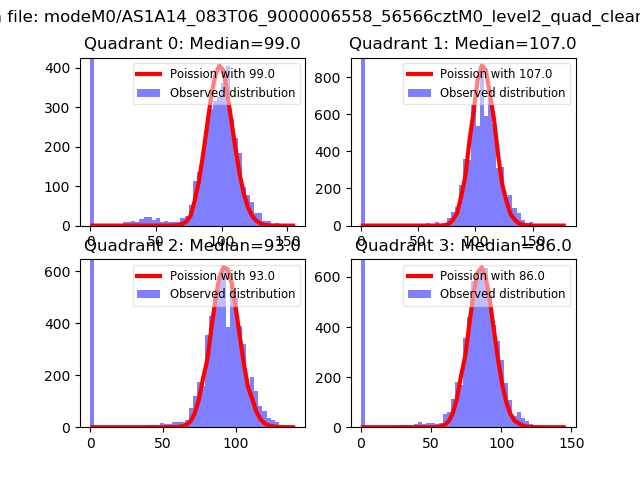 |
 |
| Quadrant-wise count rates Data is divided into 100 sec bins |
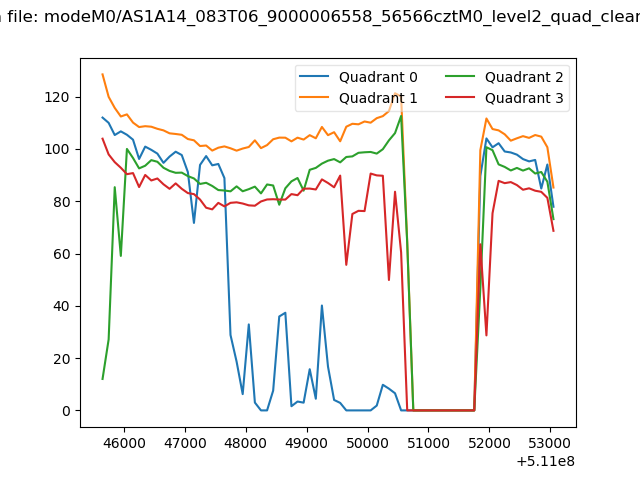 |
|
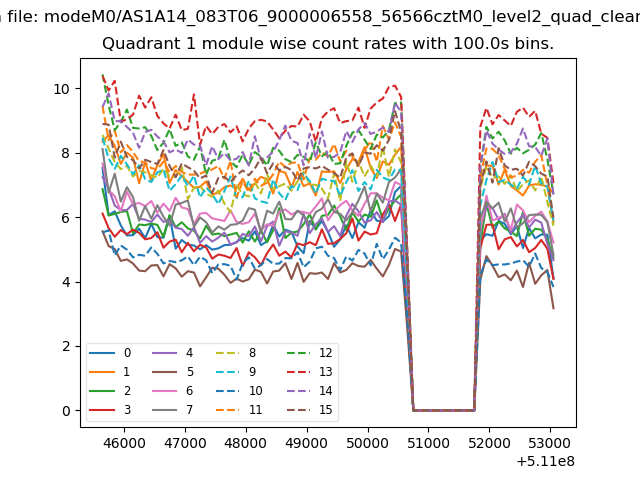
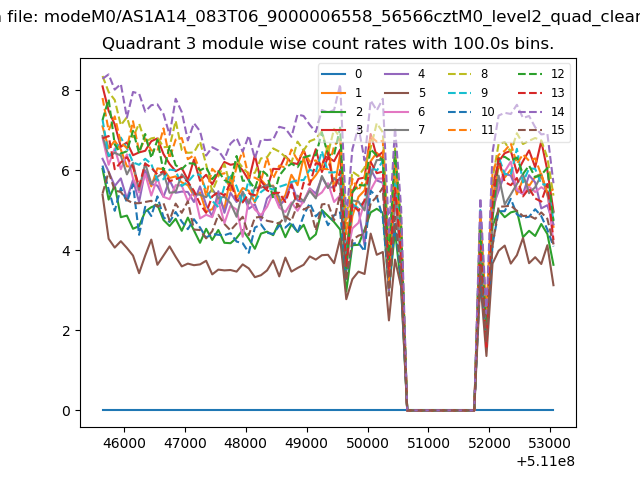
| Module-wise count rates for Quadrant A Data is divided into 100 sec bins |
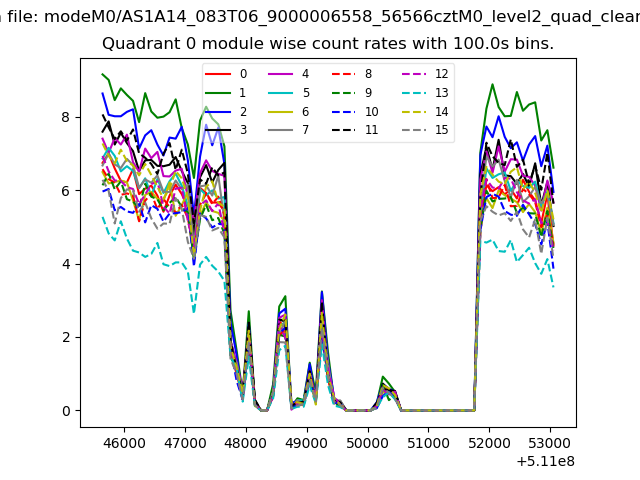 |
 |
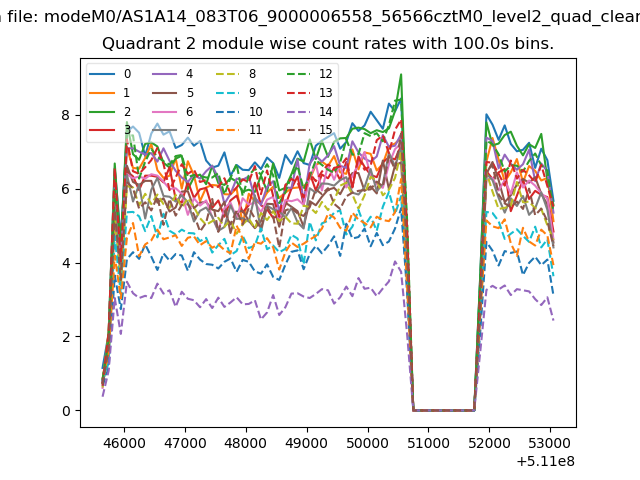
| Module-wise count rates for Quadrant B Data is divided into 100 sec bins |
 |
 |
| Module-wise count rates for Quadrant C Data is divided into 100 sec bins |
 |
 |
| Module-wise count rates for Quadrant D Data is divided into 100 sec bins |
 |
 |
| Parameter | Plot |
|---|---|
| CZT HV Monitor | 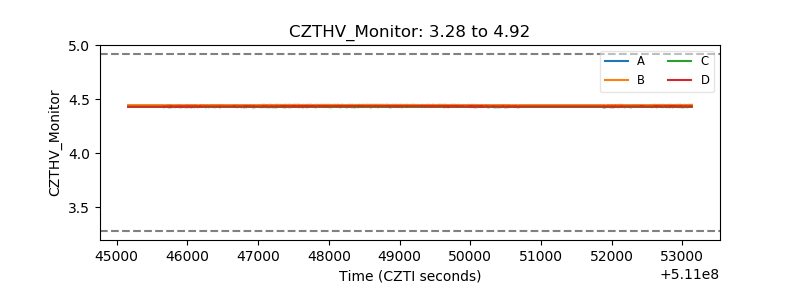 |
| D_VDD | 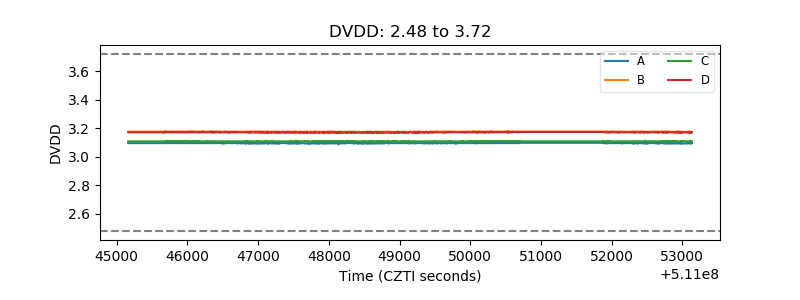 |
| Temperature 1 | 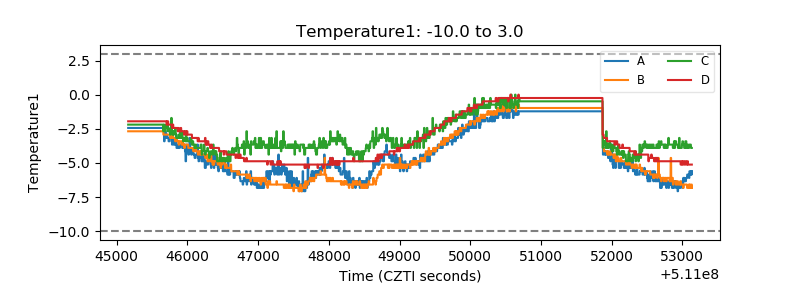 |
| Veto HV Monitor | 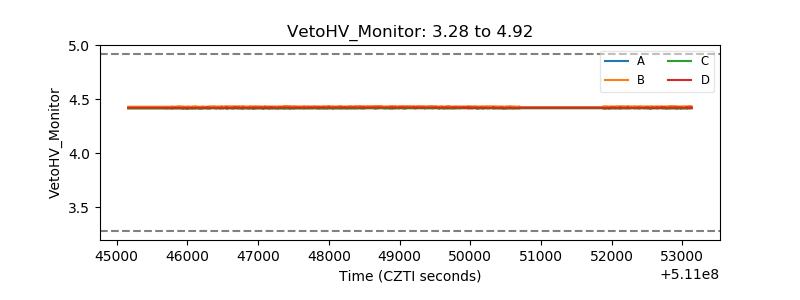 |
| Veto LLD | 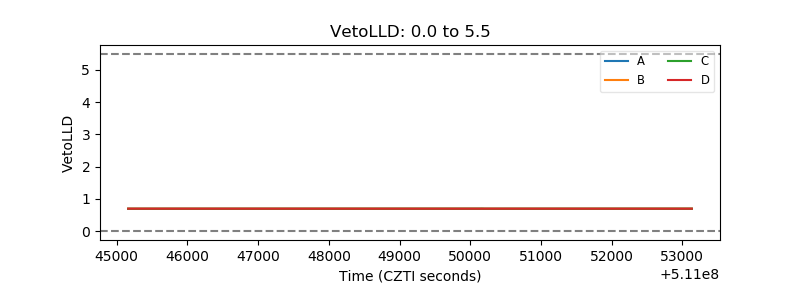 |
| Alpha Counter | 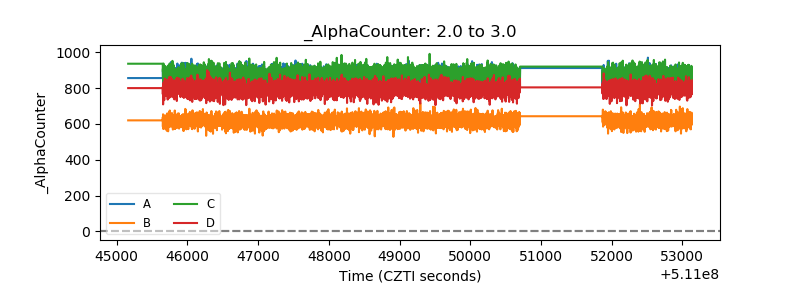 |
| _CPM_Rate | 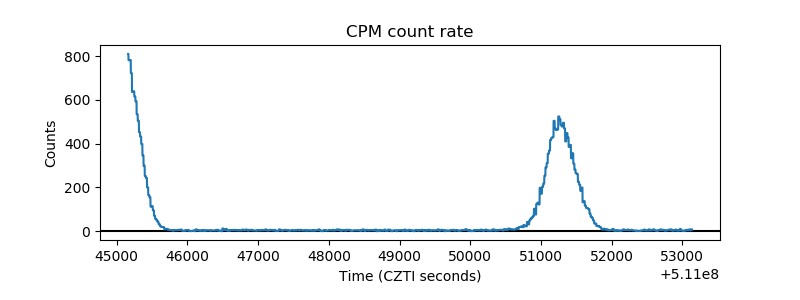 |
| CZT Counter | 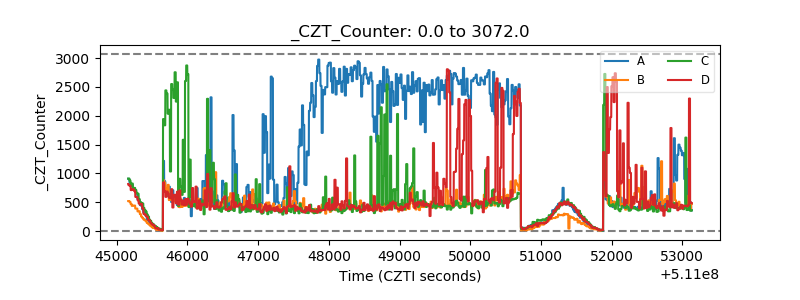 |
| +2.5 Volts monitor |  |
| +5 Volts monitor |  |
| _ROLL_ROT | 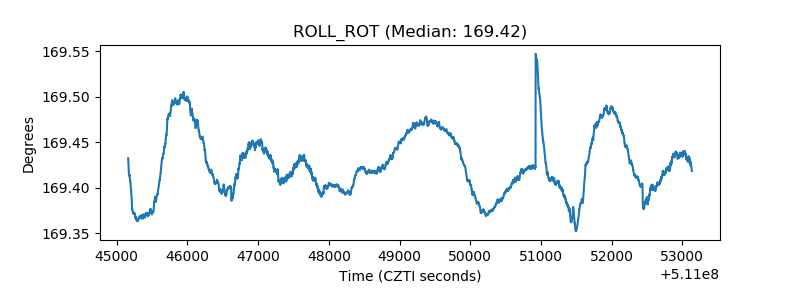 |
| _Roll_DEC | 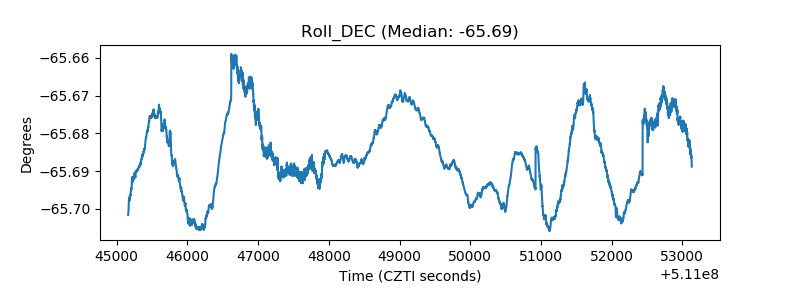 |
| _Roll_RA | 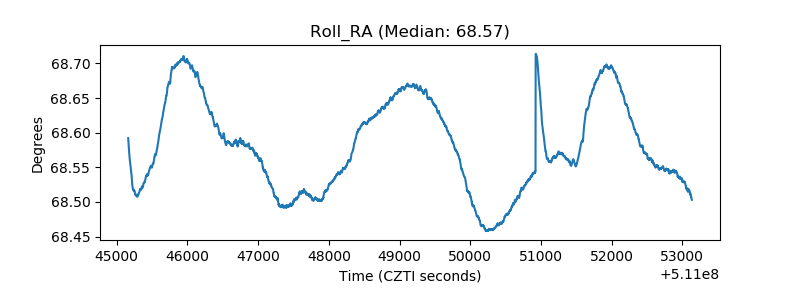 |
| Veto Counter | 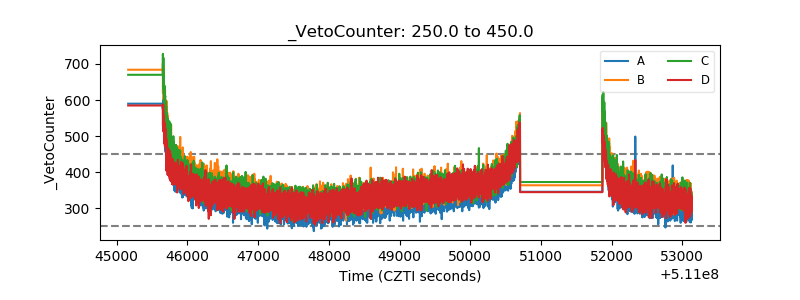 |