| Param | Original file | Final file |
|---|---|---|
| Filename | modeM0/AS1A14_083T06_9000006558_56567cztM0_level2.fits | modeM0/AS1A14_083T06_9000006558_56567cztM0_level2_quad_clean.evt |
| Size (bytes) | 458,881,920 | 94,792,320 |
| Size | 437.6 MB | 90.4 MB |
| Events in quadrant A | 4,347,383 | 615,402 |
| Events in quadrant B | 3,304,318 | 690,026 |
| Events in quadrant C | 3,412,208 | 591,219 |
| Events in quadrant D | 5,404,531 | 509,570 |
| Mode SS | |||
|---|---|---|---|
| Quadrant | BADHDUFLAG | Total packets | Discarded packets |
| A | 0 | 134 | 0 |
| B | 0 | 134 | 0 |
| C | 0 | 134 | 0 |
| D | 0 | 134 | 0 |
| Mode M9 | |||
|---|---|---|---|
| Quadrant | BADHDUFLAG | Total packets | Discarded packets |
| A | 0 | 16 | 0 |
| B | 0 | 16 | 0 |
| C | 0 | 17 | 0 |
| D | 0 | 17 | 0 |
| Mode M0 | |||
|---|---|---|---|
| Quadrant | BADHDUFLAG | Total packets | Discarded packets |
| A | 0 | 17661 | 1 |
| B | 0 | 14543 | 1 |
| C | 0 | 15274 | 1 |
| D | 0 | 20769 | 1 |
| Quadrant | Total seconds | Saturated seconds | Saturation percentage |
|---|---|---|---|
| A | 6658 | 342 | 5.136678% |
| B | 6658 | 82 | 1.231601% |
| C | 6658 | 206 | 3.094022% |
| D | 6658 | 743 | 11.159507% |
Noise dominated data is calculated using 1-second bins in cleaned event files. If a bin has >2000 counts, and if more than 50% of those come from <1% of pixels, then it is considered to be noise-dominated and hence unusable.
| Quadrant | # 1 sec bins | Bins with >0 counts | Bins with >2000 counts | High rate bins dominated by noise | Noise dominated (total time) | Noise dominated (detector-on time) | Marked lightcurve |
|---|---|---|---|---|---|---|---|
| A | 7618 | 6659 | 255 | 255 | 3.35% | 3.83% | 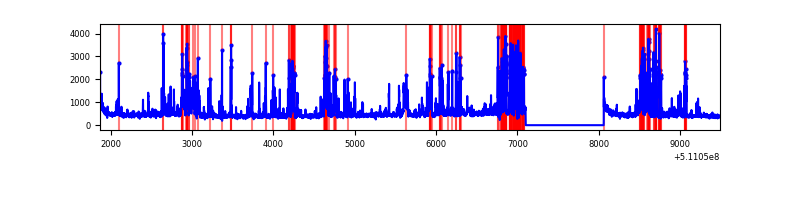 |
| B | 7618 | 6659 | 20 | 20 | 0.26% | 0.30% | 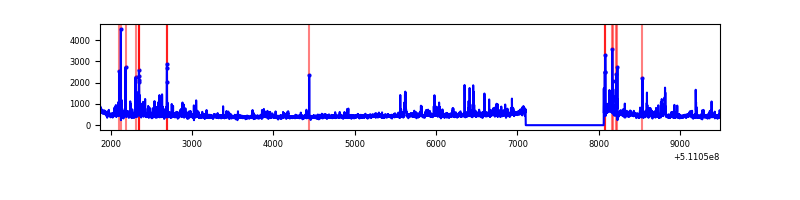 |
| C | 7618 | 6659 | 171 | 171 | 2.24% | 2.57% | 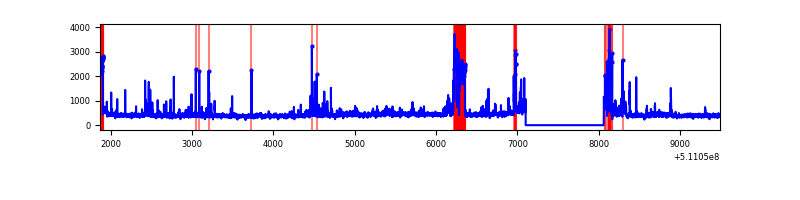 |
| D | 7618 | 6659 | 680 | 680 | 8.93% | 10.21% | 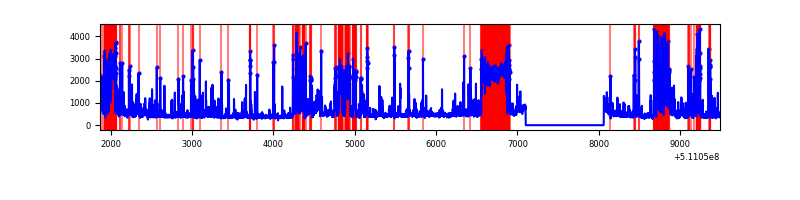 |
Top three noisy pixels from each quadrant. If the there are fewer than three noisy pixels in the level2.evt file, extra rows are filled as -1
| Pixel properties | Quadrant properties | ||||||
|---|---|---|---|---|---|---|---|
| Quadrant | DetID | PixID | Counts | Sigma | Mean | Median | Sigma |
| A | 0 | 8 | 905759 | 5285.22 | 694 | 681 | 171.2 |
| A | 4 | 95 | 332469 | 1937.48 | 694 | 681 | 171.2 |
| A | 12 | 3 | 112733 | 654.33 | 694 | 681 | 171.2 |
| B | 4 | 21 | 102475 | 668.86 | 708 | 682 | 152.2 |
| B | 4 | 171 | 74924 | 487.83 | 708 | 682 | 152.2 |
| B | 7 | 252 | 67374 | 438.22 | 708 | 682 | 152.2 |
| C | 13 | 3 | 353487 | 1906.61 | 678 | 671 | 185.0 |
| C | 9 | 38 | 202209 | 1089.1 | 678 | 671 | 185.0 |
| C | 6 | 223 | 100176 | 537.72 | 678 | 671 | 185.0 |
| D | 2 | 249 | 1181945 | 6514.77 | 636 | 604 | 181.3 |
| D | 2 | 31 | 679710 | 3745.08 | 636 | 604 | 181.3 |
| D | 8 | 129 | 518693 | 2857.12 | 636 | 604 | 181.3 |
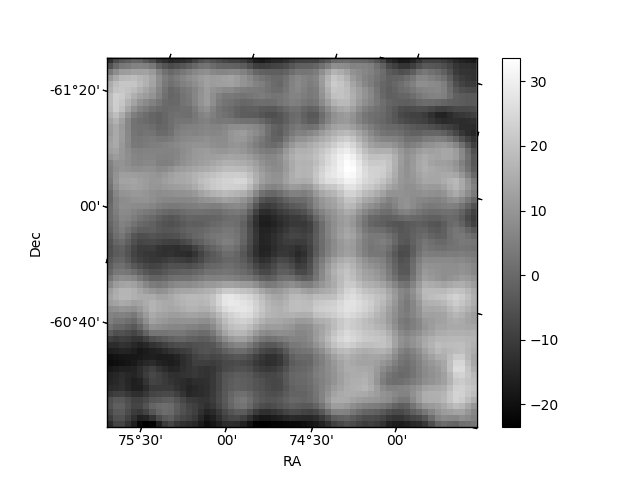
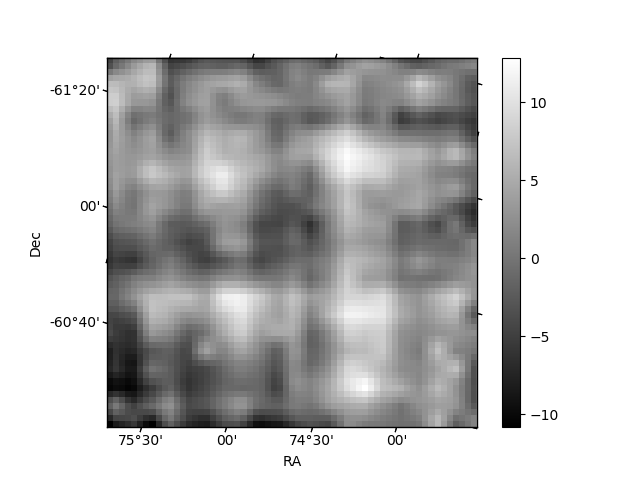
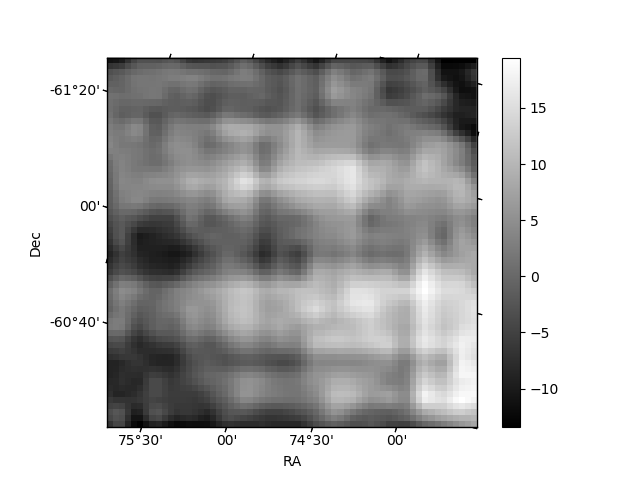
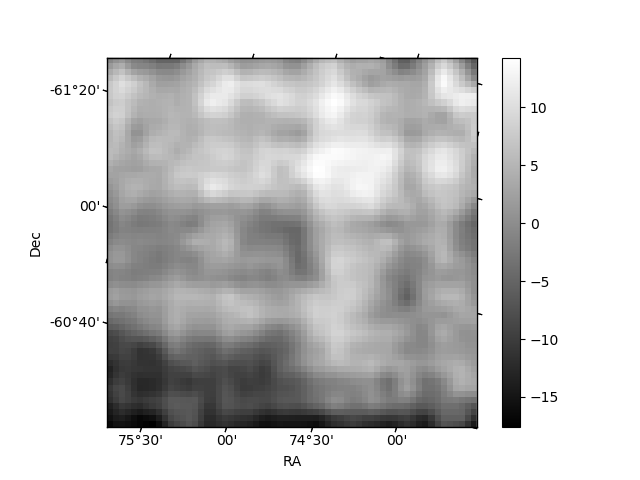
Histogram calculated using DETX and DETY for each event in the final _common_clean file
| Quadrant A | 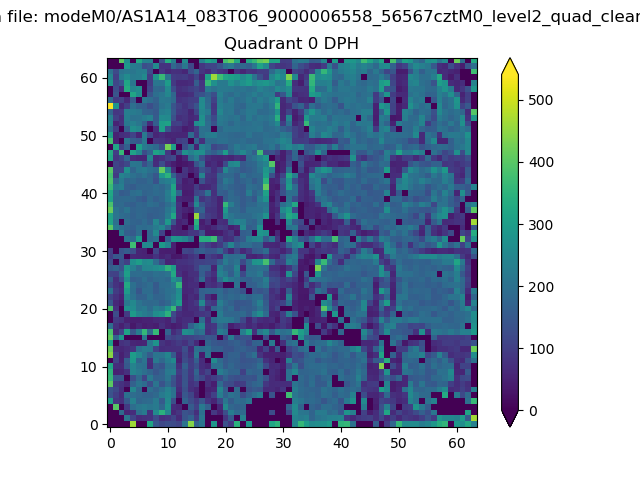 |
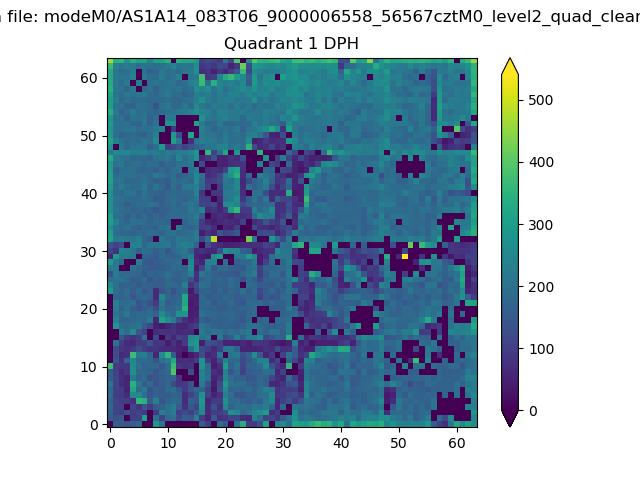 |
Quadrant B |
|---|---|---|---|
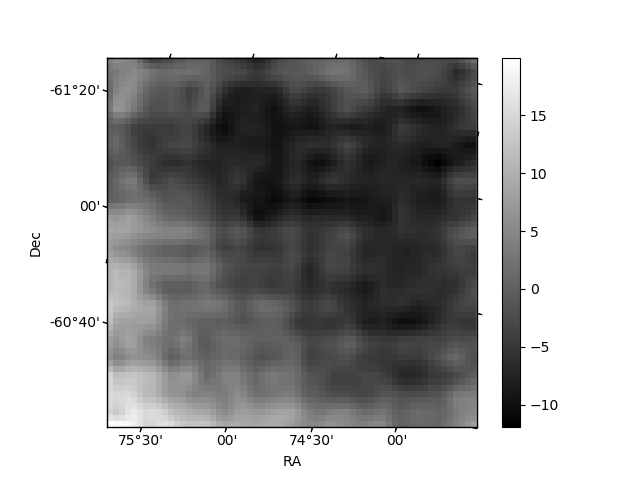
| Quadrant D | 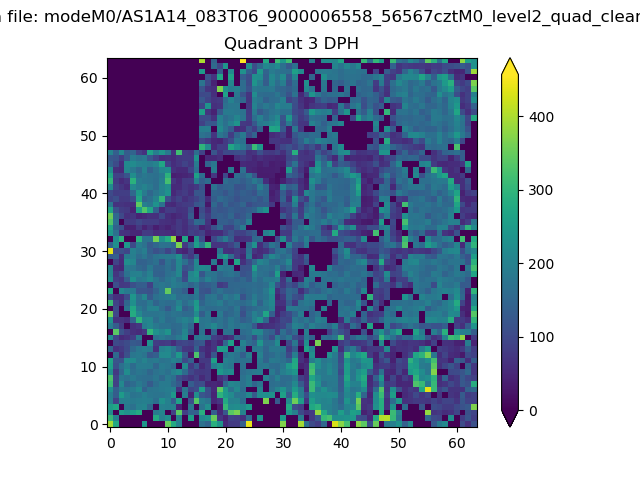 |
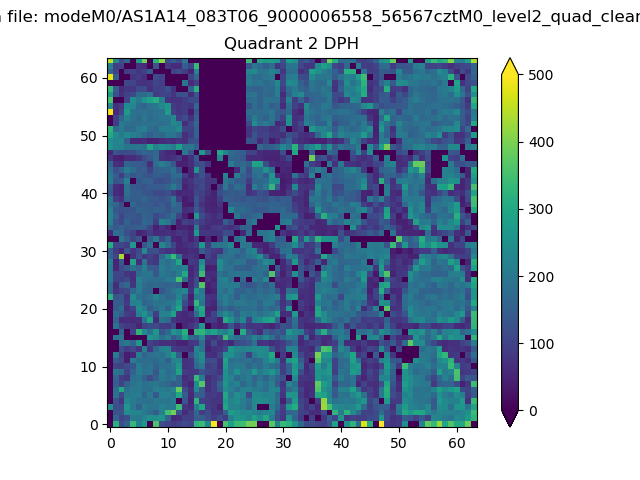 |
Quadrant C |
| Plot type | Count rate plots | Images |
|---|---|---|
| Comparison with Poisson distribution Blue bars denote a histogram of data divided into 1 sec bins. Red curve is a Poisson curve with rate = median count rate of data. |
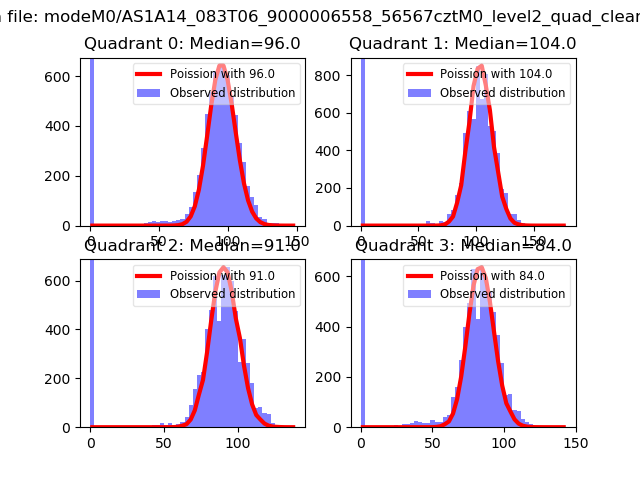 |
 |
| Quadrant-wise count rates Data is divided into 100 sec bins |
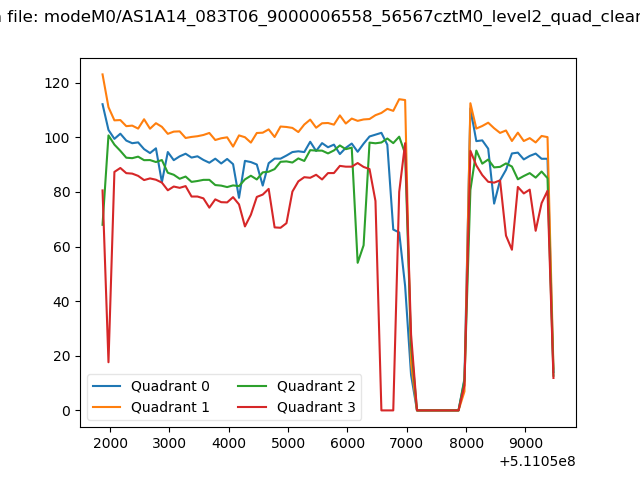 |
|
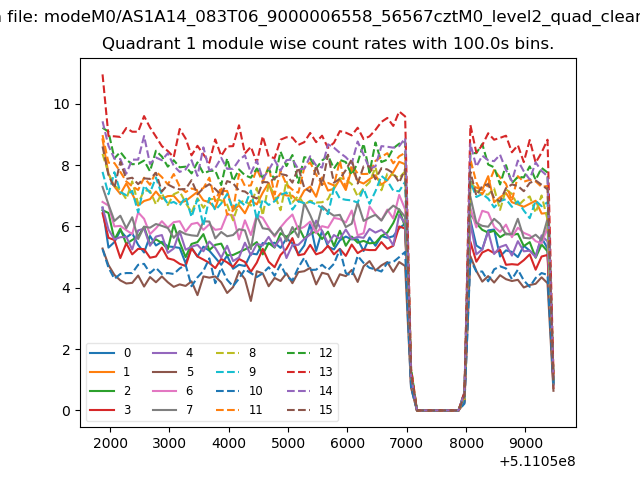
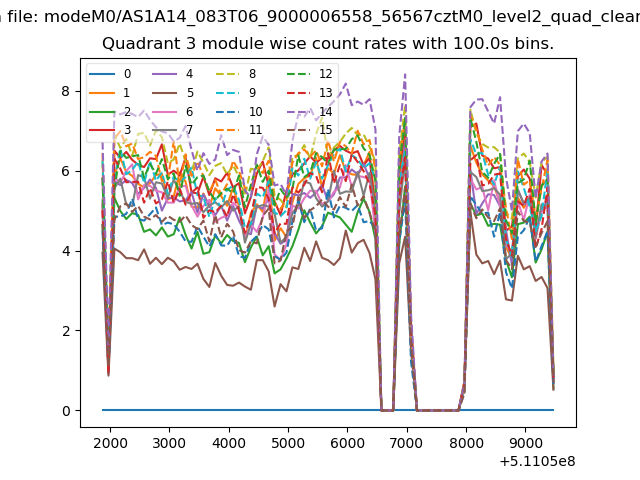
| Module-wise count rates for Quadrant A Data is divided into 100 sec bins |
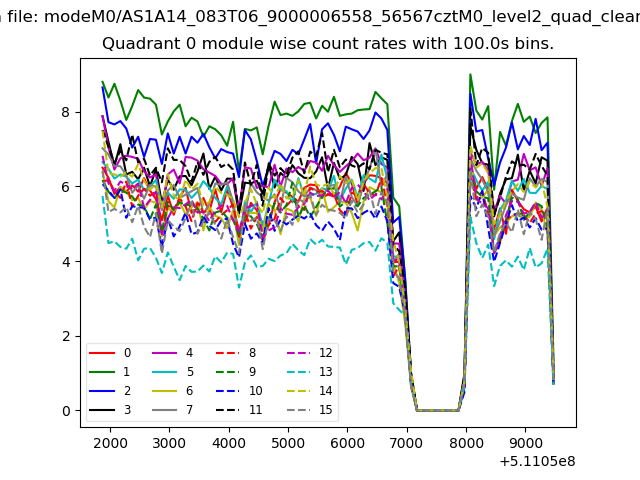 |
 |
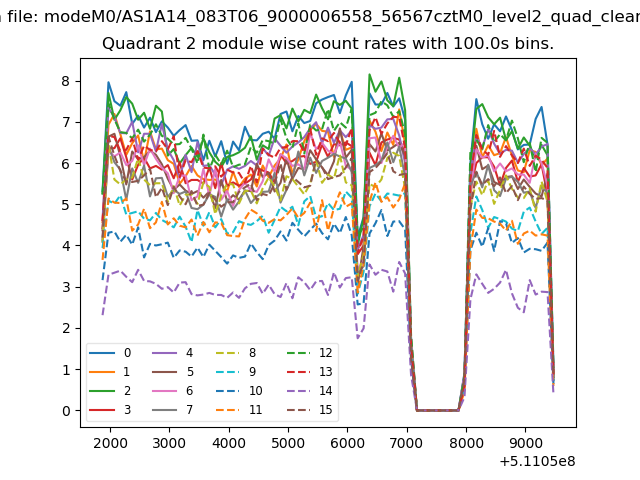
| Module-wise count rates for Quadrant B Data is divided into 100 sec bins |
 |
 |
| Module-wise count rates for Quadrant C Data is divided into 100 sec bins |
 |
 |
| Module-wise count rates for Quadrant D Data is divided into 100 sec bins |
 |
 |
| Parameter | Plot |
|---|---|
| CZT HV Monitor | 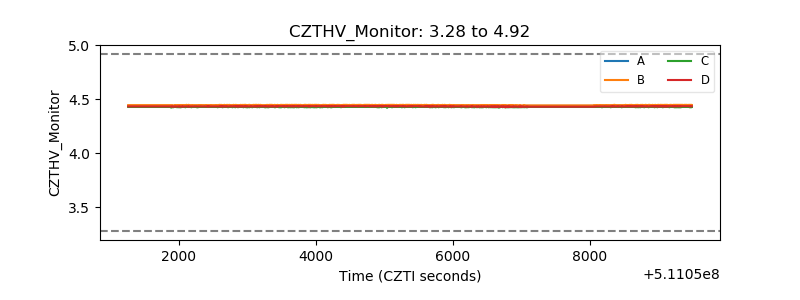 |
| D_VDD | 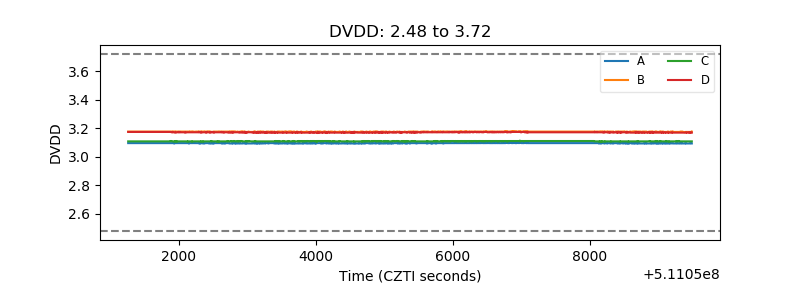 |
| Temperature 1 | 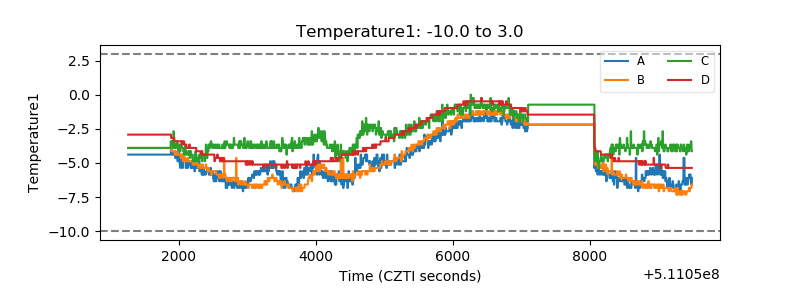 |
| Veto HV Monitor | 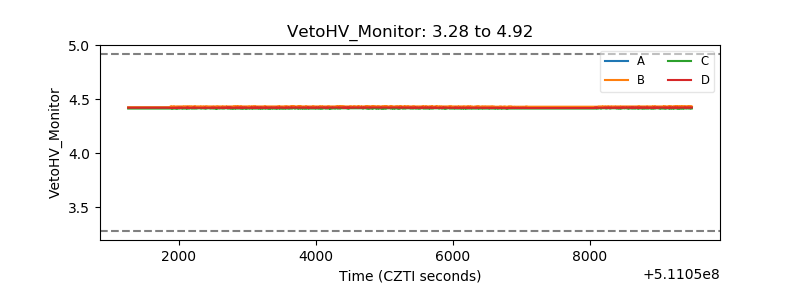 |
| Veto LLD | 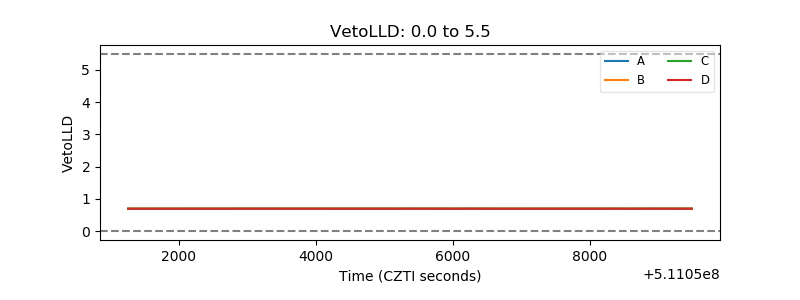 |
| Alpha Counter | 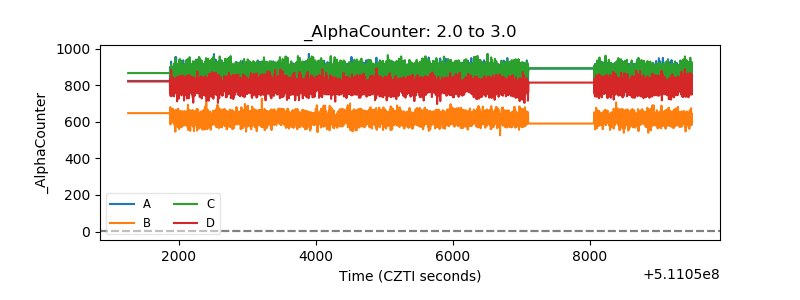 |
| _CPM_Rate | 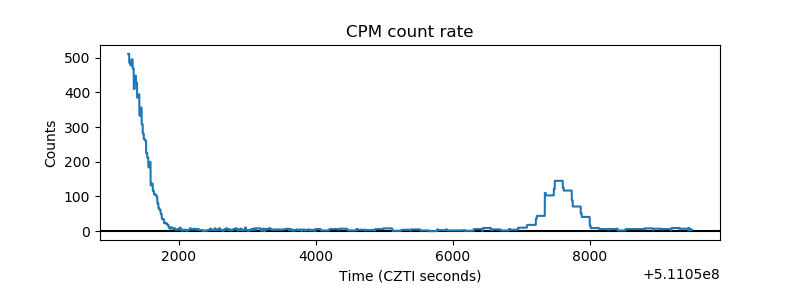 |
| CZT Counter | 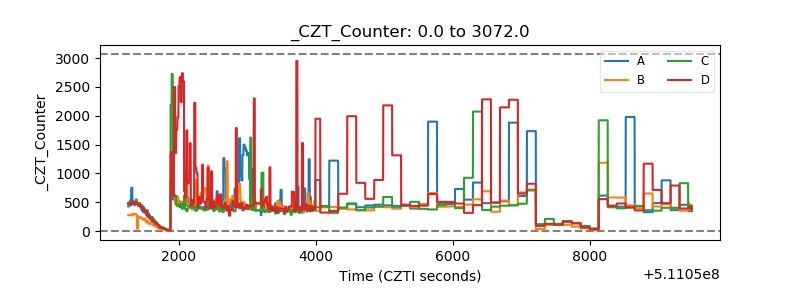 |
| +2.5 Volts monitor |  |
| +5 Volts monitor |  |
| _ROLL_ROT | 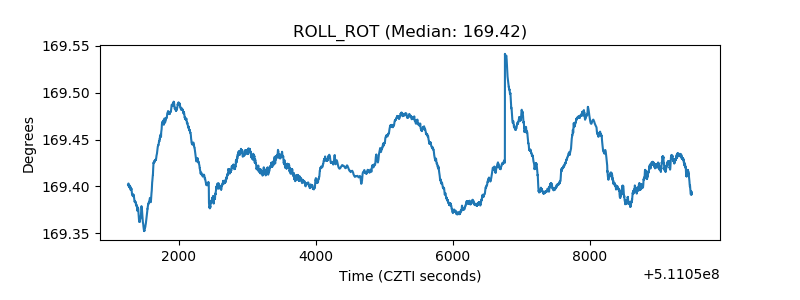 |
| _Roll_DEC | 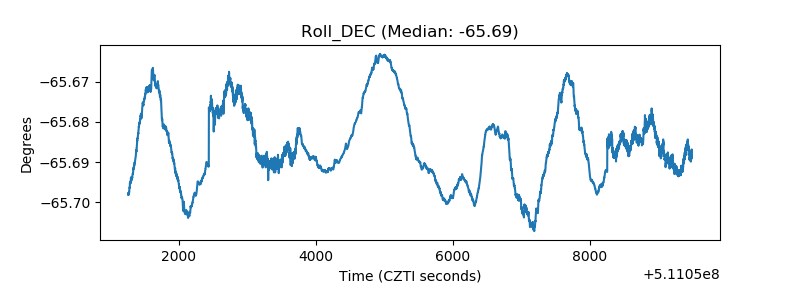 |
| _Roll_RA | 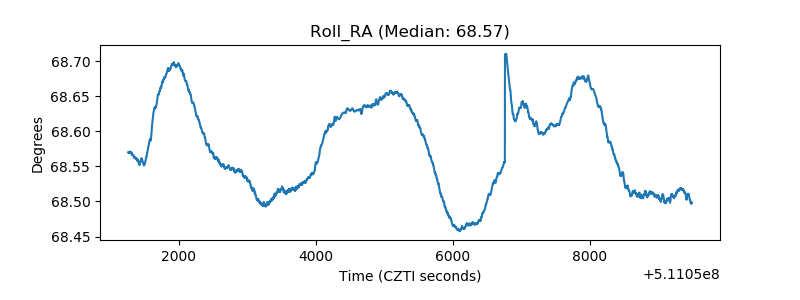 |
| Veto Counter | 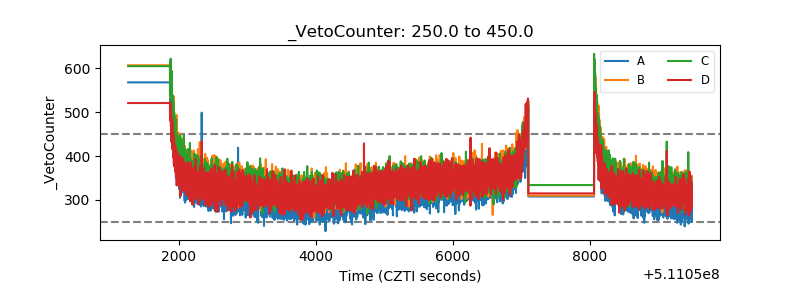 |