| Param | Original file | Final file |
|---|---|---|
| Filename | modeM0/AS1A14_083T06_9000006558_56568cztM0_level2.fits | modeM0/AS1A14_083T06_9000006558_56568cztM0_level2_quad_clean.evt |
| Size (bytes) | 529,914,240 | 108,466,560 |
| Size | 505.4 MB | 103.4 MB |
| Events in quadrant A | 5,427,144 | 680,726 |
| Events in quadrant B | 3,880,769 | 786,201 |
| Events in quadrant C | 3,685,024 | 685,231 |
| Events in quadrant D | 6,023,890 | 596,140 |
| Mode SS | |||
|---|---|---|---|
| Quadrant | BADHDUFLAG | Total packets | Discarded packets |
| A | 0 | 158 | 0 |
| B | 0 | 158 | 0 |
| C | 0 | 158 | 0 |
| D | 0 | 158 | 0 |
| Mode M9 | |||
|---|---|---|---|
| Quadrant | BADHDUFLAG | Total packets | Discarded packets |
| A | 0 | 16 | 0 |
| B | 0 | 16 | 0 |
| C | 0 | 16 | 0 |
| D | 0 | 16 | 0 |
| Mode M0 | |||
|---|---|---|---|
| Quadrant | BADHDUFLAG | Total packets | Discarded packets |
| A | 0 | 21689 | 1 |
| B | 0 | 16995 | 1 |
| C | 0 | 16773 | 1 |
| D | 0 | 23428 | 1 |
| Quadrant | Total seconds | Saturated seconds | Saturation percentage |
|---|---|---|---|
| A | 7705 | 650 | 8.436080% |
| B | 7706 | 139 | 1.803789% |
| C | 7706 | 103 | 1.336621% |
| D | 7706 | 715 | 9.278484% |
Noise dominated data is calculated using 1-second bins in cleaned event files. If a bin has >2000 counts, and if more than 50% of those come from <1% of pixels, then it is considered to be noise-dominated and hence unusable.
| Quadrant | # 1 sec bins | Bins with >0 counts | Bins with >2000 counts | High rate bins dominated by noise | Noise dominated (total time) | Noise dominated (detector-on time) | Marked lightcurve |
|---|---|---|---|---|---|---|---|
| A | 9255 | 7707 | 463 | 463 | 5.00% | 6.01% | 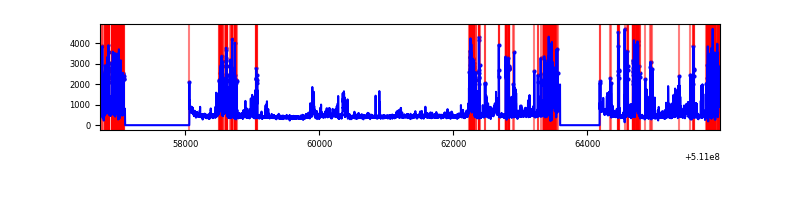 |
| B | 9256 | 7708 | 26 | 26 | 0.28% | 0.34% | 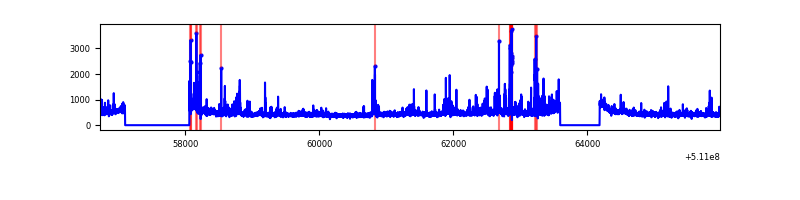 |
| C | 9256 | 7708 | 41 | 41 | 0.44% | 0.53% | 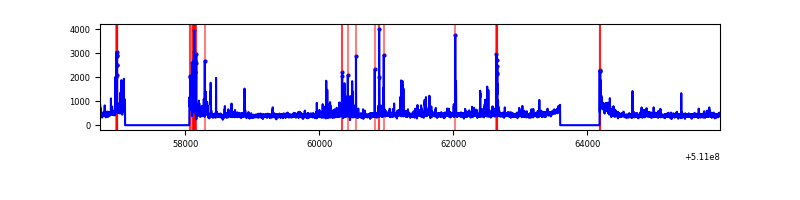 |
| D | 9256 | 7708 | 631 | 631 | 6.82% | 8.19% | 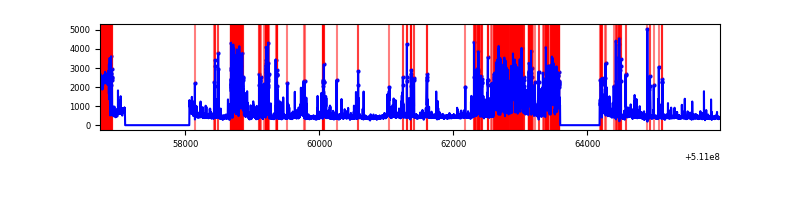 |
Top three noisy pixels from each quadrant. If the there are fewer than three noisy pixels in the level2.evt file, extra rows are filled as -1
| Pixel properties | Quadrant properties | ||||||
|---|---|---|---|---|---|---|---|
| Quadrant | DetID | PixID | Counts | Sigma | Mean | Median | Sigma |
| A | 0 | 8 | 710510 | 3579.36 | 799 | 779 | 198.3 |
| A | 15 | 33 | 517634 | 2606.64 | 799 | 779 | 198.3 |
| A | 4 | 249 | 374535 | 1884.95 | 799 | 779 | 198.3 |
| B | 4 | 21 | 155759 | 876.14 | 826 | 795 | 176.9 |
| B | 10 | 247 | 120686 | 677.84 | 826 | 795 | 176.9 |
| B | 0 | 63 | 72802 | 407.11 | 826 | 795 | 176.9 |
| C | 9 | 38 | 191635 | 879.25 | 802 | 792 | 217.1 |
| C | 6 | 223 | 125947 | 576.61 | 802 | 792 | 217.1 |
| C | 13 | 3 | 85974 | 392.45 | 802 | 792 | 217.1 |
| D | 2 | 249 | 1596110 | 7378.54 | 763 | 725 | 216.2 |
| D | 8 | 129 | 434939 | 2008.21 | 763 | 725 | 216.2 |
| D | 13 | 153 | 210247 | 969.02 | 763 | 725 | 216.2 |
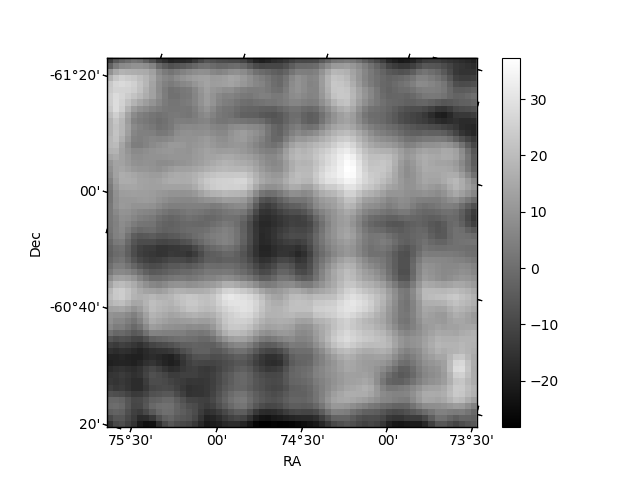
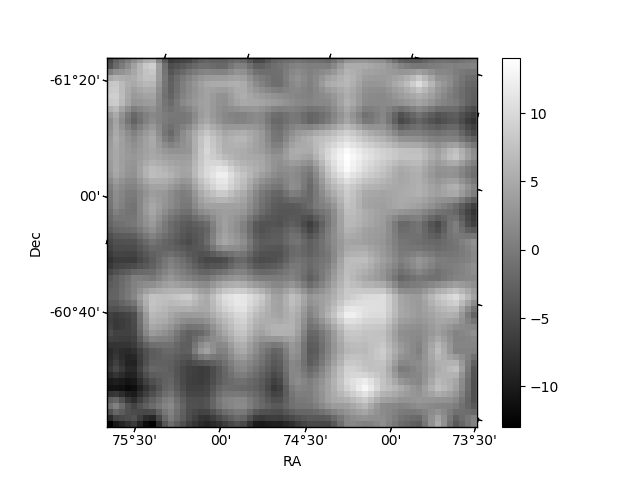
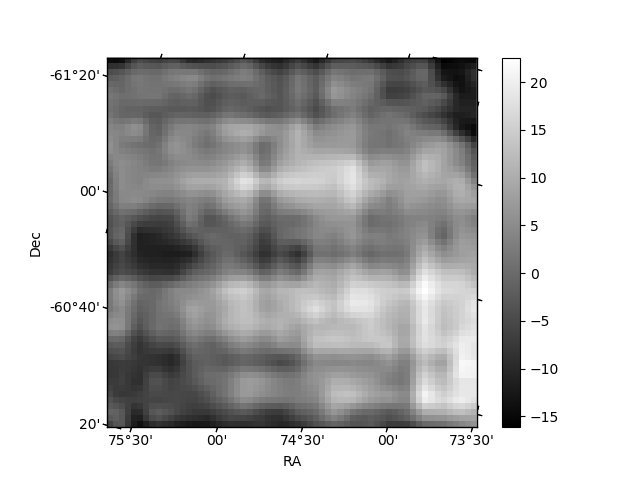
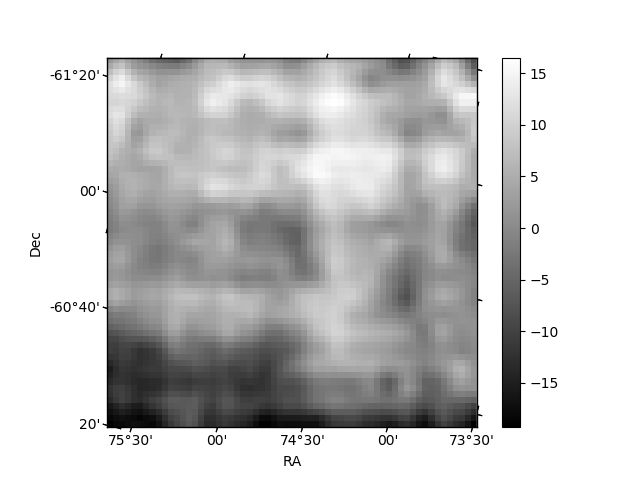
Histogram calculated using DETX and DETY for each event in the final _common_clean file
| Quadrant A | 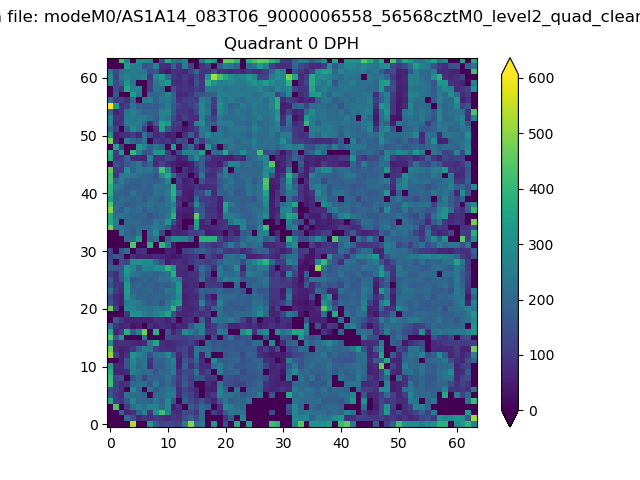 |
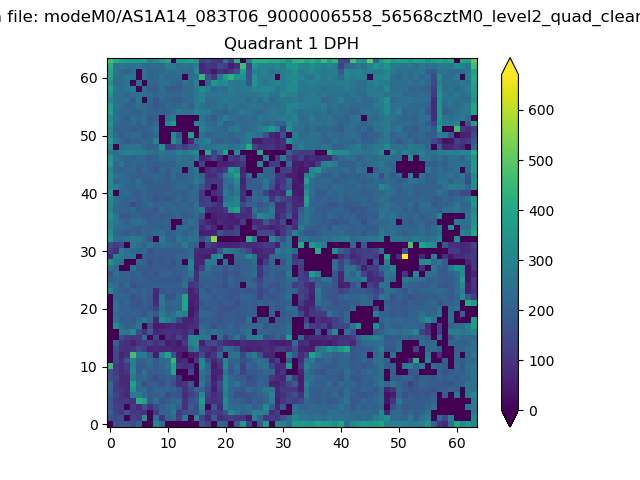 |
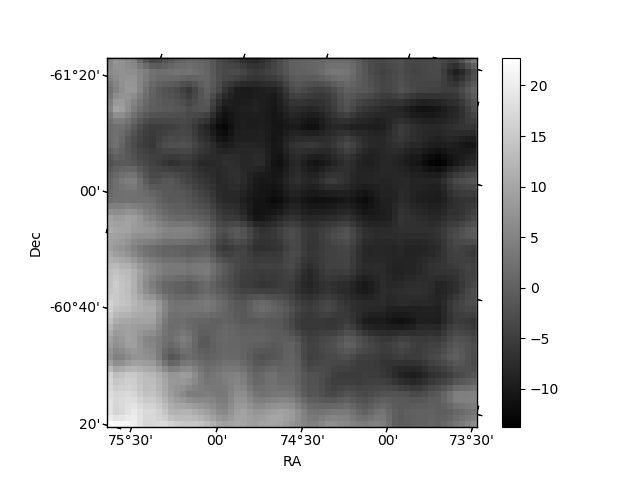
Quadrant B |
|---|---|---|---|
| Quadrant D | 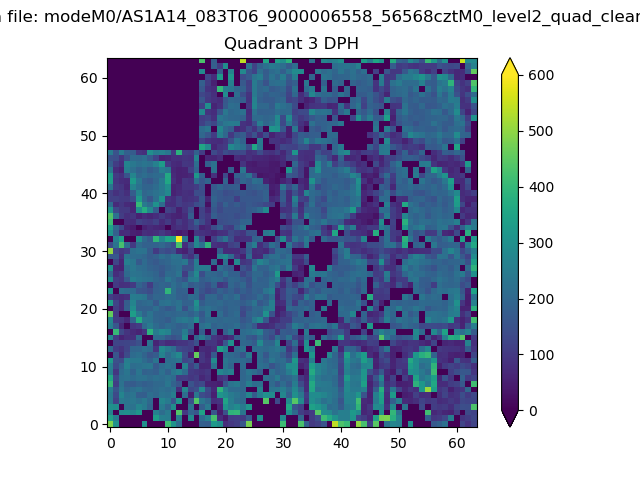 |
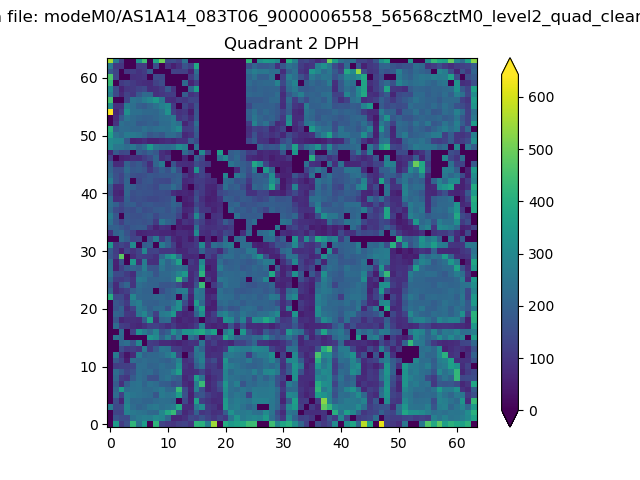 |
Quadrant C |
| Plot type | Count rate plots | Images |
|---|---|---|
| Comparison with Poisson distribution Blue bars denote a histogram of data divided into 1 sec bins. Red curve is a Poisson curve with rate = median count rate of data. |
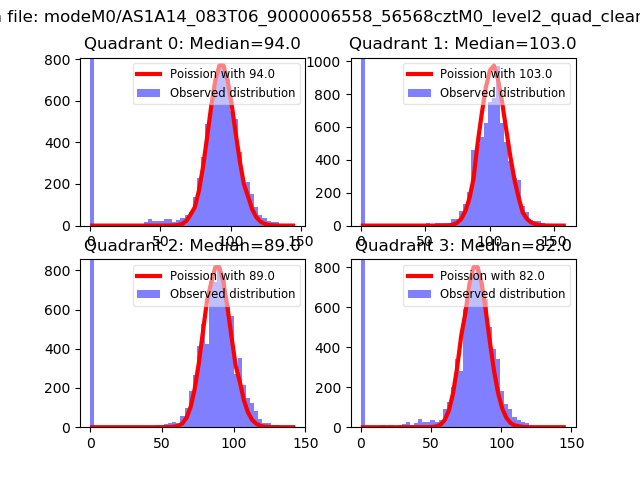 |
 |
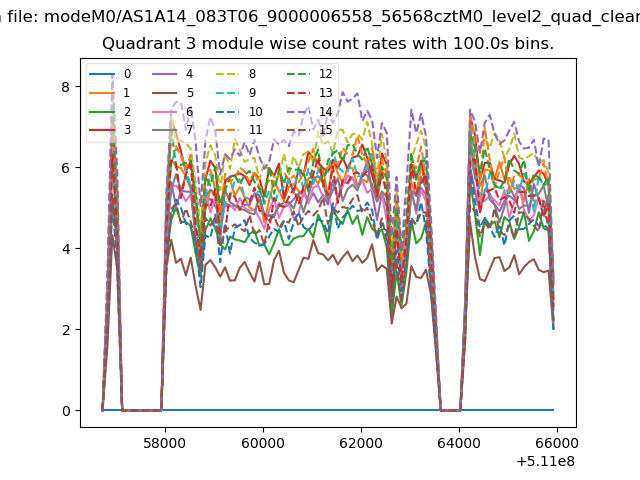
| Quadrant-wise count rates Data is divided into 100 sec bins |
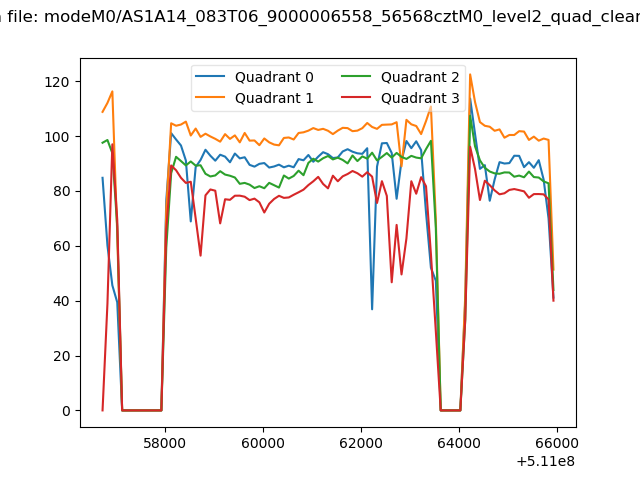 |
|
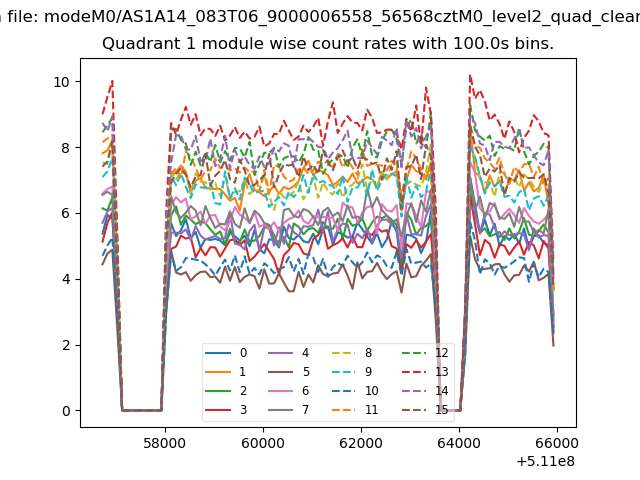
| Module-wise count rates for Quadrant A Data is divided into 100 sec bins |
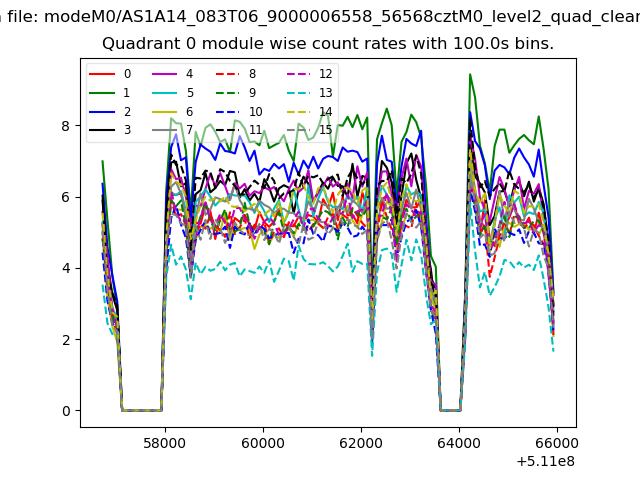 |
 |
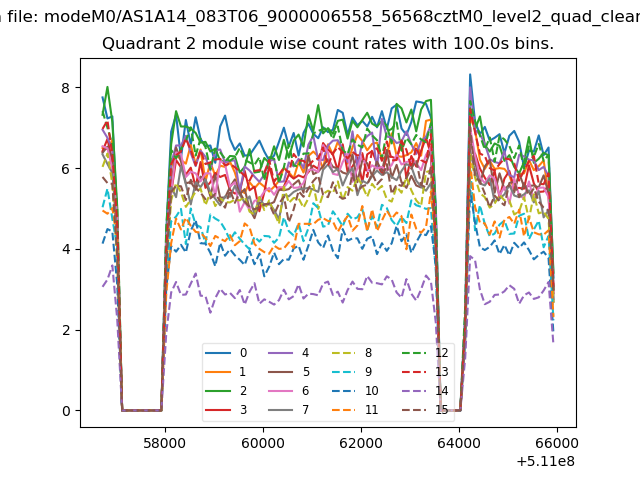
| Module-wise count rates for Quadrant B Data is divided into 100 sec bins |
 |
 |
| Module-wise count rates for Quadrant C Data is divided into 100 sec bins |
 |
 |
| Module-wise count rates for Quadrant D Data is divided into 100 sec bins |
 |
 |
| Parameter | Plot |
|---|---|
| CZT HV Monitor | 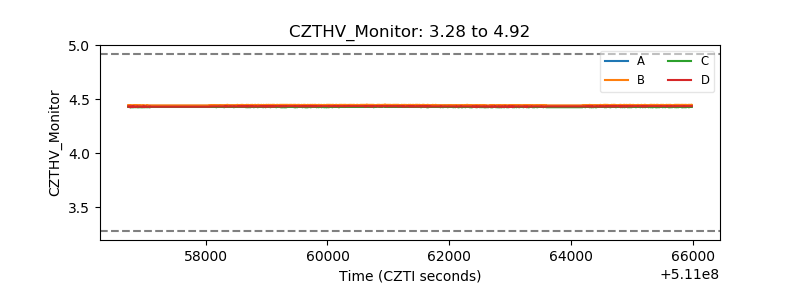 |
| D_VDD | 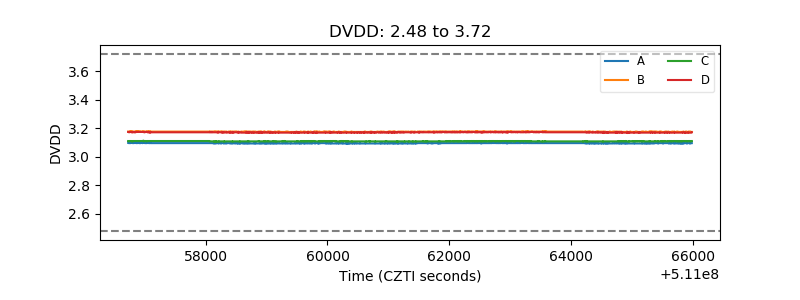 |
| Temperature 1 | 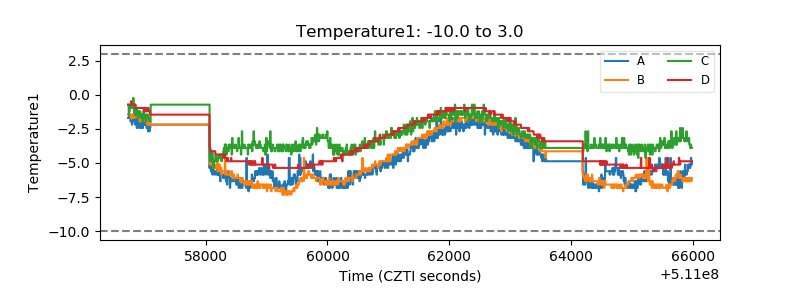 |
| Veto HV Monitor | 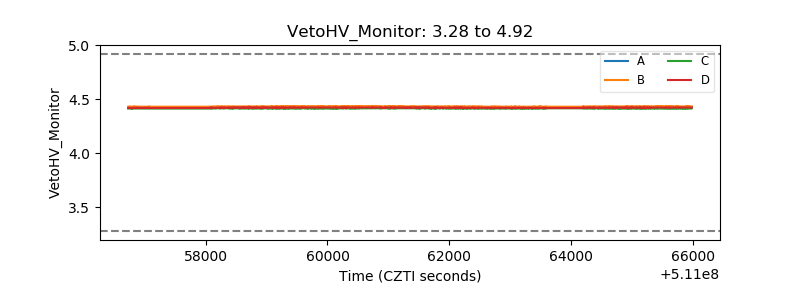 |
| Veto LLD | 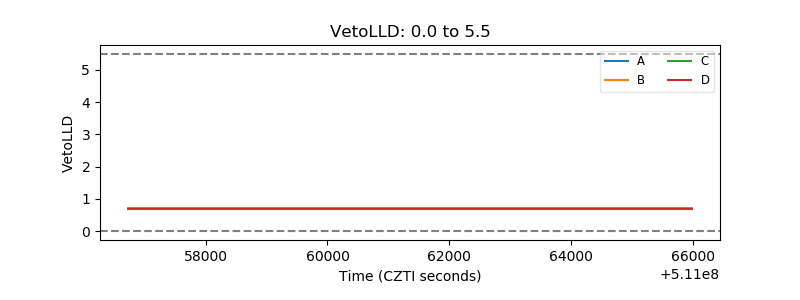 |
| Alpha Counter | 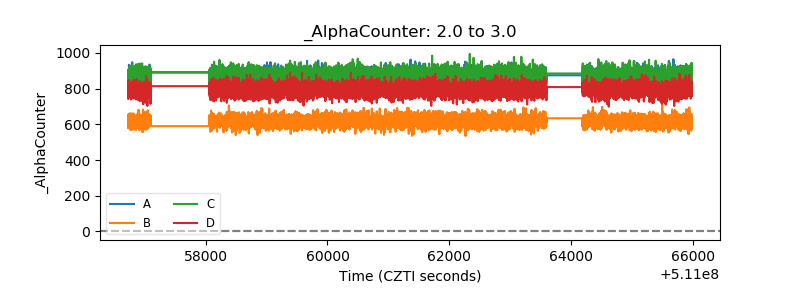 |
| _CPM_Rate |  |
| CZT Counter | 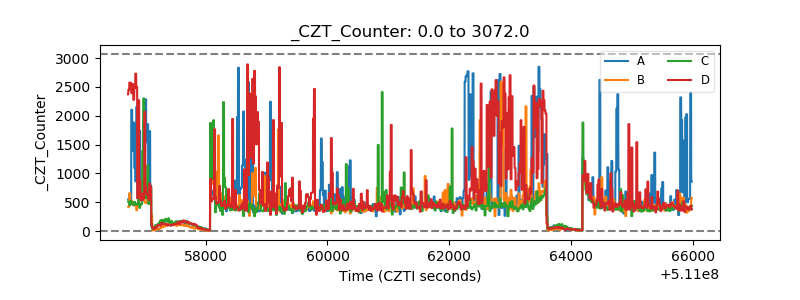 |
| +2.5 Volts monitor |  |
| +5 Volts monitor |  |
| _ROLL_ROT | 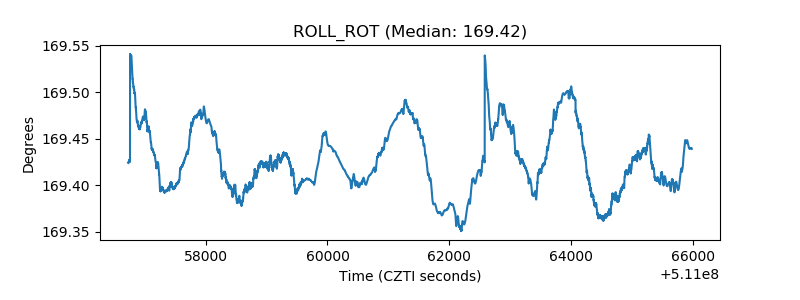 |
| _Roll_DEC | 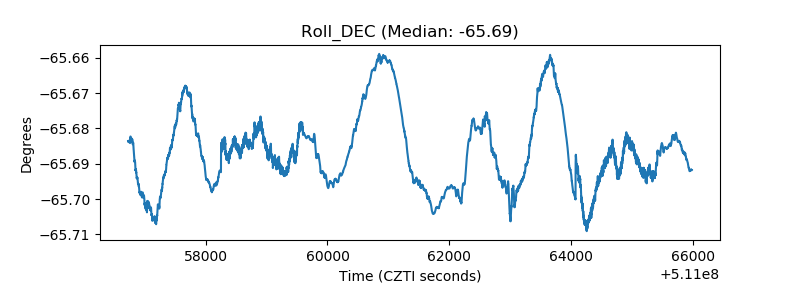 |
| _Roll_RA | 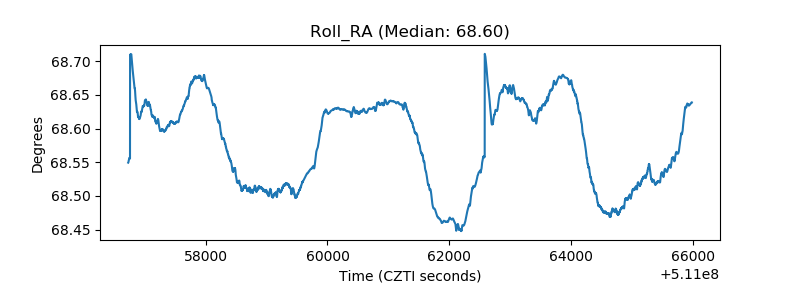 |
| Veto Counter | 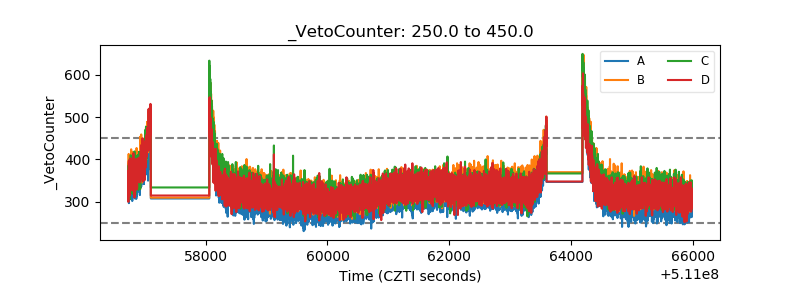 |