| Param | Original file | Final file |
|---|---|---|
| Filename | modeM0/AS1A14_083T06_9000006558_56569cztM0_level2.fits | modeM0/AS1A14_083T06_9000006558_56569cztM0_level2_quad_clean.evt |
| Size (bytes) | 568,693,440 | 120,317,760 |
| Size | 542.3 MB | 114.7 MB |
| Events in quadrant A | 6,857,912 | 736,438 |
| Events in quadrant B | 4,174,268 | 868,832 |
| Events in quadrant C | 3,986,441 | 757,535 |
| Events in quadrant D | 5,372,090 | 689,435 |
| Mode SS | |||
|---|---|---|---|
| Quadrant | BADHDUFLAG | Total packets | Discarded packets |
| A | 0 | 172 | 0 |
| B | 0 | 172 | 0 |
| C | 0 | 172 | 0 |
| D | 0 | 172 | 0 |
| Mode M9 | |||
|---|---|---|---|
| Quadrant | BADHDUFLAG | Total packets | Discarded packets |
| A | 0 | 6 | 0 |
| B | 0 | 6 | 0 |
| C | 0 | 6 | 0 |
| D | 0 | 6 | 0 |
| Mode M0 | |||
|---|---|---|---|
| Quadrant | BADHDUFLAG | Total packets | Discarded packets |
| A | 0 | 26325 | 1 |
| B | 0 | 18525 | 1 |
| C | 0 | 18400 | 1 |
| D | 0 | 22100 | 1 |
| Quadrant | Total seconds | Saturated seconds | Saturation percentage |
|---|---|---|---|
| A | 8506 | 866 | 10.181049% |
| B | 8506 | 94 | 1.105102% |
| C | 8506 | 55 | 0.646602% |
| D | 8507 | 321 | 3.773363% |
Noise dominated data is calculated using 1-second bins in cleaned event files. If a bin has >2000 counts, and if more than 50% of those come from <1% of pixels, then it is considered to be noise-dominated and hence unusable.
| Quadrant | # 1 sec bins | Bins with >0 counts | Bins with >2000 counts | High rate bins dominated by noise | Noise dominated (total time) | Noise dominated (detector-on time) | Marked lightcurve |
|---|---|---|---|---|---|---|---|
| A | 9096 | 8507 | 668 | 668 | 7.34% | 7.85% | 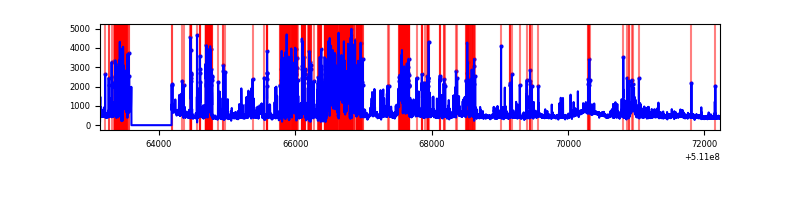 |
| B | 9096 | 8507 | 16 | 16 | 0.18% | 0.19% | 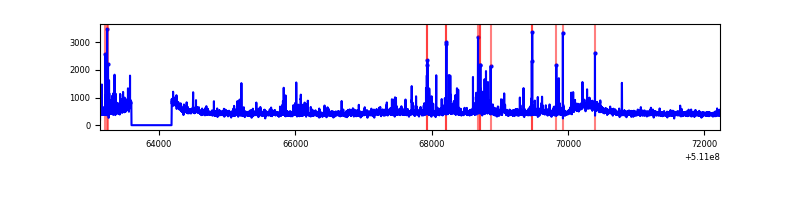 |
| C | 9096 | 8507 | 25 | 25 | 0.27% | 0.29% | 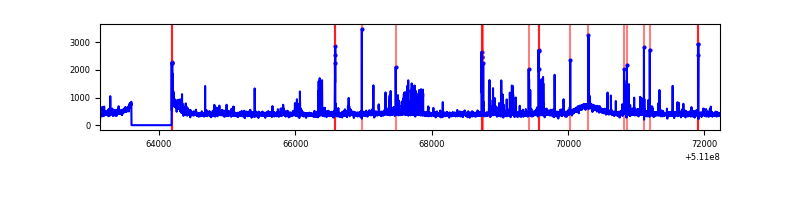 |
| D | 9097 | 8508 | 276 | 276 | 3.03% | 3.24% | 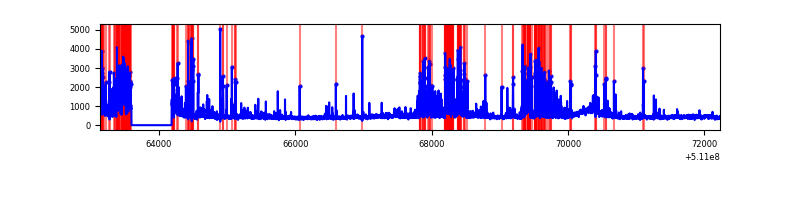 |
Top three noisy pixels from each quadrant. If the there are fewer than three noisy pixels in the level2.evt file, extra rows are filled as -1
| Pixel properties | Quadrant properties | ||||||
|---|---|---|---|---|---|---|---|
| Quadrant | DetID | PixID | Counts | Sigma | Mean | Median | Sigma |
| A | 4 | 249 | 1115329 | 5060.84 | 889 | 866 | 220.2 |
| A | 4 | 95 | 678403 | 3076.73 | 889 | 866 | 220.2 |
| A | 15 | 33 | 461749 | 2092.9 | 889 | 866 | 220.2 |
| B | 4 | 21 | 201639 | 1016.99 | 924 | 889 | 197.4 |
| B | 10 | 247 | 70609 | 353.2 | 924 | 889 | 197.4 |
| B | 4 | 171 | 42974 | 213.2 | 924 | 889 | 197.4 |
| C | 13 | 3 | 125286 | 512.81 | 901 | 890 | 242.6 |
| C | 12 | 252 | 87808 | 358.31 | 901 | 890 | 242.6 |
| C | 9 | 38 | 67306 | 273.79 | 901 | 890 | 242.6 |
| D | 2 | 249 | 706046 | 2864.62 | 877 | 836 | 246.2 |
| D | 6 | 239 | 528754 | 2144.45 | 877 | 836 | 246.2 |
| D | 2 | 31 | 101708 | 409.75 | 877 | 836 | 246.2 |
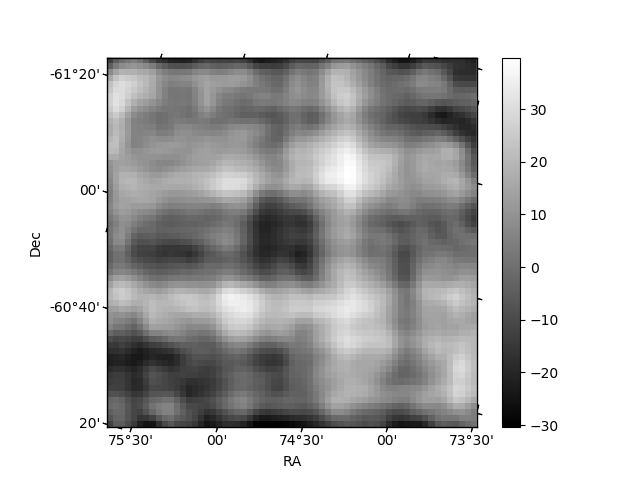
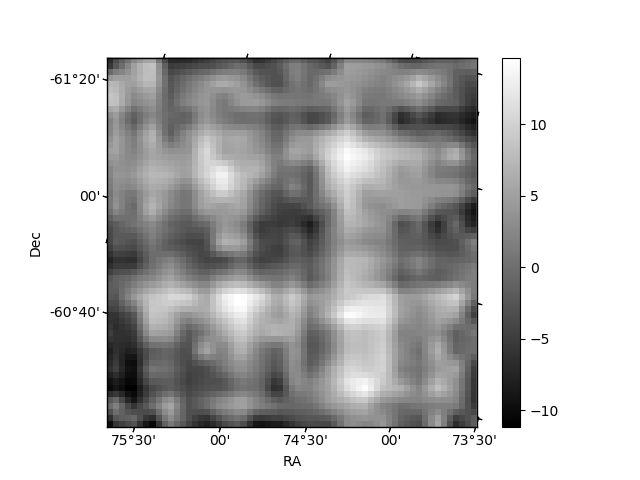
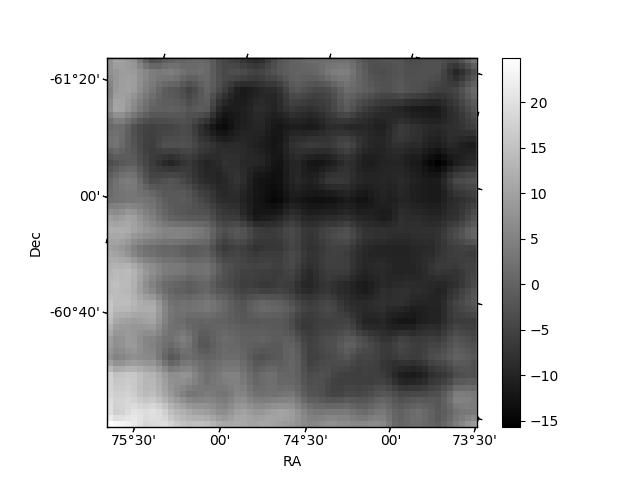
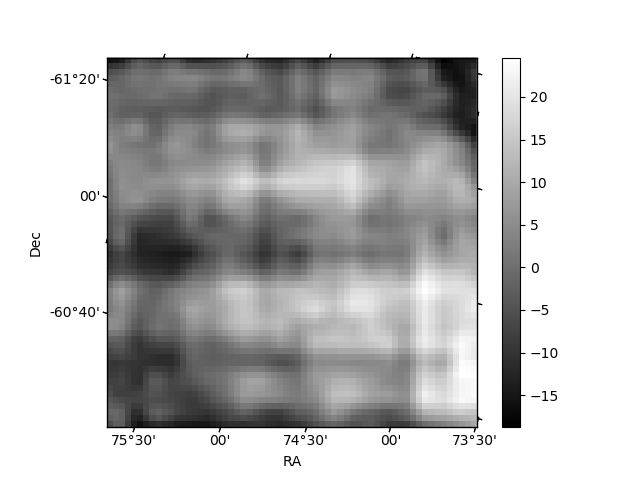
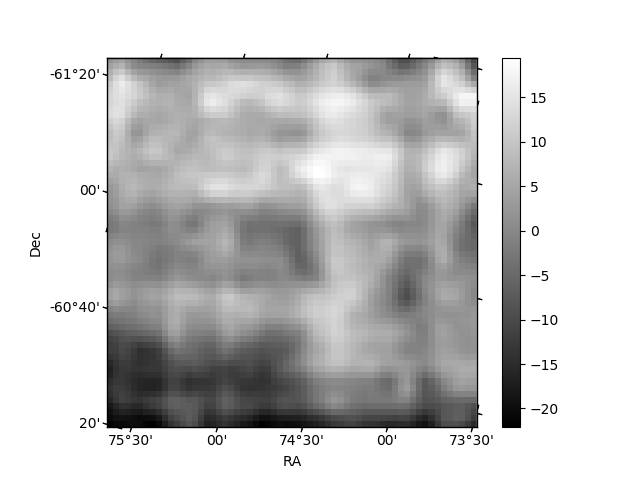
Histogram calculated using DETX and DETY for each event in the final _common_clean file
| Quadrant A | 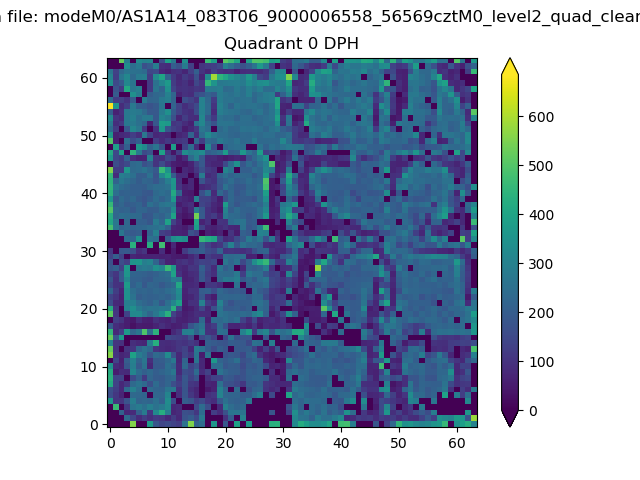 |
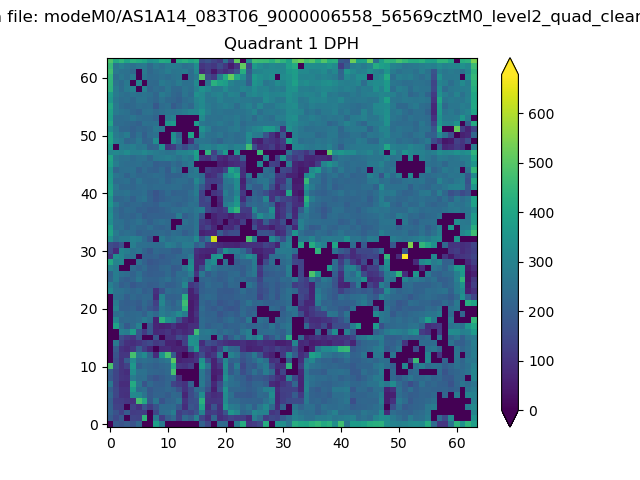 |
Quadrant B |
|---|---|---|---|
| Quadrant D | 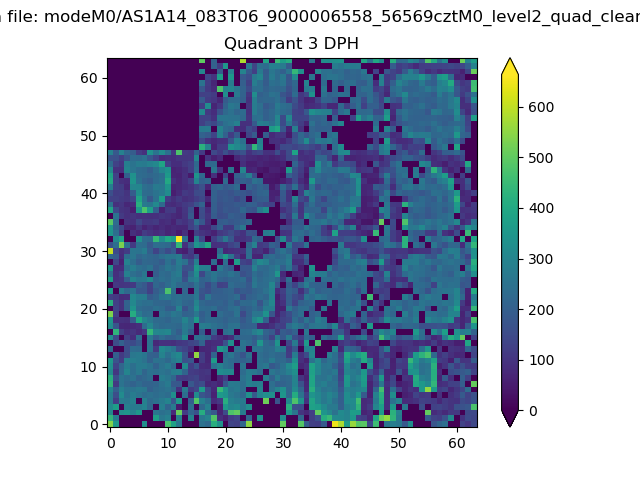 |
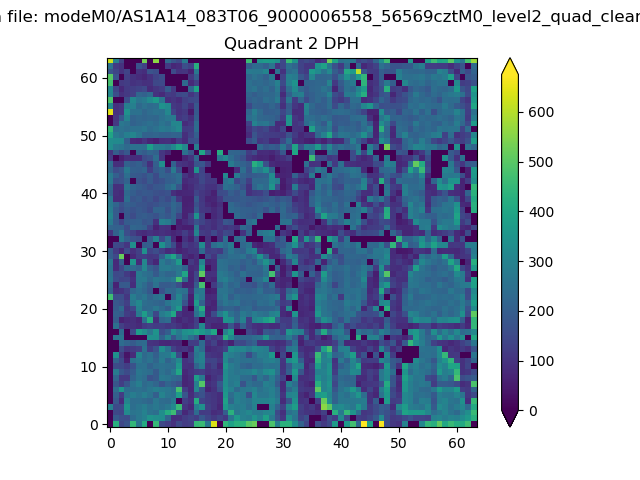 |
Quadrant C |
| Plot type | Count rate plots | Images |
|---|---|---|
| Comparison with Poisson distribution Blue bars denote a histogram of data divided into 1 sec bins. Red curve is a Poisson curve with rate = median count rate of data. |
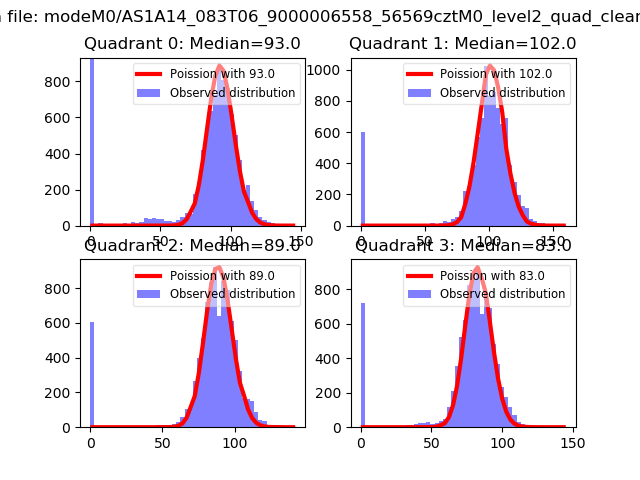 |
 |
| Quadrant-wise count rates Data is divided into 100 sec bins |
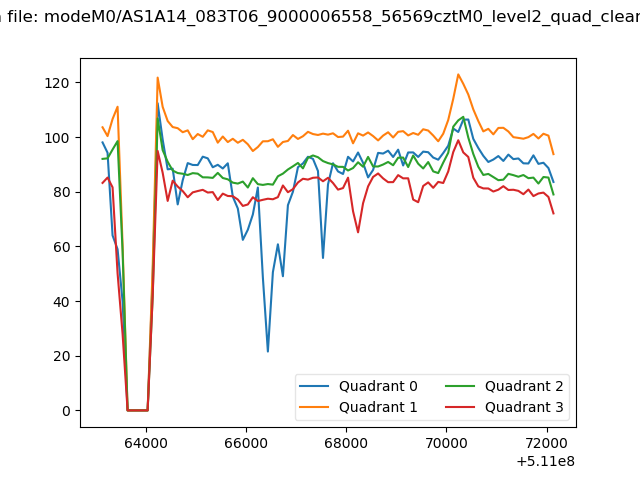 |
|
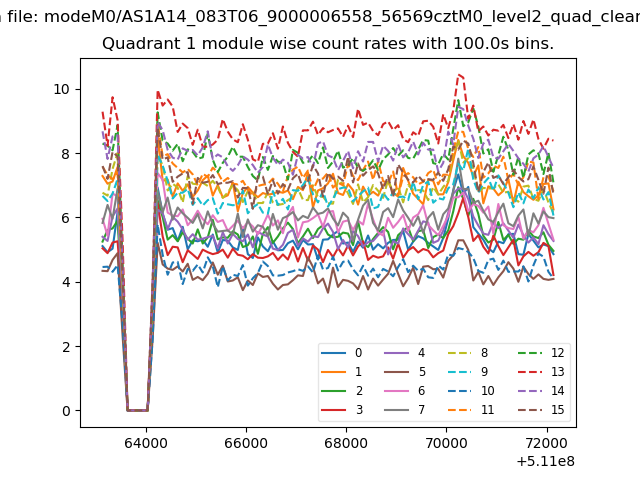
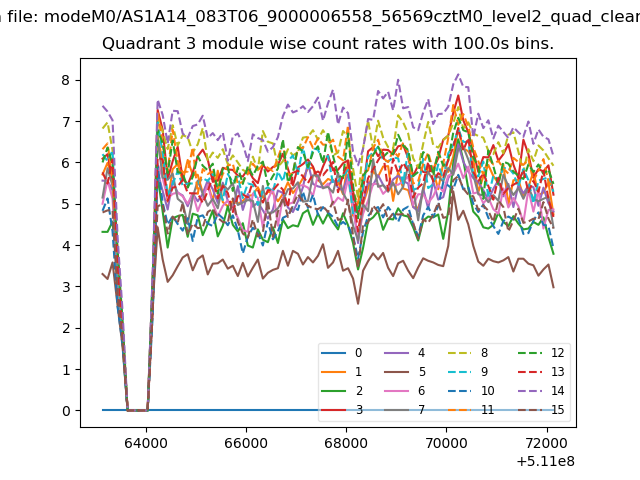
| Module-wise count rates for Quadrant A Data is divided into 100 sec bins |
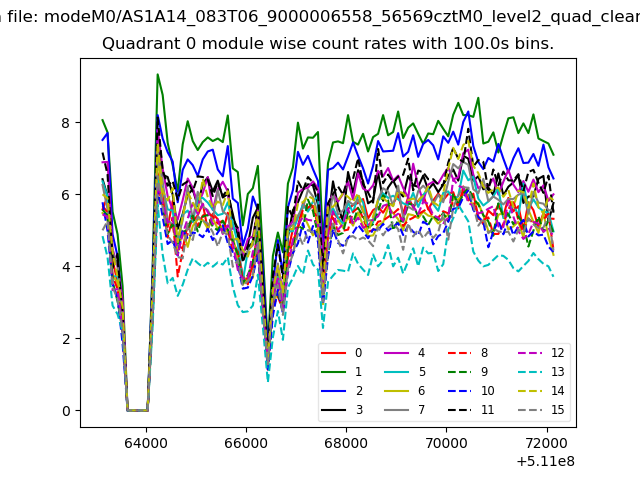 |
 |
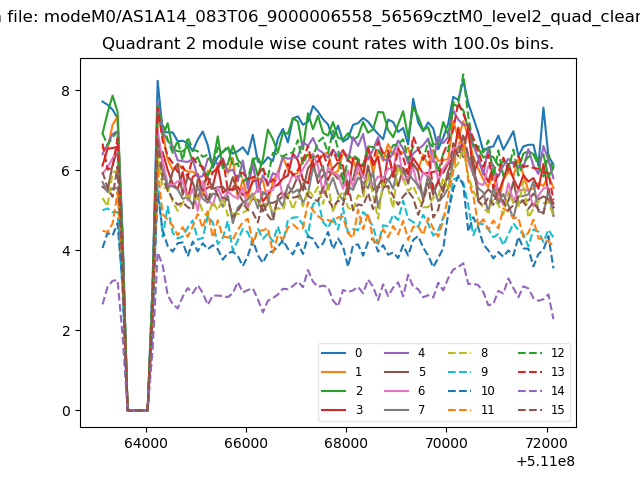
| Module-wise count rates for Quadrant B Data is divided into 100 sec bins |
 |
 |
| Module-wise count rates for Quadrant C Data is divided into 100 sec bins |
 |
 |
| Module-wise count rates for Quadrant D Data is divided into 100 sec bins |
 |
 |
| Parameter | Plot |
|---|---|
| CZT HV Monitor | 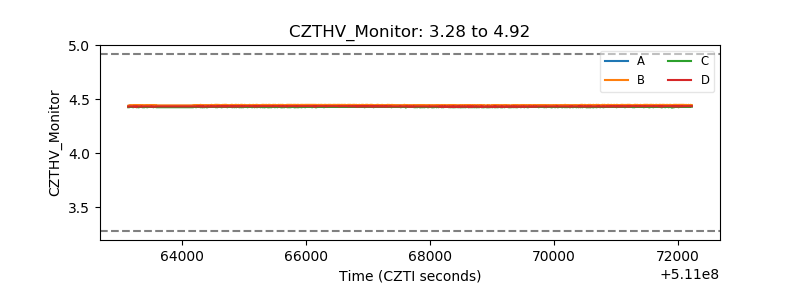 |
| D_VDD | 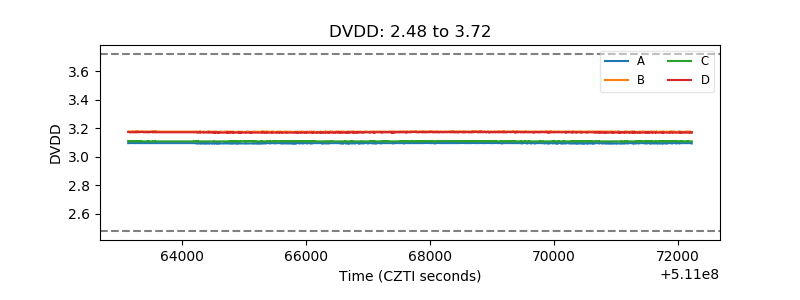 |
| Temperature 1 | 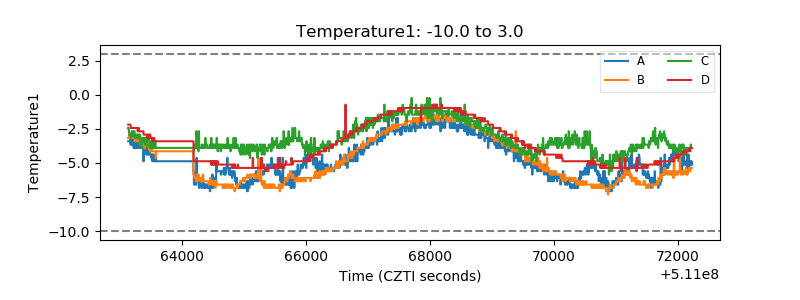 |
| Veto HV Monitor | 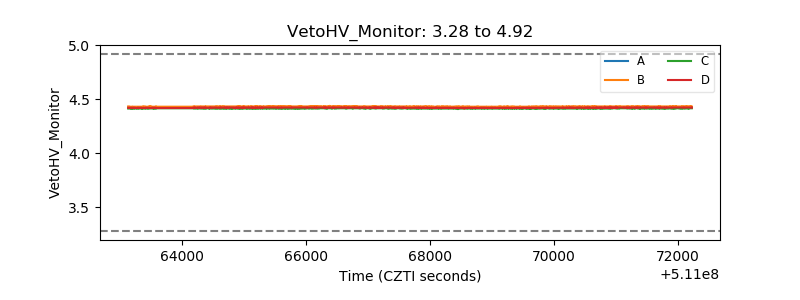 |
| Veto LLD | 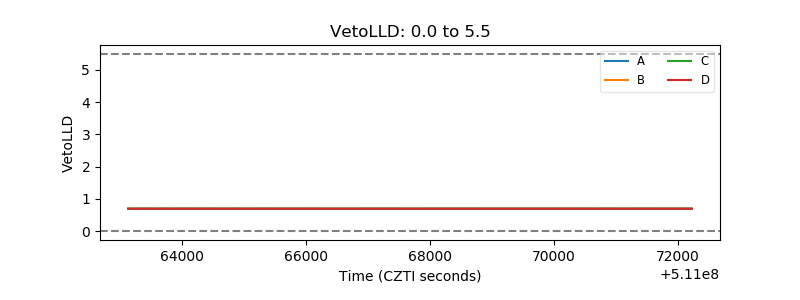 |
| Alpha Counter | 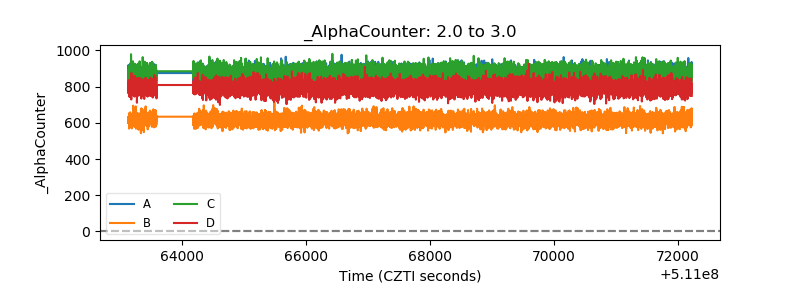 |
| _CPM_Rate | 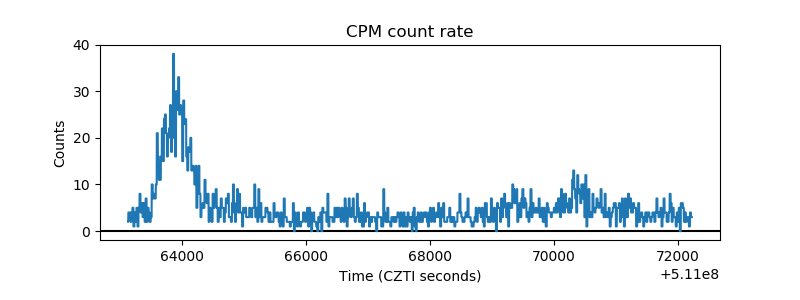 |
| CZT Counter | 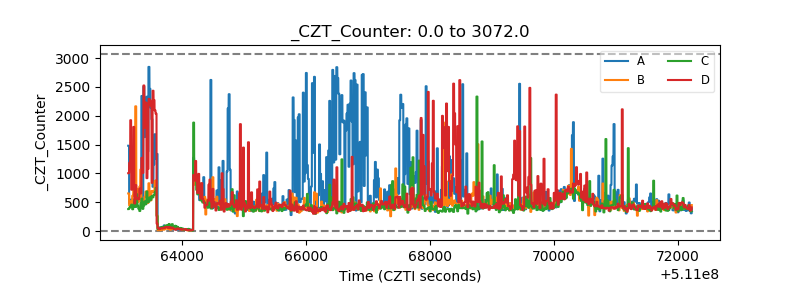 |
| +2.5 Volts monitor |  |
| +5 Volts monitor |  |
| _ROLL_ROT | 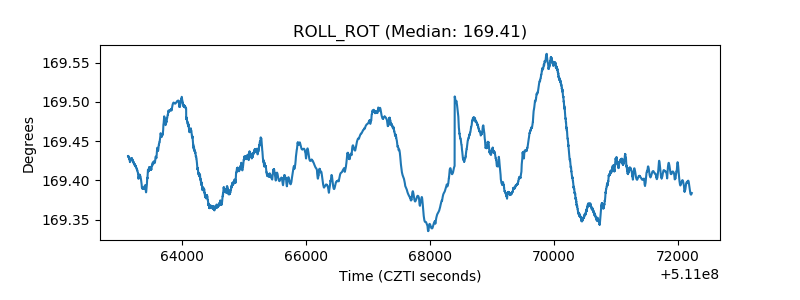 |
| _Roll_DEC | 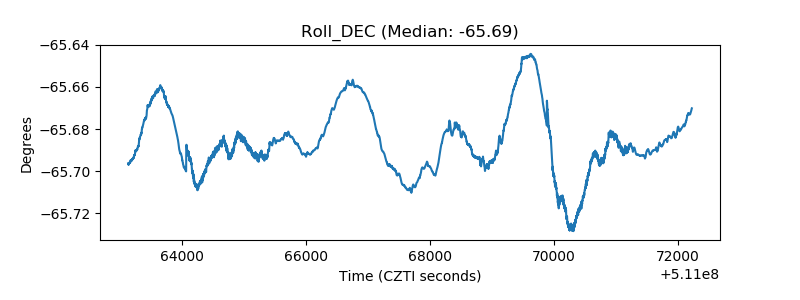 |
| _Roll_RA | 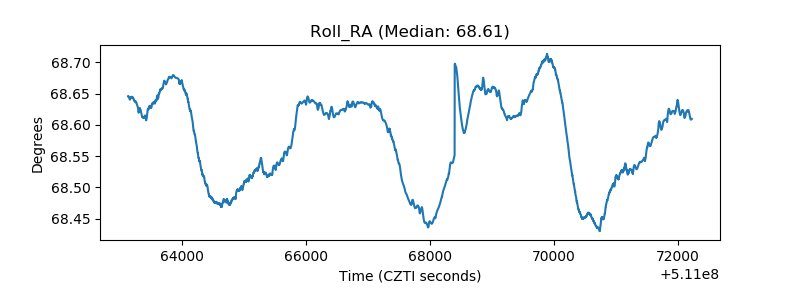 |
| Veto Counter | 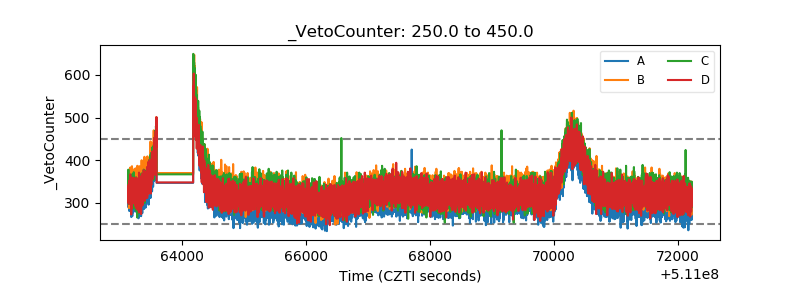 |