| Param | Original file | Final file |
|---|---|---|
| Filename | modeM0/AS1A14_083T06_9000006558_56570cztM0_level2.fits | modeM0/AS1A14_083T06_9000006558_56570cztM0_level2_quad_clean.evt |
| Size (bytes) | 620,697,600 | 121,320,000 |
| Size | 591.9 MB | 115.7 MB |
| Events in quadrant A | 7,197,608 | 732,787 |
| Events in quadrant B | 4,391,891 | 877,163 |
| Events in quadrant C | 4,001,327 | 768,114 |
| Events in quadrant D | 6,715,313 | 695,632 |
| Mode SS | |||
|---|---|---|---|
| Quadrant | BADHDUFLAG | Total packets | Discarded packets |
| A | 0 | 172 | 0 |
| B | 0 | 172 | 0 |
| C | 0 | 172 | 0 |
| D | 0 | 172 | 0 |
| Mode M0 | |||
|---|---|---|---|
| Quadrant | BADHDUFLAG | Total packets | Discarded packets |
| A | 0 | 27482 | 0 |
| B | 0 | 19258 | 0 |
| C | 0 | 18397 | 0 |
| D | 0 | 26024 | 0 |
| Quadrant | Total seconds | Saturated seconds | Saturation percentage |
|---|---|---|---|
| A | 8637 | 920 | 10.651847% |
| B | 8638 | 98 | 1.134522% |
| C | 8638 | 46 | 0.532531% |
| D | 8638 | 414 | 4.792776% |
Noise dominated data is calculated using 1-second bins in cleaned event files. If a bin has >2000 counts, and if more than 50% of those come from <1% of pixels, then it is considered to be noise-dominated and hence unusable.
| Quadrant | # 1 sec bins | Bins with >0 counts | Bins with >2000 counts | High rate bins dominated by noise | Noise dominated (total time) | Noise dominated (detector-on time) | Marked lightcurve |
|---|---|---|---|---|---|---|---|
| A | 8637 | 8637 | 713 | 713 | 8.26% | 8.26% | 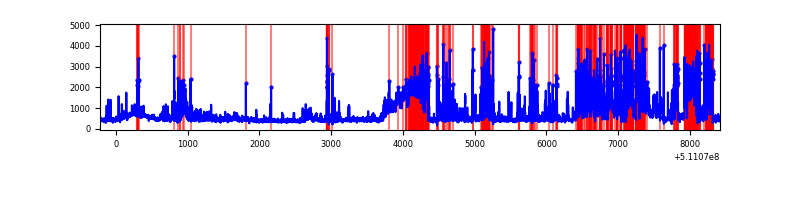 |
| B | 8638 | 8638 | 37 | 37 | 0.43% | 0.43% | 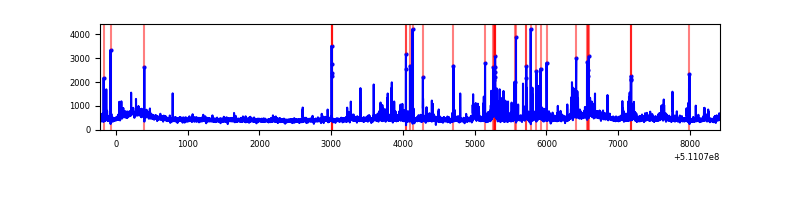 |
| C | 8638 | 8638 | 37 | 37 | 0.43% | 0.43% | 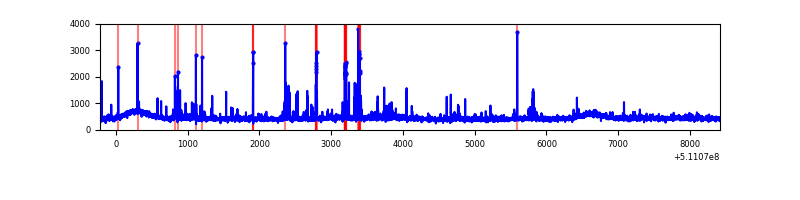 |
| D | 8638 | 8638 | 444 | 444 | 5.14% | 5.14% | 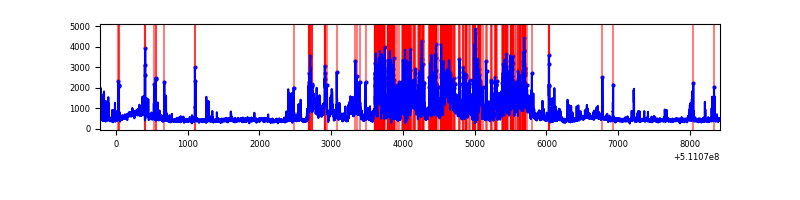 |
Top three noisy pixels from each quadrant. If the there are fewer than three noisy pixels in the level2.evt file, extra rows are filled as -1
| Pixel properties | Quadrant properties | ||||||
|---|---|---|---|---|---|---|---|
| Quadrant | DetID | PixID | Counts | Sigma | Mean | Median | Sigma |
| A | 4 | 249 | 2221632 | 10068.06 | 894 | 872 | 220.6 |
| A | 15 | 33 | 476024 | 2154.15 | 894 | 872 | 220.6 |
| A | 0 | 8 | 315575 | 1426.74 | 894 | 872 | 220.6 |
| B | 4 | 206 | 329653 | 1658.48 | 934 | 898 | 198.2 |
| B | 4 | 21 | 77592 | 386.9 | 934 | 898 | 198.2 |
| B | 4 | 171 | 68349 | 340.27 | 934 | 898 | 198.2 |
| C | 12 | 252 | 160224 | 646.2 | 915 | 905 | 246.5 |
| C | 13 | 3 | 101450 | 407.81 | 915 | 905 | 246.5 |
| C | 12 | 249 | 44229 | 175.72 | 915 | 905 | 246.5 |
| D | 3 | 12 | 1153168 | 4620.88 | 889 | 850 | 249.4 |
| D | 8 | 129 | 813169 | 3257.46 | 889 | 850 | 249.4 |
| D | 6 | 239 | 721340 | 2889.22 | 889 | 850 | 249.4 |
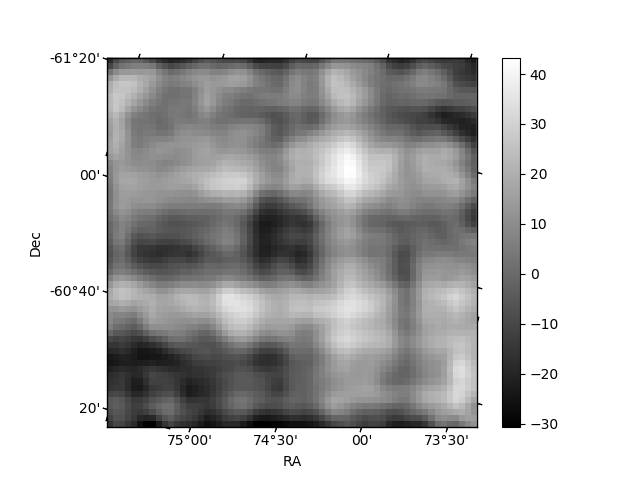
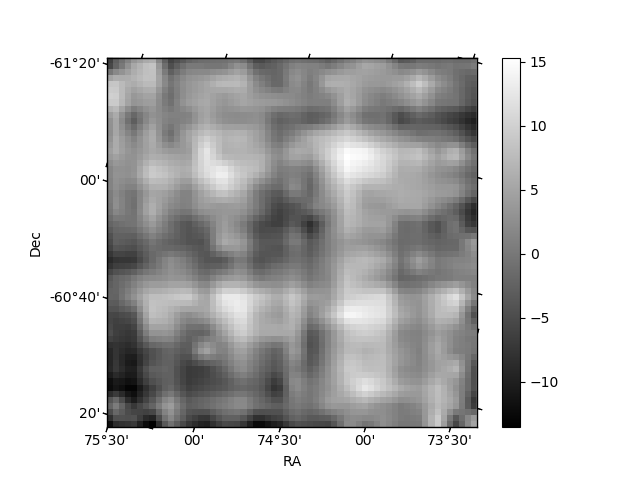
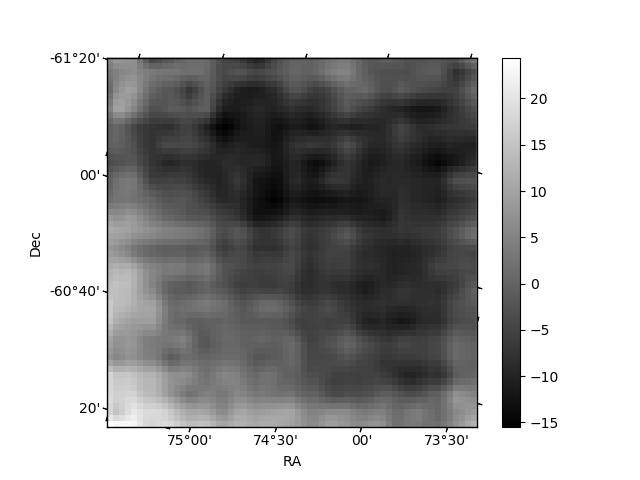
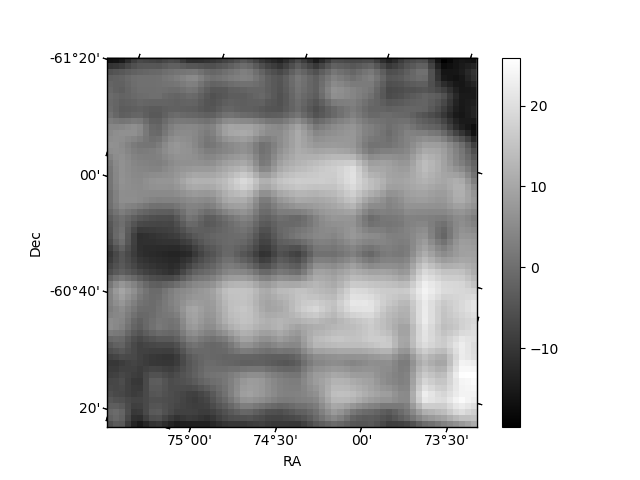
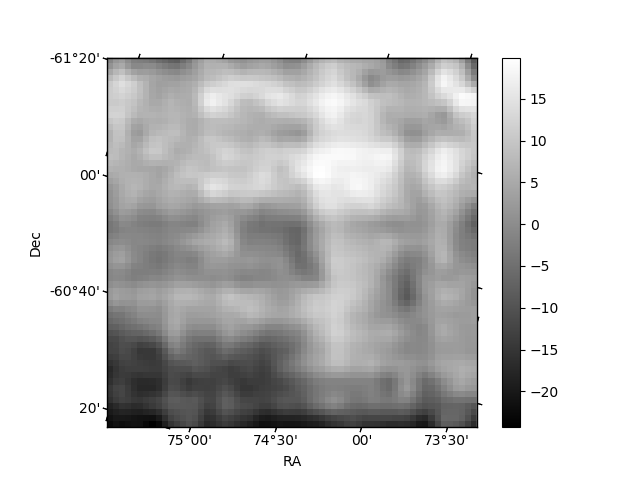
Histogram calculated using DETX and DETY for each event in the final _common_clean file
| Quadrant A | 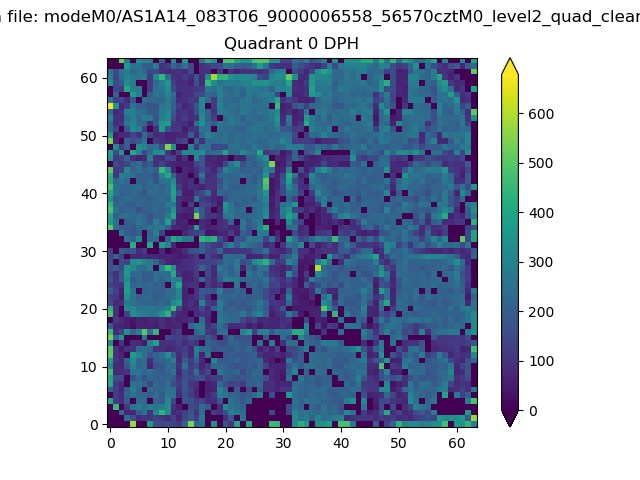 |
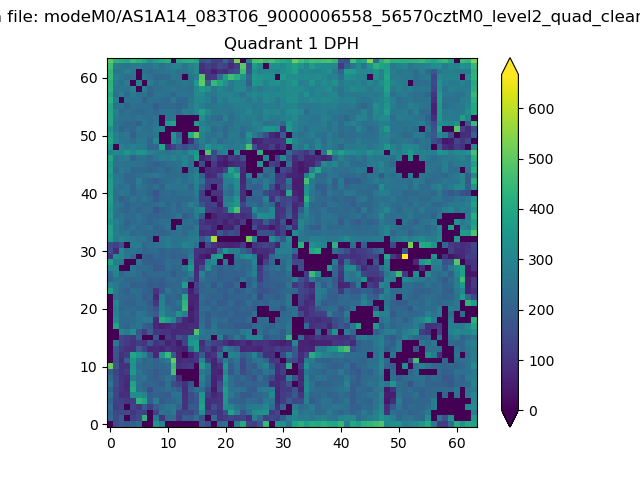 |
Quadrant B |
|---|---|---|---|
| Quadrant D | 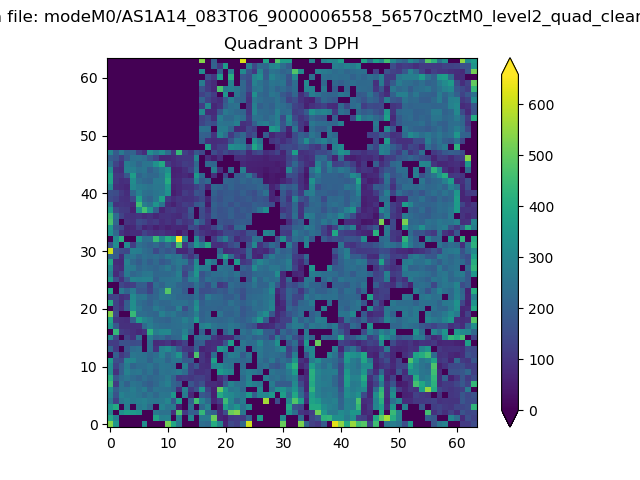 |
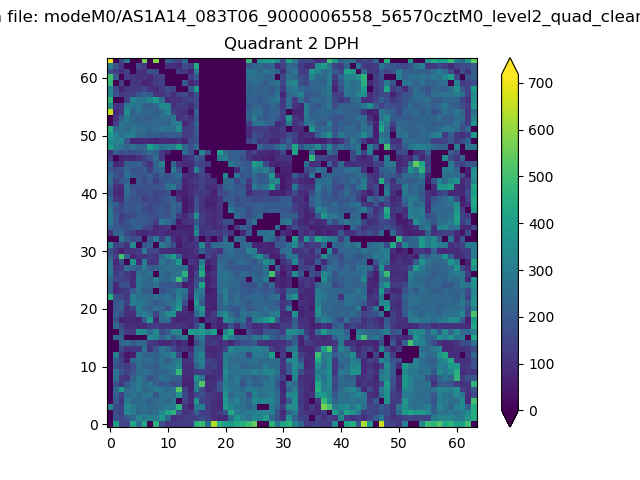 |
Quadrant C |
| Plot type | Count rate plots | Images |
|---|---|---|
| Comparison with Poisson distribution Blue bars denote a histogram of data divided into 1 sec bins. Red curve is a Poisson curve with rate = median count rate of data. |
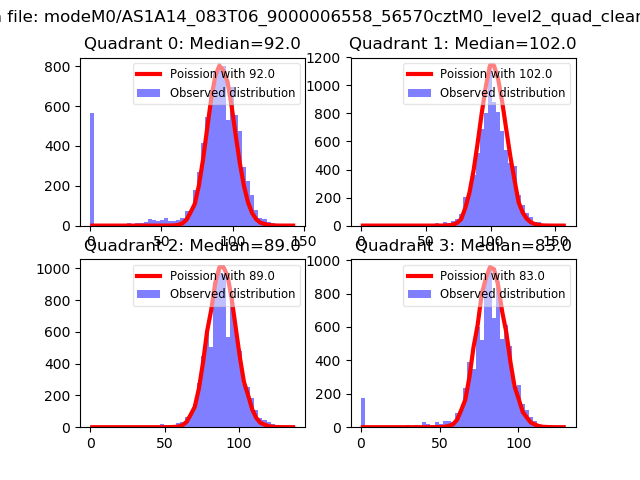 |
 |
| Quadrant-wise count rates Data is divided into 100 sec bins |
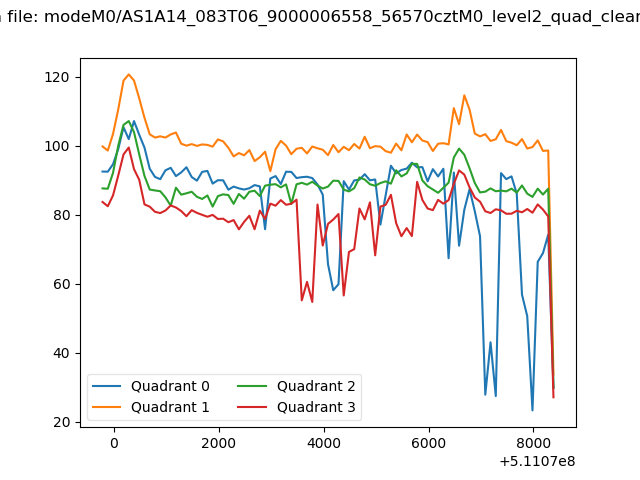 |
|
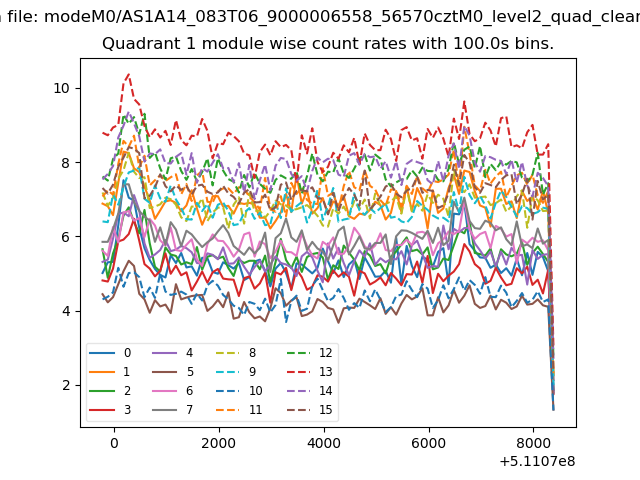
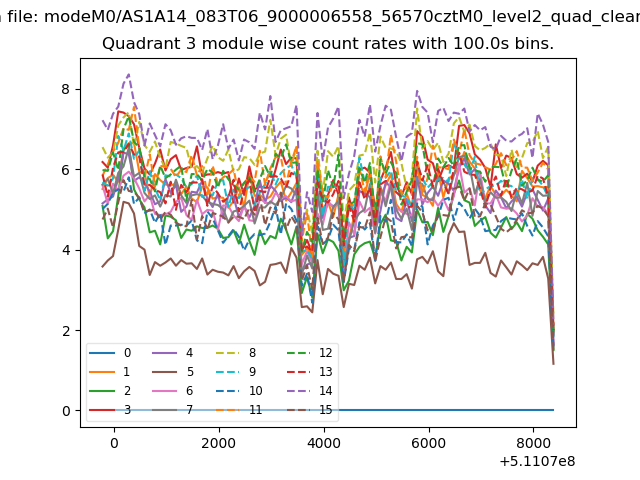
| Module-wise count rates for Quadrant A Data is divided into 100 sec bins |
 |
 |
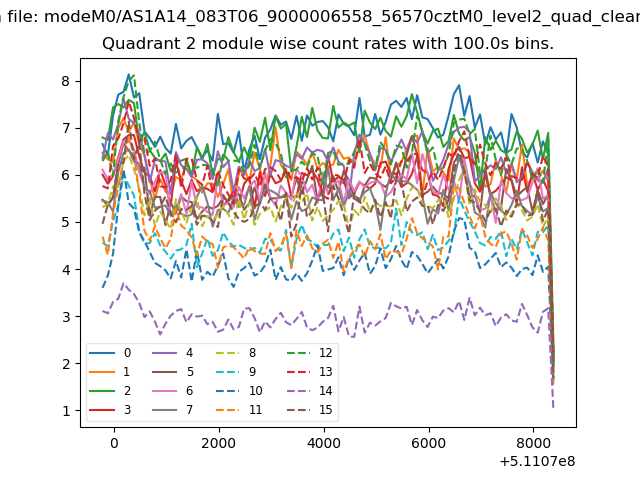
| Module-wise count rates for Quadrant B Data is divided into 100 sec bins |
 |
 |
| Module-wise count rates for Quadrant C Data is divided into 100 sec bins |
 |
 |
| Module-wise count rates for Quadrant D Data is divided into 100 sec bins |
 |
 |
| Parameter | Plot |
|---|---|
| CZT HV Monitor | 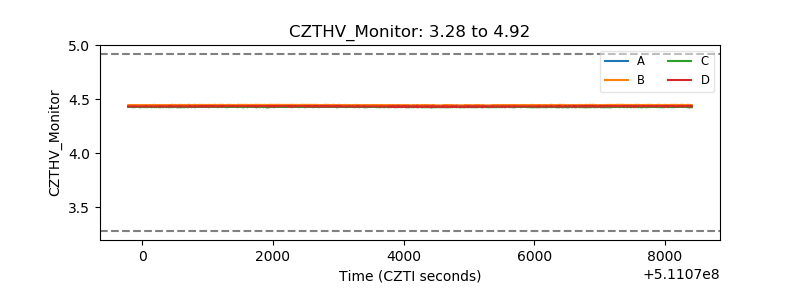 |
| D_VDD | 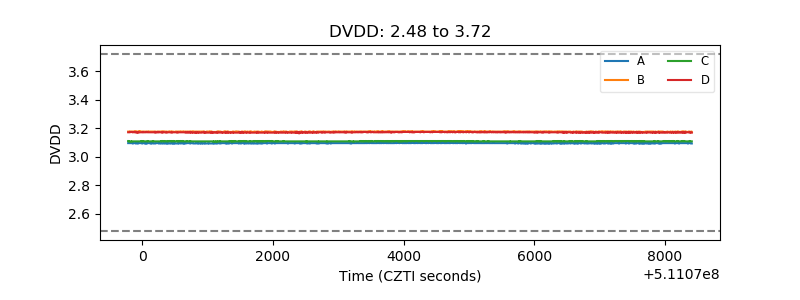 |
| Temperature 1 | 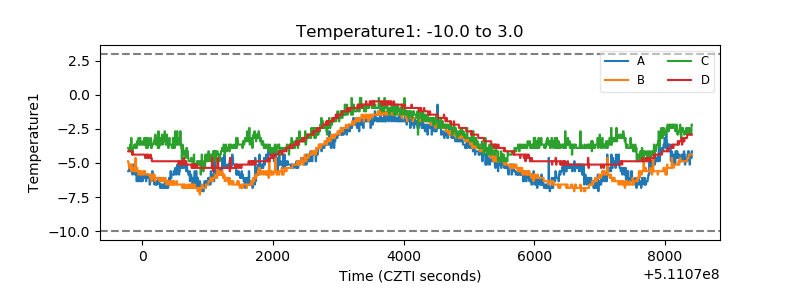 |
| Veto HV Monitor | 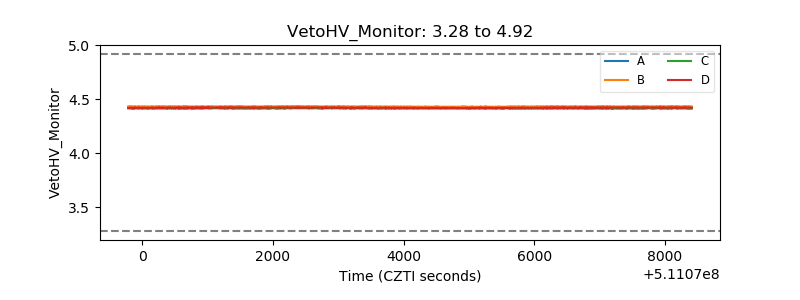 |
| Veto LLD | 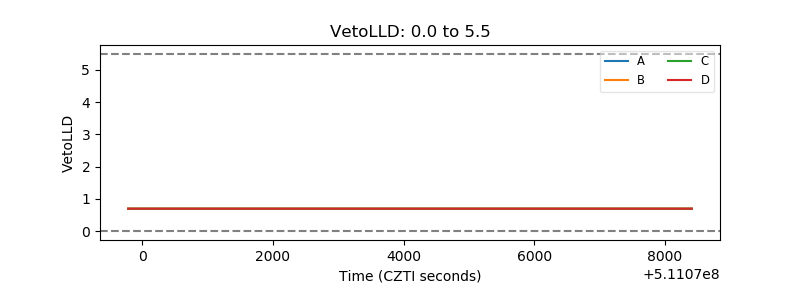 |
| Alpha Counter | 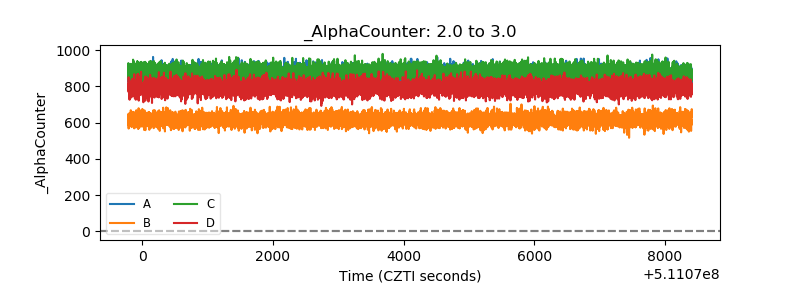 |
| _CPM_Rate | 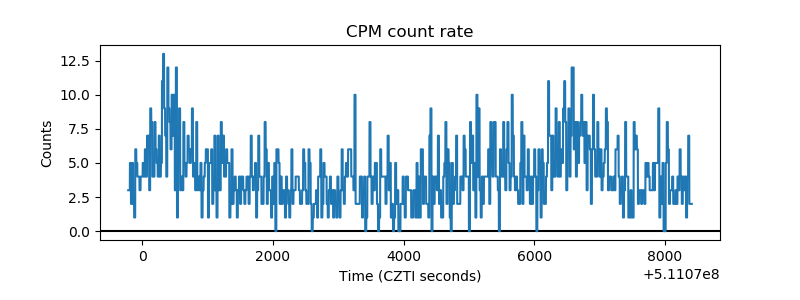 |
| CZT Counter | 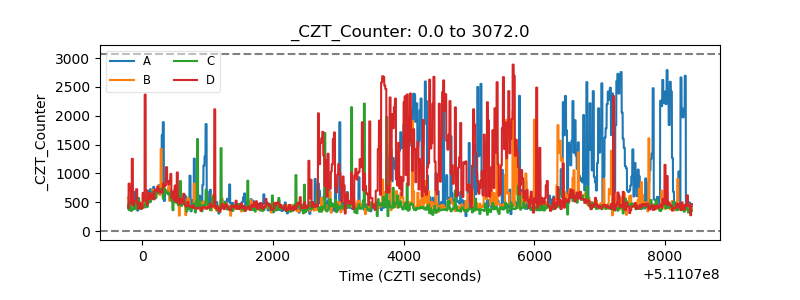 |
| +2.5 Volts monitor |  |
| +5 Volts monitor |  |
| _ROLL_ROT | 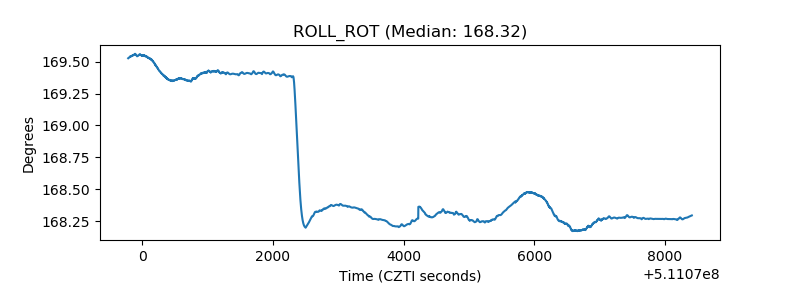 |
| _Roll_DEC | 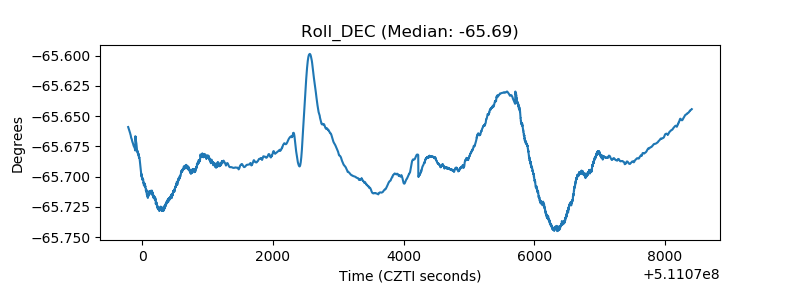 |
| _Roll_RA | 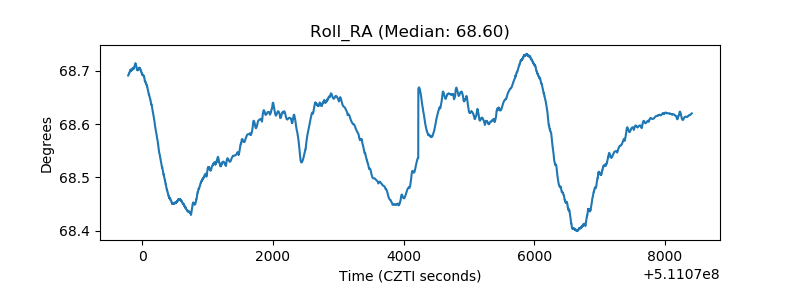 |
| Veto Counter | 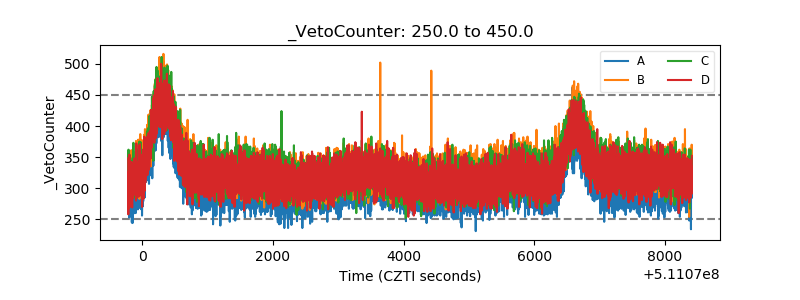 |