| Param | Original file | Final file |
|---|---|---|
| Filename | modeM0/AS1A14_083T06_9000006558_56571cztM0_level2.fits | modeM0/AS1A14_083T06_9000006558_56571cztM0_level2_quad_clean.evt |
| Size (bytes) | 505,831,680 | 101,652,480 |
| Size | 482.4 MB | 96.9 MB |
| Events in quadrant A | 5,877,036 | 613,330 |
| Events in quadrant B | 4,134,964 | 723,841 |
| Events in quadrant C | 3,981,307 | 633,506 |
| Events in quadrant D | 4,162,682 | 598,289 |
| Mode SS | |||
|---|---|---|---|
| Quadrant | BADHDUFLAG | Total packets | Discarded packets |
| A | 0 | 146 | 0 |
| B | 0 | 146 | 0 |
| C | 0 | 146 | 0 |
| D | 0 | 146 | 0 |
| Mode M0 | |||
|---|---|---|---|
| Quadrant | BADHDUFLAG | Total packets | Discarded packets |
| A | 0 | 22584 | 0 |
| B | 0 | 17319 | 0 |
| C | 0 | 17285 | 0 |
| D | 0 | 17592 | 0 |
| Quadrant | Total seconds | Saturated seconds | Saturation percentage |
|---|---|---|---|
| A | 7309 | 870 | 11.903133% |
| B | 7309 | 238 | 3.256259% |
| C | 7309 | 267 | 3.653031% |
| D | 7310 | 202 | 2.763338% |
Noise dominated data is calculated using 1-second bins in cleaned event files. If a bin has >2000 counts, and if more than 50% of those come from <1% of pixels, then it is considered to be noise-dominated and hence unusable.
| Quadrant | # 1 sec bins | Bins with >0 counts | Bins with >2000 counts | High rate bins dominated by noise | Noise dominated (total time) | Noise dominated (detector-on time) | Marked lightcurve |
|---|---|---|---|---|---|---|---|
| A | 7309 | 7309 | 714 | 714 | 9.77% | 9.77% | 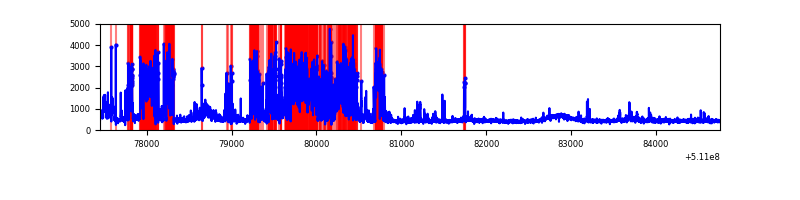 |
| B | 7309 | 7309 | 133 | 133 | 1.82% | 1.82% | 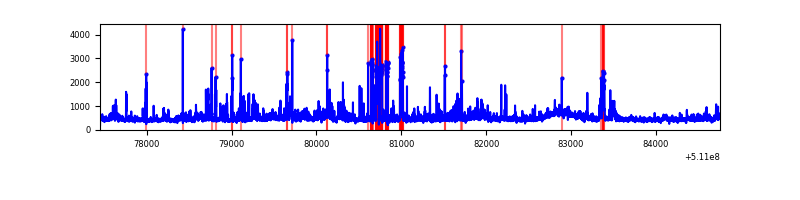 |
| C | 7309 | 7309 | 226 | 226 | 3.09% | 3.09% | 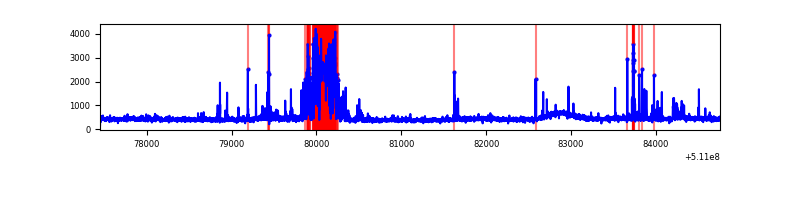 |
| D | 7310 | 7310 | 155 | 155 | 2.12% | 2.12% | 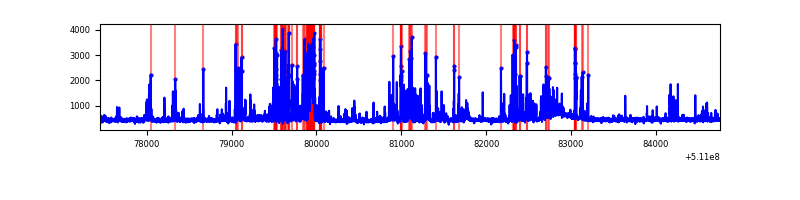 |
Top three noisy pixels from each quadrant. If the there are fewer than three noisy pixels in the level2.evt file, extra rows are filled as -1
| Pixel properties | Quadrant properties | ||||||
|---|---|---|---|---|---|---|---|
| Quadrant | DetID | PixID | Counts | Sigma | Mean | Median | Sigma |
| A | 4 | 249 | 1720013 | 9249.56 | 749 | 731 | 185.9 |
| A | 15 | 33 | 636364 | 3419.64 | 749 | 731 | 185.9 |
| A | 15 | 48 | 217224 | 1164.71 | 749 | 731 | 185.9 |
| B | 4 | 206 | 611281 | 3684.87 | 770 | 741 | 165.7 |
| B | 4 | 169 | 152247 | 914.4 | 770 | 741 | 165.7 |
| B | 4 | 171 | 116115 | 696.33 | 770 | 741 | 165.7 |
| C | 15 | 230 | 702090 | 3446.99 | 757 | 751 | 203.5 |
| C | 12 | 252 | 91343 | 445.25 | 757 | 751 | 203.5 |
| C | 12 | 249 | 87402 | 425.88 | 757 | 751 | 203.5 |
| D | 6 | 239 | 396694 | 1858.23 | 756 | 723 | 213.1 |
| D | 2 | 249 | 246026 | 1151.17 | 756 | 723 | 213.1 |
| D | 3 | 12 | 159008 | 742.81 | 756 | 723 | 213.1 |
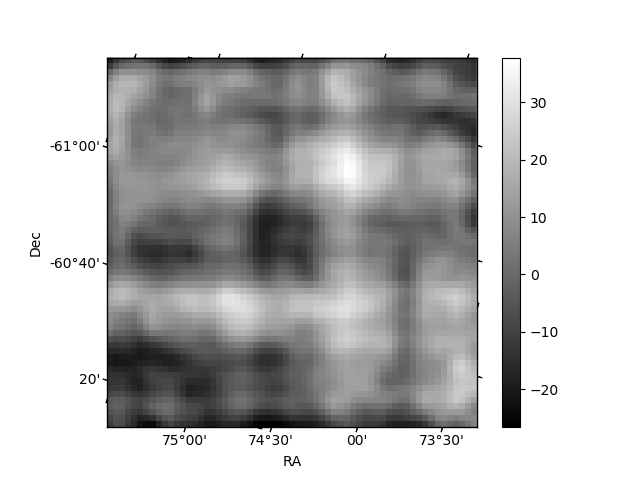
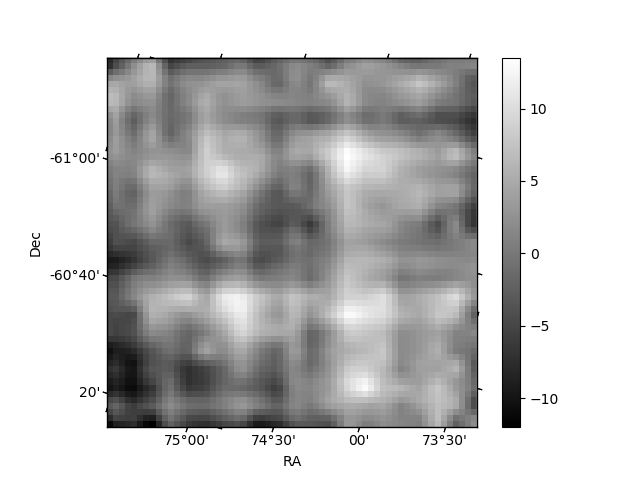
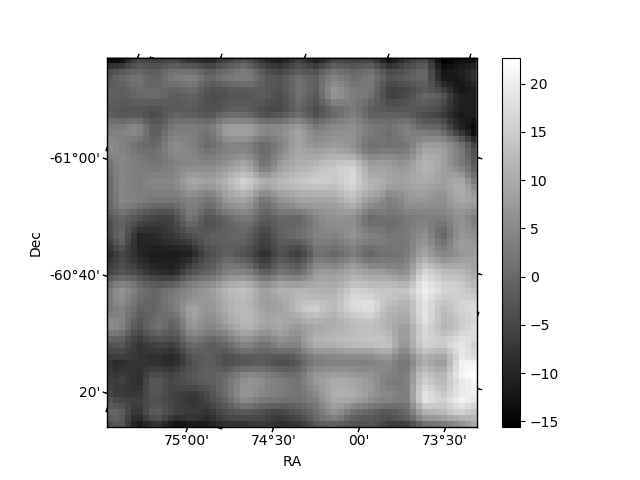
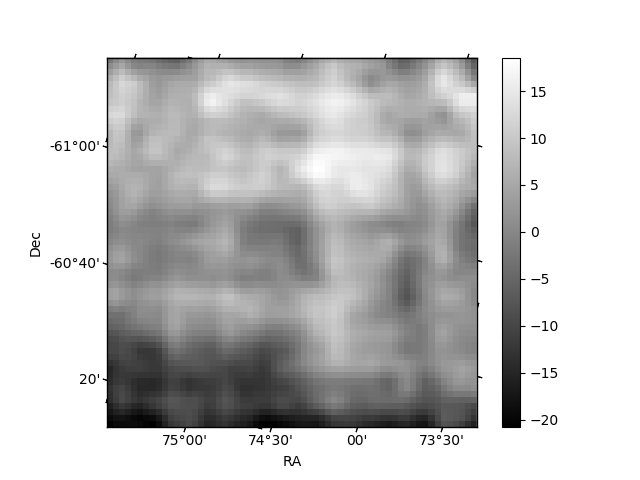
Histogram calculated using DETX and DETY for each event in the final _common_clean file
| Quadrant A | 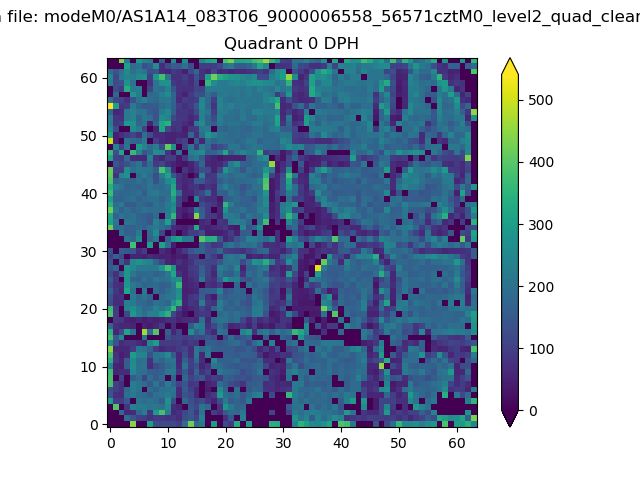 |
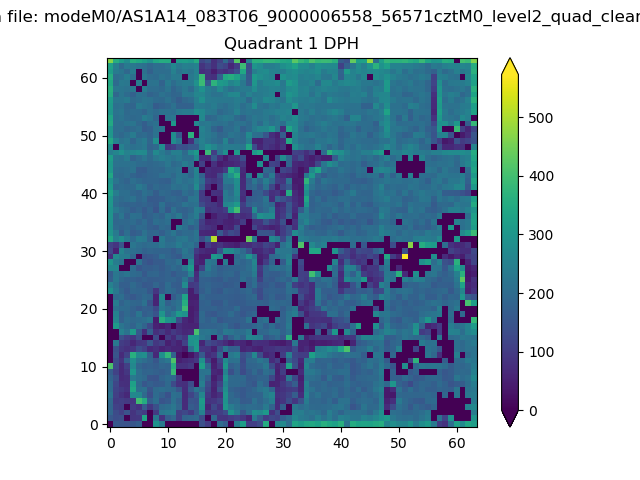 |
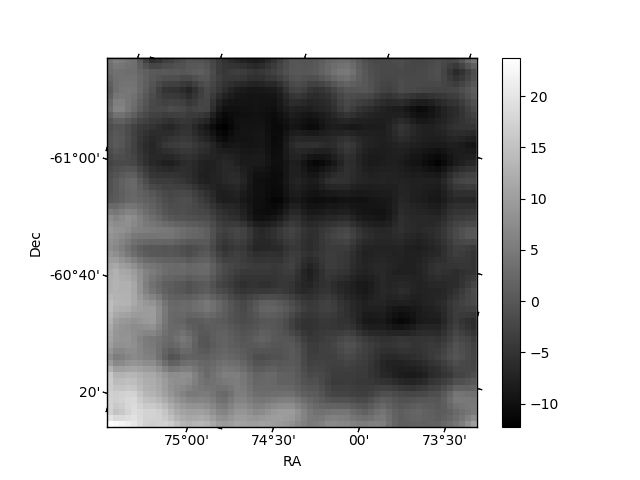
Quadrant B |
|---|---|---|---|
| Quadrant D | 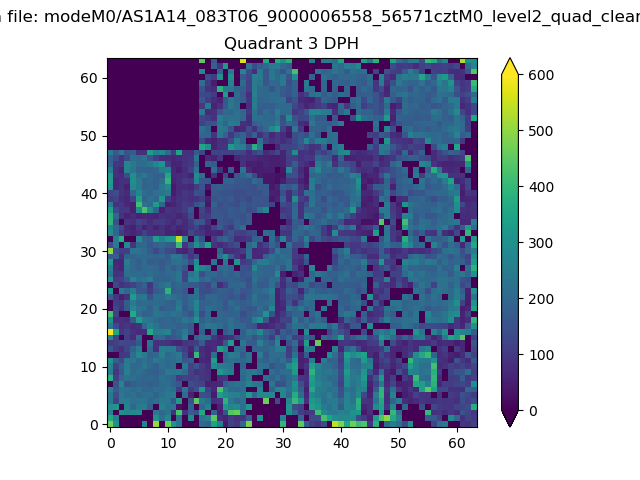 |
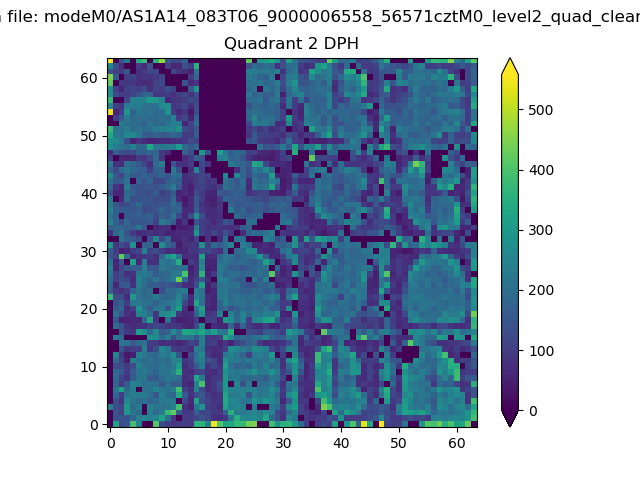 |
Quadrant C |
| Plot type | Count rate plots | Images |
|---|---|---|
| Comparison with Poisson distribution Blue bars denote a histogram of data divided into 1 sec bins. Red curve is a Poisson curve with rate = median count rate of data. |
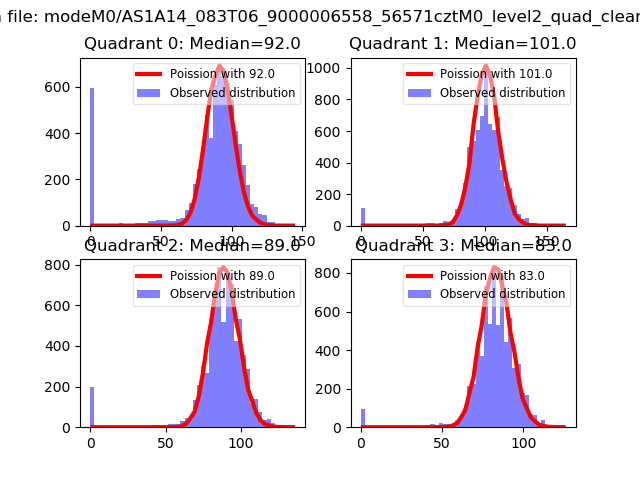 |
 |
| Quadrant-wise count rates Data is divided into 100 sec bins |
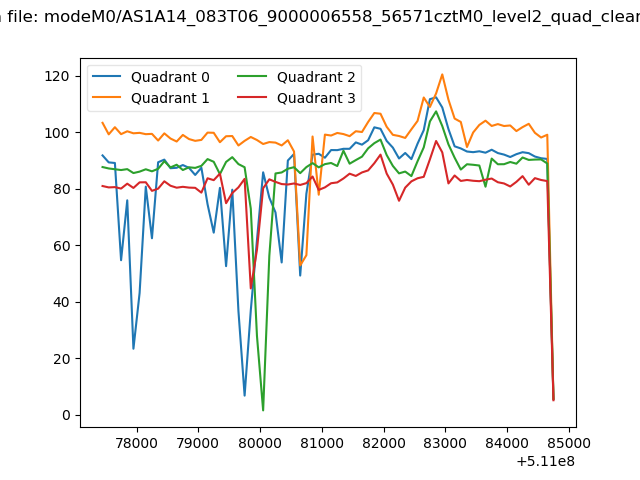 |
|
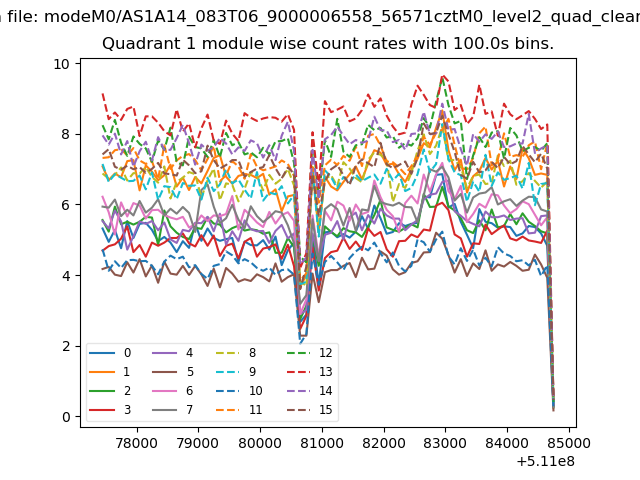
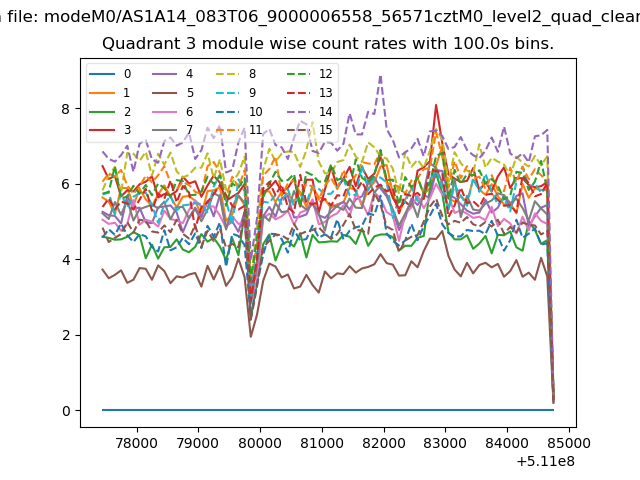
| Module-wise count rates for Quadrant A Data is divided into 100 sec bins |
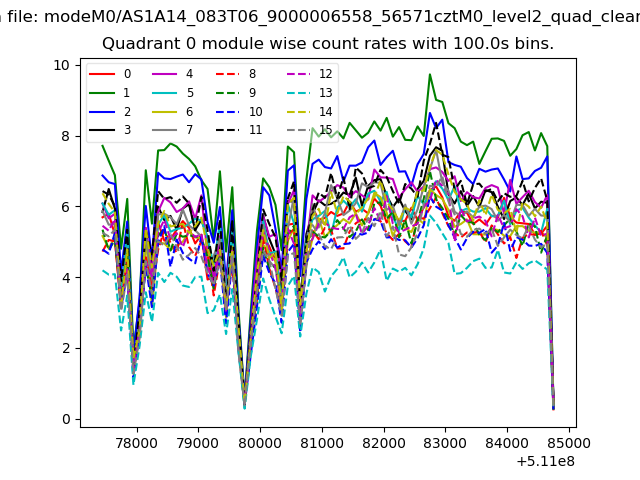 |
 |
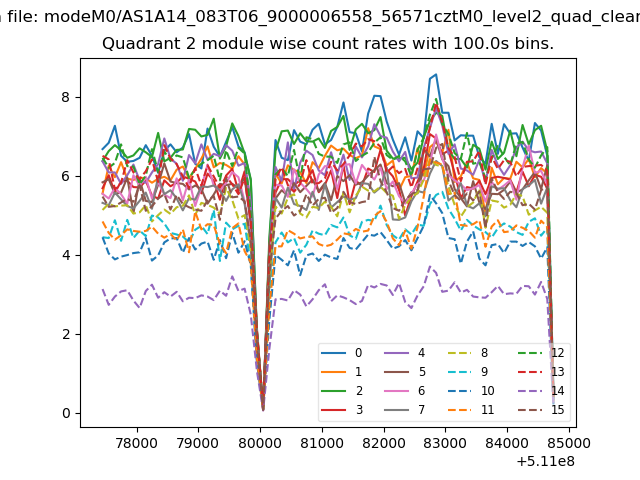
| Module-wise count rates for Quadrant B Data is divided into 100 sec bins |
 |
 |
| Module-wise count rates for Quadrant C Data is divided into 100 sec bins |
 |
 |
| Module-wise count rates for Quadrant D Data is divided into 100 sec bins |
 |
 |
| Parameter | Plot |
|---|---|
| CZT HV Monitor | 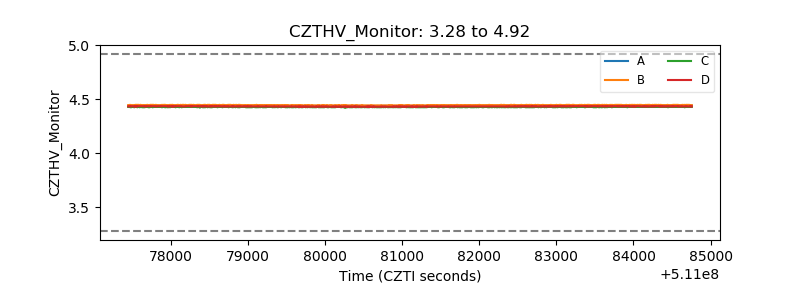 |
| D_VDD | 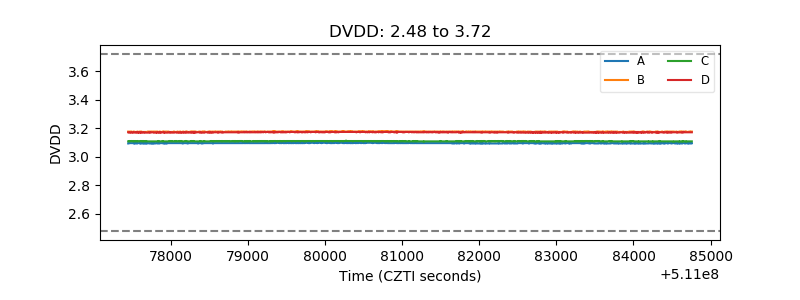 |
| Temperature 1 | 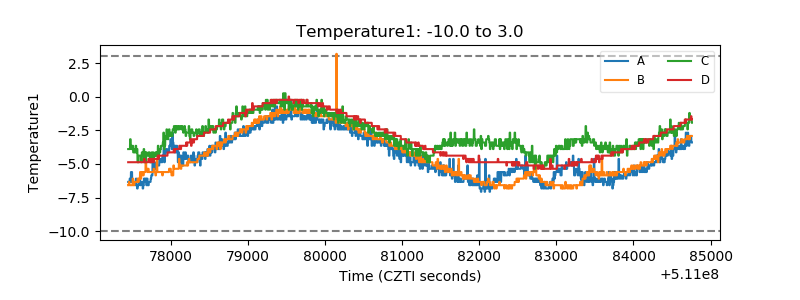 |
| Veto HV Monitor |  |
| Veto LLD | 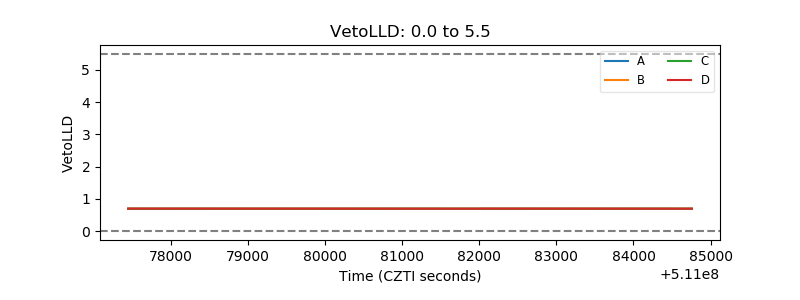 |
| Alpha Counter | 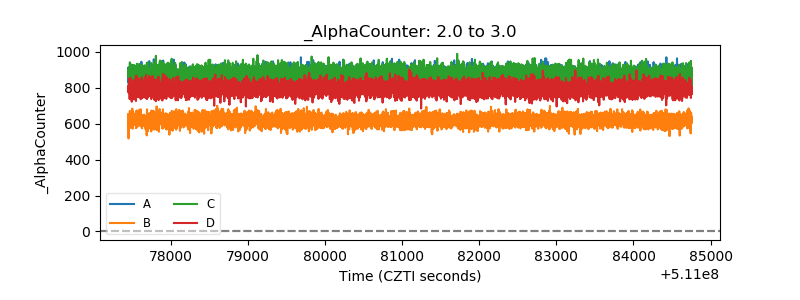 |
| _CPM_Rate | 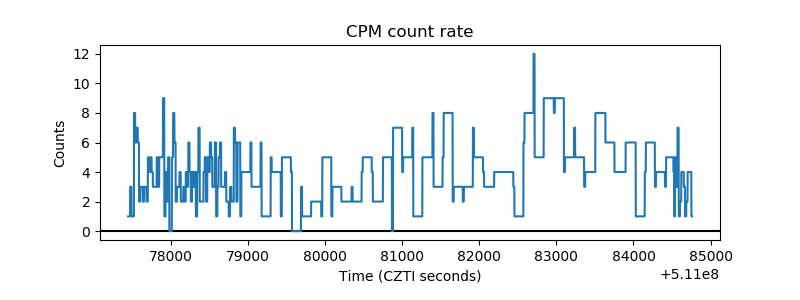 |
| CZT Counter | 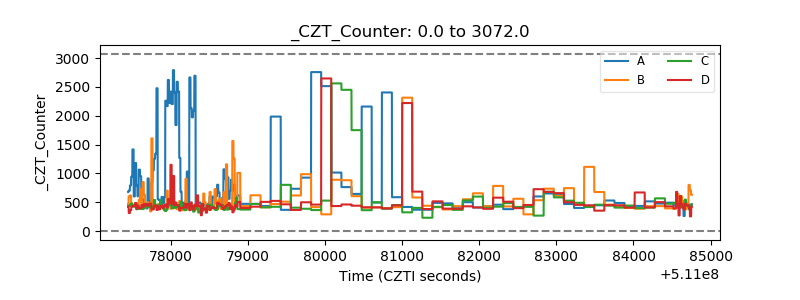 |
| +2.5 Volts monitor |  |
| +5 Volts monitor |  |
| _ROLL_ROT | 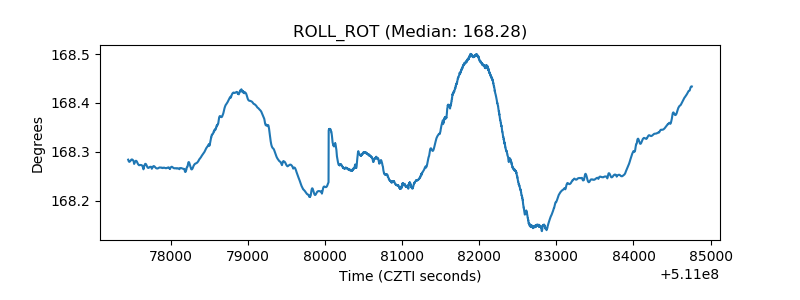 |
| _Roll_DEC | 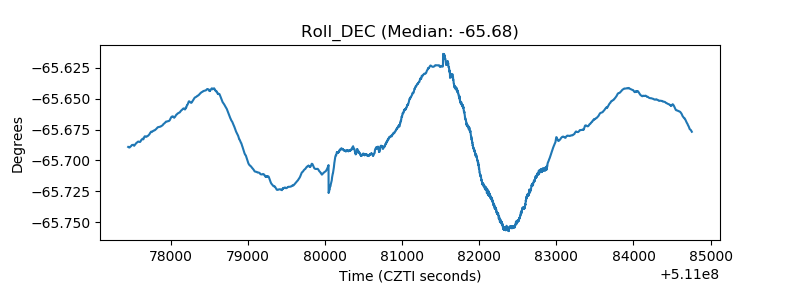 |
| _Roll_RA | 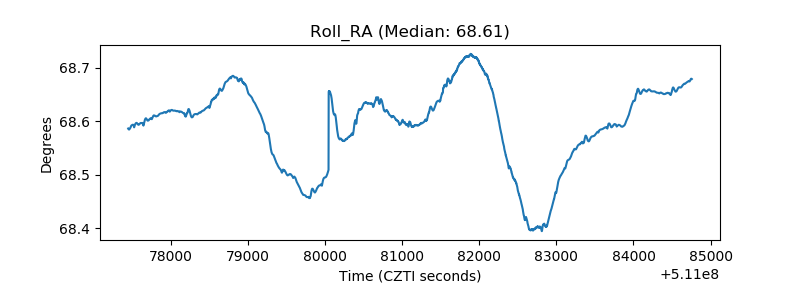 |
| Veto Counter | 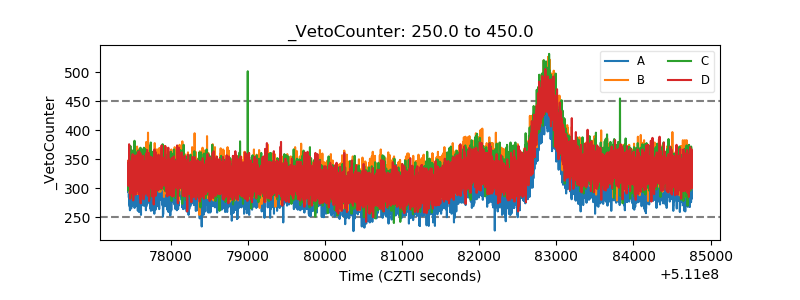 |