| Param | Original file | Final file |
|---|---|---|
| Filename | modeM0/AS1A14_083T06_9000006558_56574cztM0_level2.fits | modeM0/AS1A14_083T06_9000006558_56574cztM0_level2_quad_clean.evt |
| Size (bytes) | 1,170,406,080 | 258,768,000 |
| Size | 1.1 GB | 246.8 MB |
| Events in quadrant A | 10,111,584 | 1,684,739 |
| Events in quadrant B | 8,826,913 | 1,828,175 |
| Events in quadrant C | 8,897,263 | 1,624,709 |
| Events in quadrant D | 14,051,168 | 1,418,670 |
| Mode SS | |||
|---|---|---|---|
| Quadrant | BADHDUFLAG | Total packets | Discarded packets |
| A | 0 | 376 | 0 |
| B | 0 | 376 | 0 |
| C | 0 | 376 | 0 |
| D | 0 | 376 | 0 |
| Mode M9 | |||
|---|---|---|---|
| Quadrant | BADHDUFLAG | Total packets | Discarded packets |
| A | 0 | 13 | 0 |
| B | 0 | 13 | 0 |
| C | 0 | 13 | 0 |
| D | 0 | 13 | 0 |
| Mode M0 | |||
|---|---|---|---|
| Quadrant | BADHDUFLAG | Total packets | Discarded packets |
| A | 0 | 43082 | 4 |
| B | 0 | 39437 | 7 |
| C | 0 | 40482 | 8 |
| D | 0 | 54442 | 4 |
| Quadrant | Total seconds | Saturated seconds | Saturation percentage |
|---|---|---|---|
| A | 18553 | 676 | 3.643616% |
| B | 18552 | 484 | 2.608883% |
| C | 18552 | 392 | 2.112980% |
| D | 18554 | 1631 | 8.790557% |
Noise dominated data is calculated using 1-second bins in cleaned event files. If a bin has >2000 counts, and if more than 50% of those come from <1% of pixels, then it is considered to be noise-dominated and hence unusable.
| Quadrant | # 1 sec bins | Bins with >0 counts | Bins with >2000 counts | High rate bins dominated by noise | Noise dominated (total time) | Noise dominated (detector-on time) | Marked lightcurve |
|---|---|---|---|---|---|---|---|
| A | 19823 | 18555 | 236 | 236 | 1.19% | 1.27% | 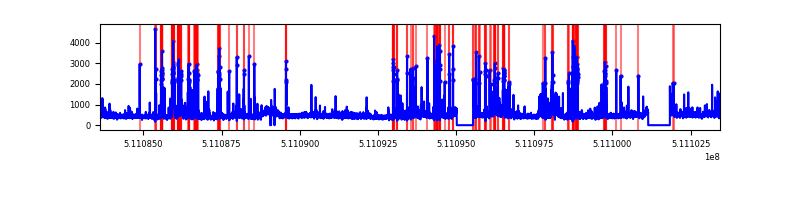 |
| B | 19824 | 18556 | 40 | 40 | 0.20% | 0.22% | 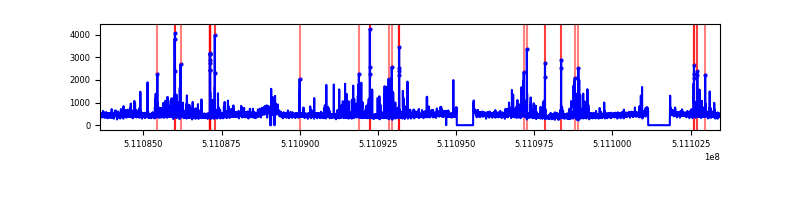 |
| C | 19824 | 18557 | 90 | 90 | 0.45% | 0.48% | 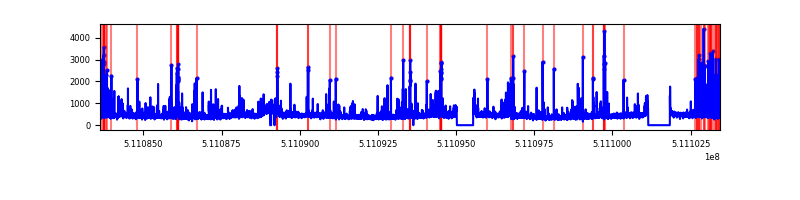 |
| D | 19824 | 18558 | 1261 | 1261 | 6.36% | 6.79% | 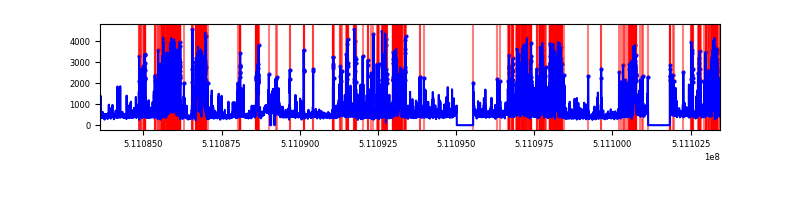 |
Top three noisy pixels from each quadrant. If the there are fewer than three noisy pixels in the level2.evt file, extra rows are filled as -1
| Pixel properties | Quadrant properties | ||||||
|---|---|---|---|---|---|---|---|
| Quadrant | DetID | PixID | Counts | Sigma | Mean | Median | Sigma |
| A | 0 | 8 | 780298 | 1585.29 | 2001 | 1946 | 491.0 |
| A | 7 | 64 | 259525 | 524.62 | 2001 | 1946 | 491.0 |
| A | 4 | 95 | 240444 | 485.75 | 2001 | 1946 | 491.0 |
| B | 0 | 173 | 156559 | 368.08 | 1981 | 1908 | 420.2 |
| B | 4 | 171 | 134753 | 316.18 | 1981 | 1908 | 420.2 |
| B | 4 | 206 | 123652 | 289.76 | 1981 | 1908 | 420.2 |
| C | 6 | 223 | 384488 | 724.62 | 1949 | 1921 | 528.0 |
| C | 12 | 249 | 291683 | 548.84 | 1949 | 1921 | 528.0 |
| C | 12 | 252 | 180903 | 339.01 | 1949 | 1921 | 528.0 |
| D | 2 | 249 | 2685519 | 4974.66 | 1891 | 1802 | 539.5 |
| D | 6 | 239 | 1753910 | 3247.78 | 1891 | 1802 | 539.5 |
| D | 3 | 12 | 414782 | 765.52 | 1891 | 1802 | 539.5 |
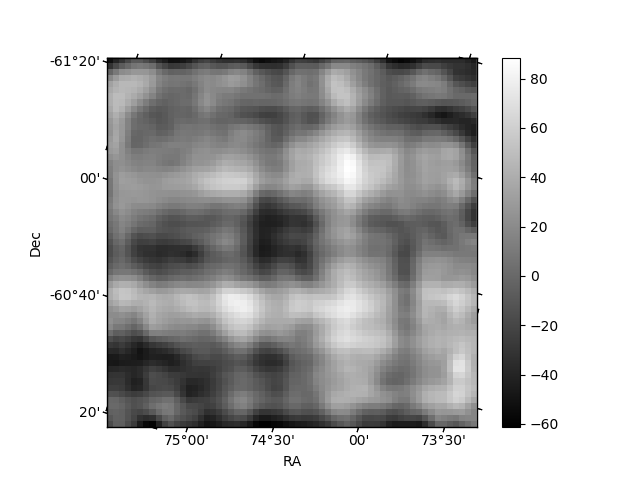
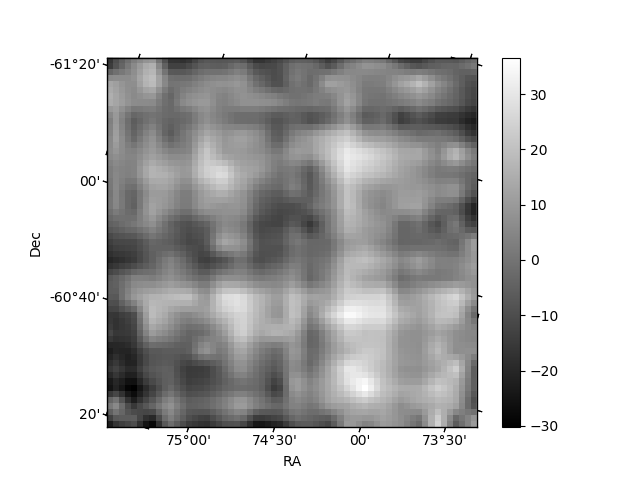
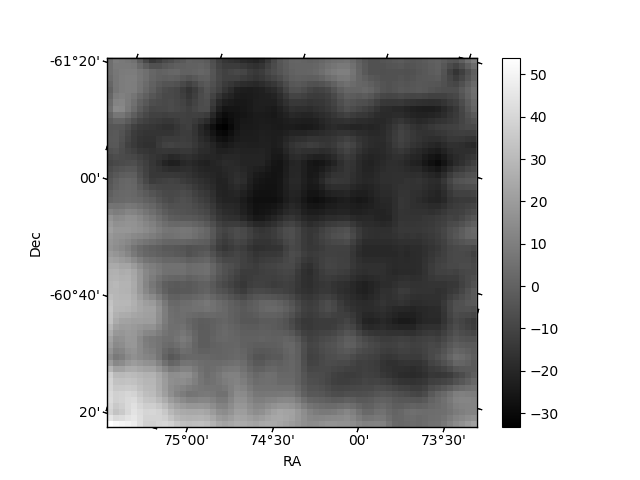
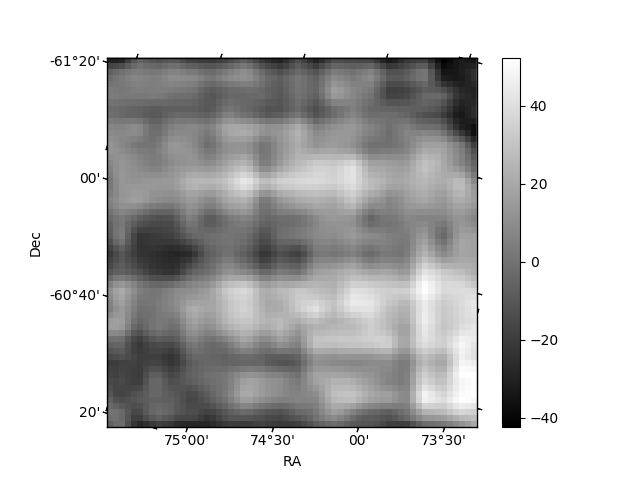
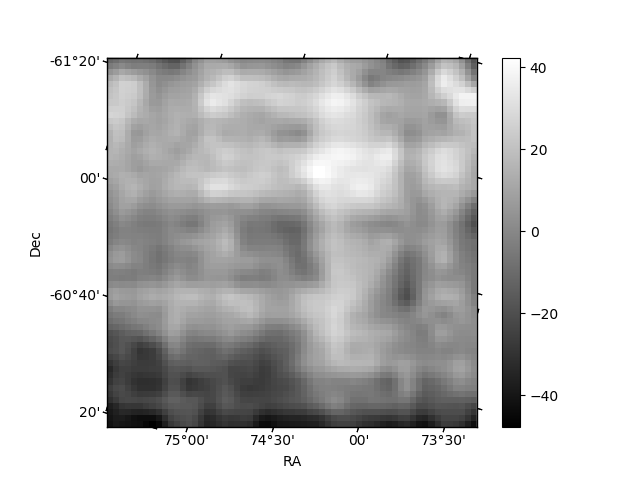
Histogram calculated using DETX and DETY for each event in the final _common_clean file
| Quadrant A | 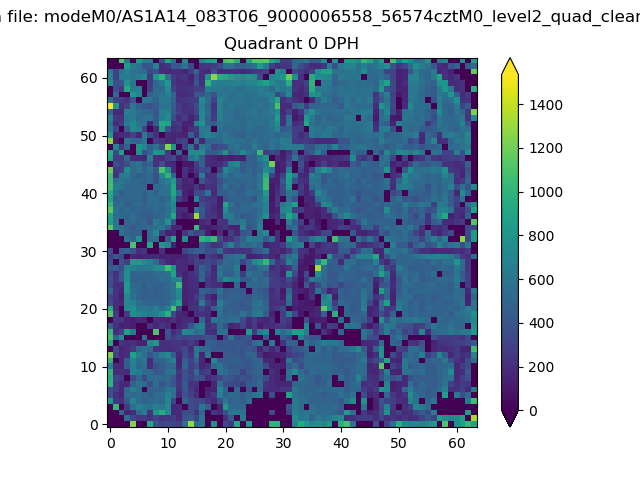 |
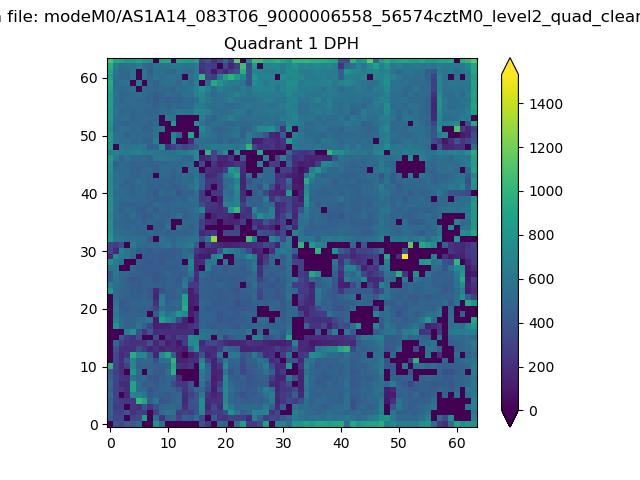 |
Quadrant B |
|---|---|---|---|
| Quadrant D | 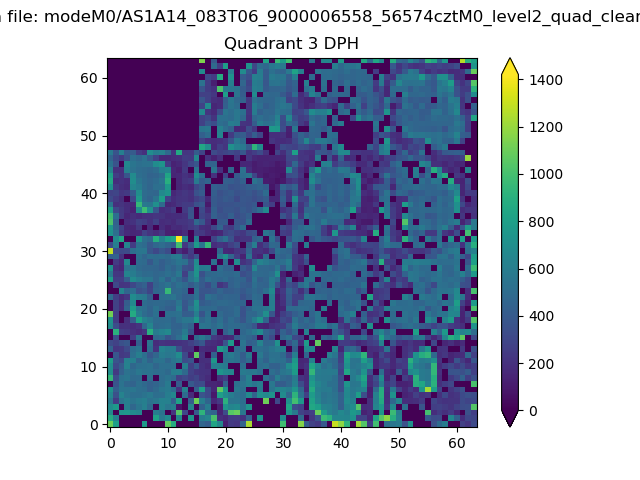 |
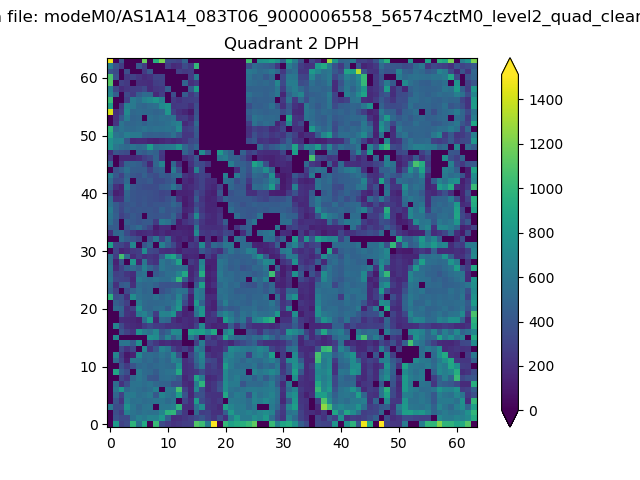 |
Quadrant C |
| Plot type | Count rate plots | Images |
|---|---|---|
| Comparison with Poisson distribution Blue bars denote a histogram of data divided into 1 sec bins. Red curve is a Poisson curve with rate = median count rate of data. |
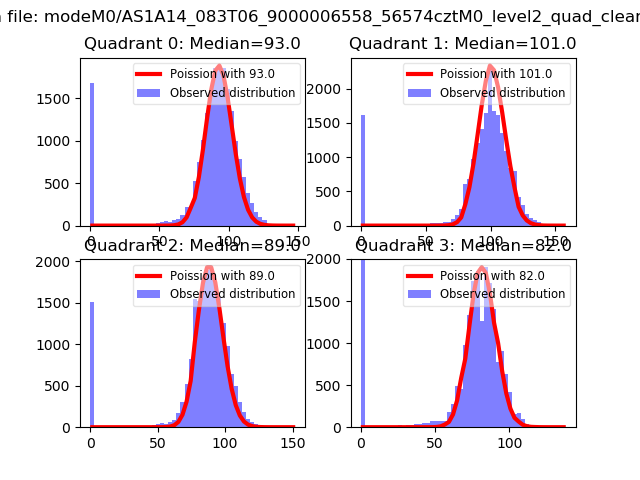 |
 |
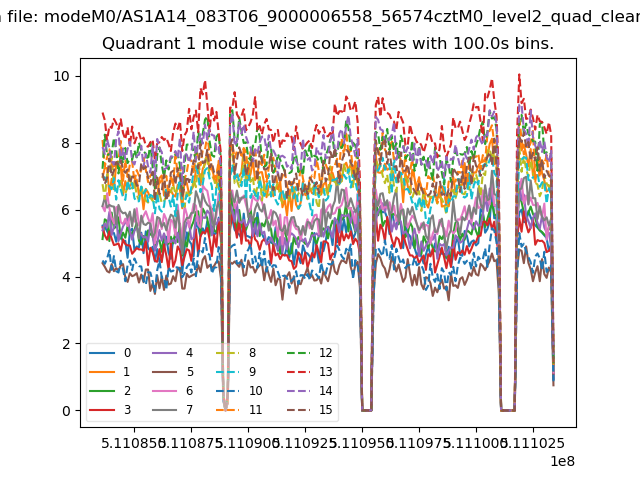
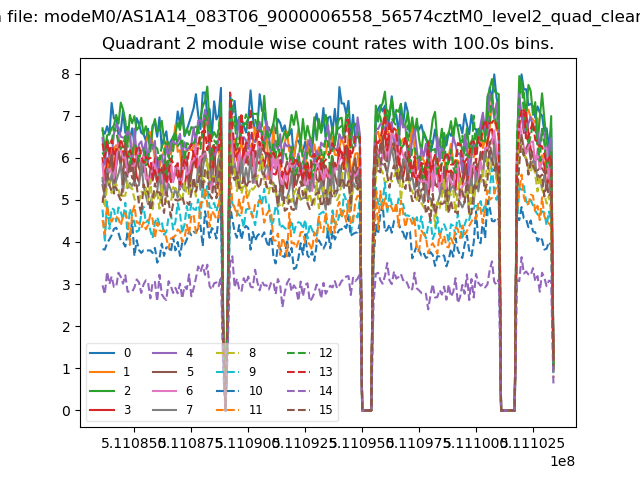
| Quadrant-wise count rates Data is divided into 100 sec bins |
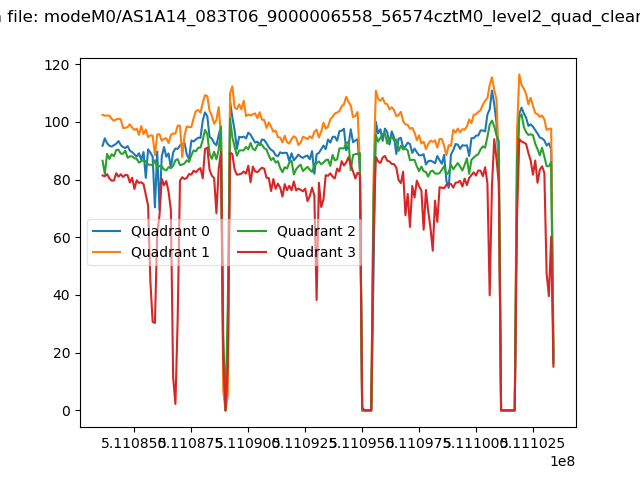 |
|
| Module-wise count rates for Quadrant A Data is divided into 100 sec bins |
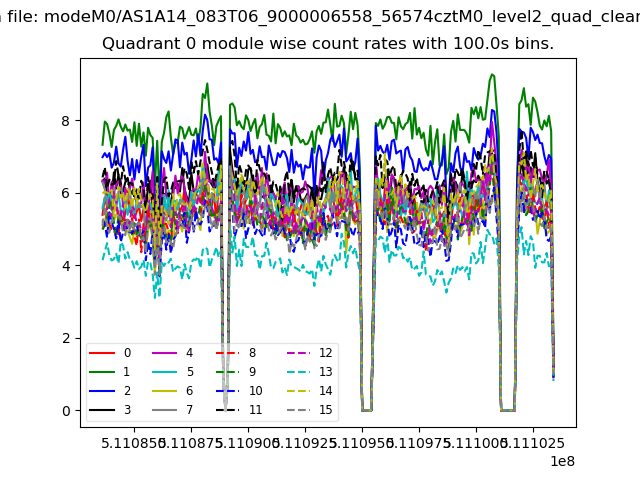 |
 |
| Module-wise count rates for Quadrant B Data is divided into 100 sec bins |
 |
 |
| Module-wise count rates for Quadrant C Data is divided into 100 sec bins |
 |
 |
| Module-wise count rates for Quadrant D Data is divided into 100 sec bins |
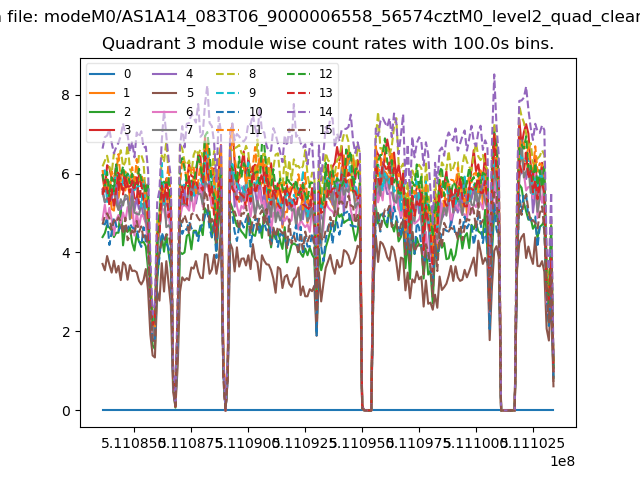 |
 |
| Parameter | Plot |
|---|---|
| CZT HV Monitor | 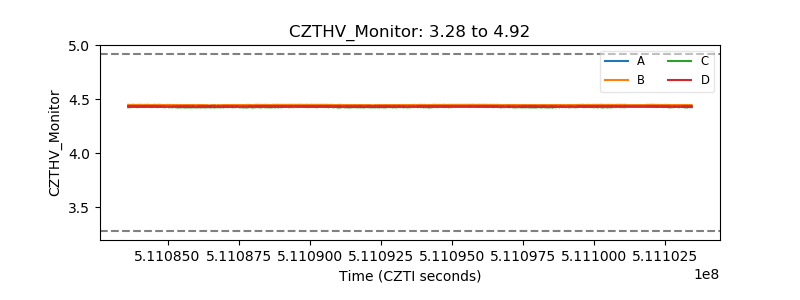 |
| D_VDD | 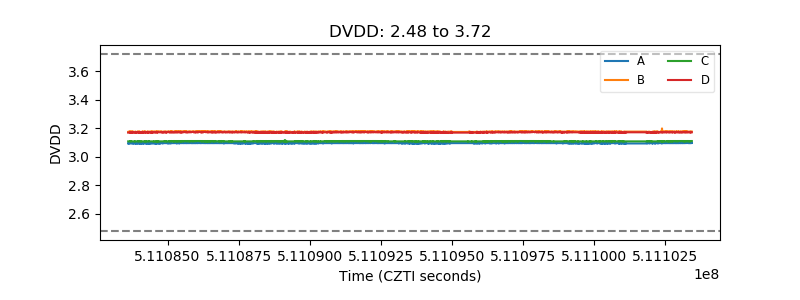 |
| Temperature 1 | 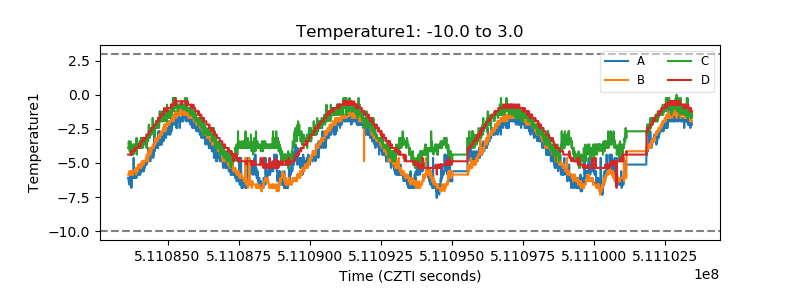 |
| Veto HV Monitor | 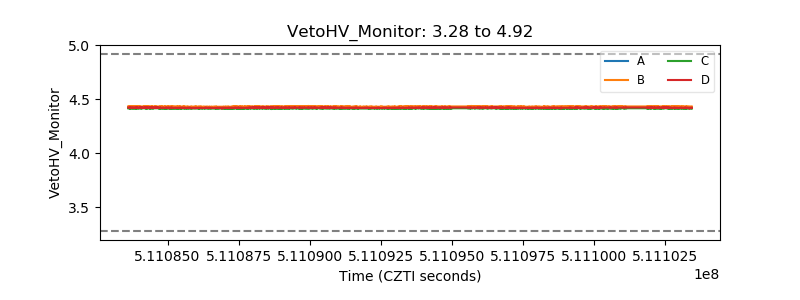 |
| Veto LLD | 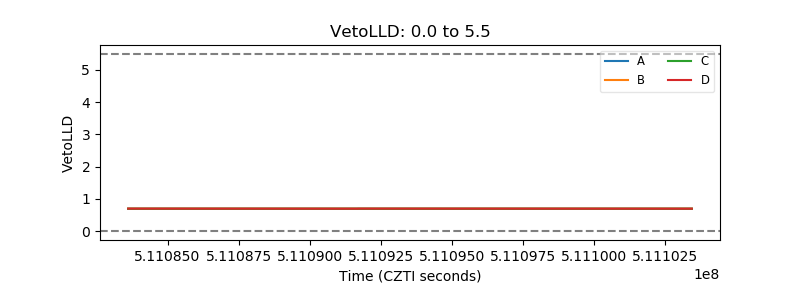 |
| Alpha Counter | 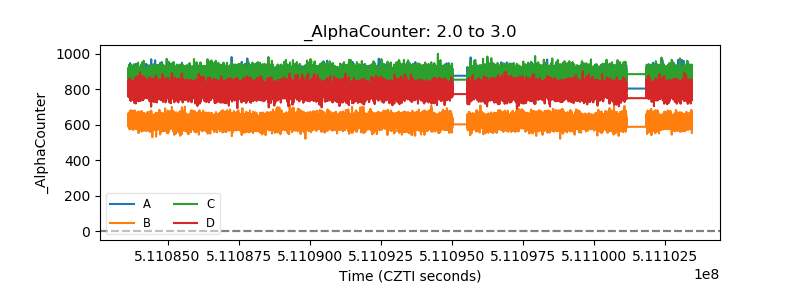 |
| _CPM_Rate | 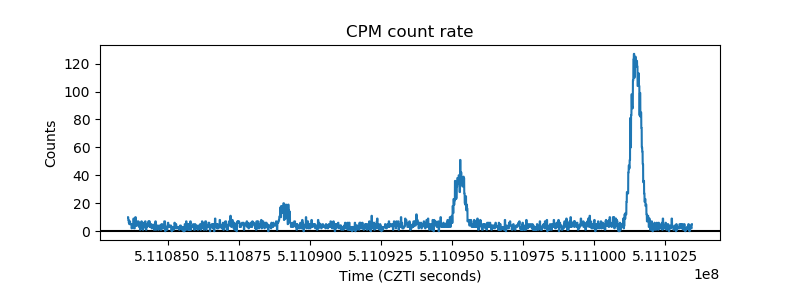 |
| CZT Counter | 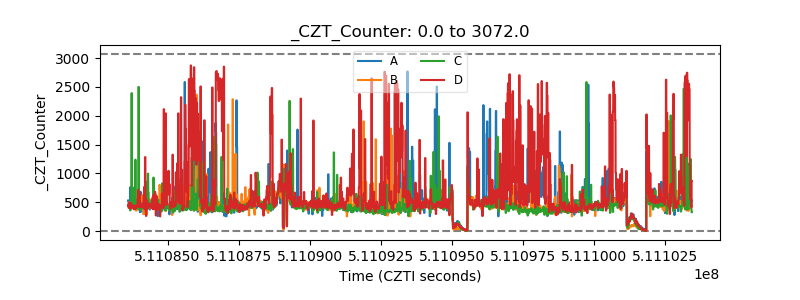 |
| +2.5 Volts monitor |  |
| +5 Volts monitor |  |
| _ROLL_ROT | 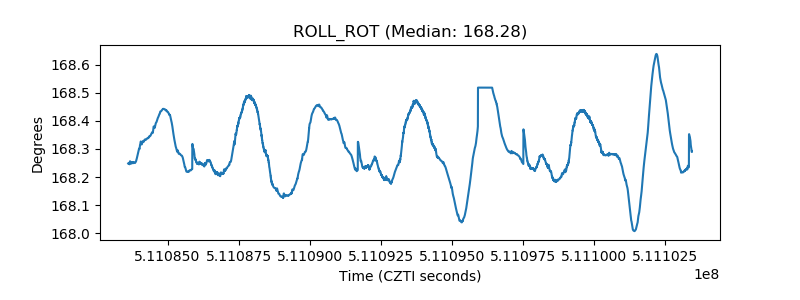 |
| _Roll_DEC | 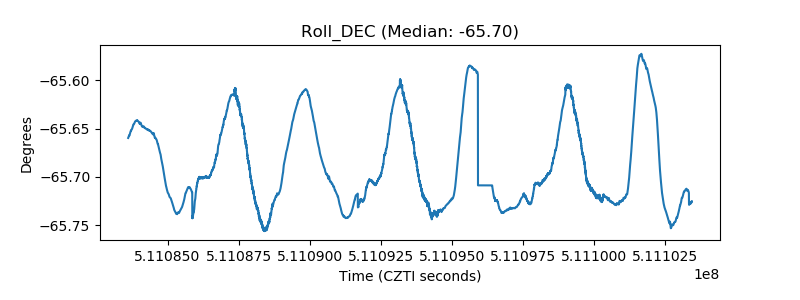 |
| _Roll_RA | 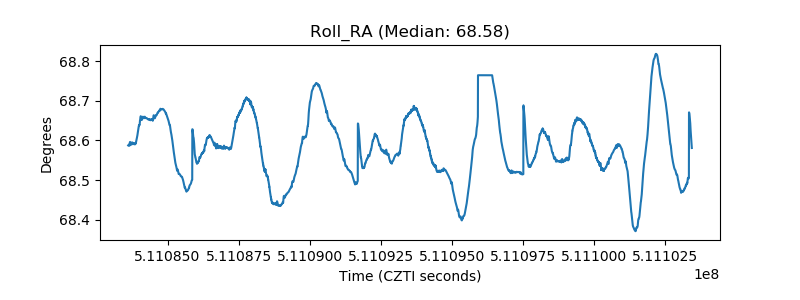 |
| Veto Counter | 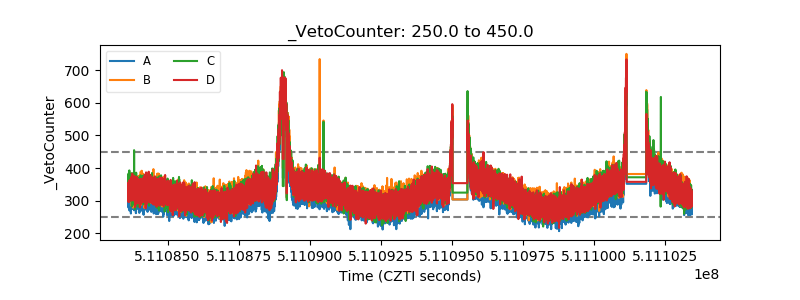 |