| Param | Original file | Final file |
|---|---|---|
| Filename | modeM0/AS1A14_083T06_9000006558_56575cztM0_level2.fits | modeM0/AS1A14_083T06_9000006558_56575cztM0_level2_quad_clean.evt |
| Size (bytes) | 393,079,680 | 86,238,720 |
| Size | 374.9 MB | 82.2 MB |
| Events in quadrant A | 2,997,060 | 567,651 |
| Events in quadrant B | 2,784,906 | 607,261 |
| Events in quadrant C | 3,353,944 | 536,215 |
| Events in quadrant D | 4,946,963 | 480,127 |
| Mode SS | |||
|---|---|---|---|
| Quadrant | BADHDUFLAG | Total packets | Discarded packets |
| A | 0 | 122 | 0 |
| B | 0 | 122 | 0 |
| C | 0 | 122 | 0 |
| D | 0 | 122 | 0 |
| Mode M9 | |||
|---|---|---|---|
| Quadrant | BADHDUFLAG | Total packets | Discarded packets |
| A | 0 | 9 | 0 |
| B | 0 | 9 | 0 |
| C | 0 | 9 | 0 |
| D | 0 | 9 | 0 |
| Mode M0 | |||
|---|---|---|---|
| Quadrant | BADHDUFLAG | Total packets | Discarded packets |
| A | 0 | 13196 | 1 |
| B | 0 | 12745 | 1 |
| C | 0 | 14544 | 1 |
| D | 0 | 18880 | 1 |
| Quadrant | Total seconds | Saturated seconds | Saturation percentage |
|---|---|---|---|
| A | 6011 | 80 | 1.330893% |
| B | 6012 | 67 | 1.114438% |
| C | 6012 | 111 | 1.846307% |
| D | 6012 | 469 | 7.801065% |
Noise dominated data is calculated using 1-second bins in cleaned event files. If a bin has >2000 counts, and if more than 50% of those come from <1% of pixels, then it is considered to be noise-dominated and hence unusable.
| Quadrant | # 1 sec bins | Bins with >0 counts | Bins with >2000 counts | High rate bins dominated by noise | Noise dominated (total time) | Noise dominated (detector-on time) | Marked lightcurve |
|---|---|---|---|---|---|---|---|
| A | 6936 | 6012 | 56 | 56 | 0.81% | 0.93% | 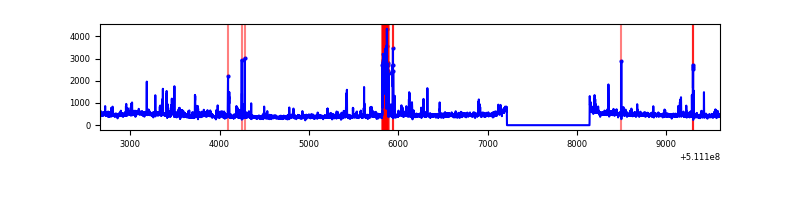 |
| B | 6937 | 6013 | 30 | 30 | 0.43% | 0.50% | 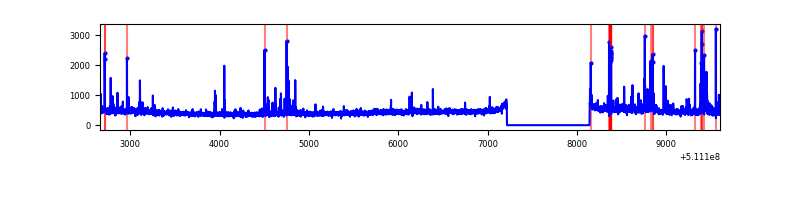 |
| C | 6937 | 6013 | 90 | 90 | 1.30% | 1.50% | 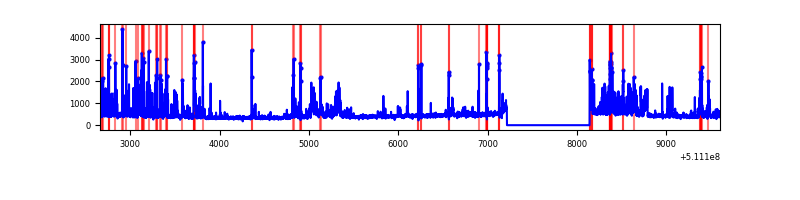 |
| D | 6937 | 6013 | 433 | 433 | 6.24% | 7.20% | 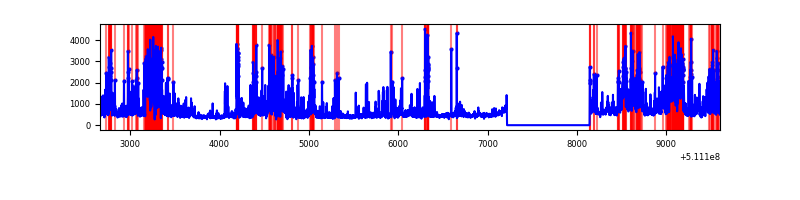 |
Top three noisy pixels from each quadrant. If the there are fewer than three noisy pixels in the level2.evt file, extra rows are filled as -1
| Pixel properties | Quadrant properties | ||||||
|---|---|---|---|---|---|---|---|
| Quadrant | DetID | PixID | Counts | Sigma | Mean | Median | Sigma |
| A | 4 | 249 | 285062 | 1792.21 | 637 | 621 | 158.7 |
| A | 7 | 64 | 94468 | 591.31 | 637 | 621 | 158.7 |
| A | 0 | 12 | 28070 | 172.95 | 637 | 621 | 158.7 |
| B | 0 | 173 | 70218 | 509.36 | 634 | 611 | 136.7 |
| B | 4 | 141 | 37179 | 267.59 | 634 | 611 | 136.7 |
| B | 0 | 245 | 33818 | 243.0 | 634 | 611 | 136.7 |
| C | 6 | 223 | 349868 | 2083.2 | 609 | 603 | 167.7 |
| C | 9 | 38 | 173217 | 1029.56 | 609 | 603 | 167.7 |
| C | 13 | 3 | 169915 | 1009.87 | 609 | 603 | 167.7 |
| D | 8 | 129 | 831344 | 4855.67 | 595 | 567 | 171.1 |
| D | 2 | 249 | 744983 | 4350.91 | 595 | 567 | 171.1 |
| D | 6 | 239 | 474770 | 2771.59 | 595 | 567 | 171.1 |
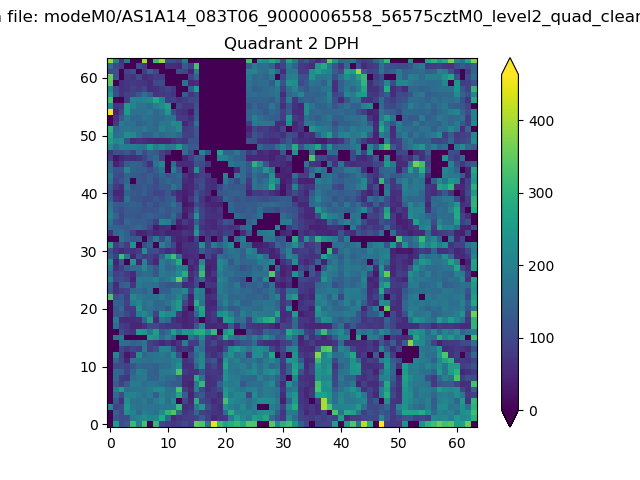
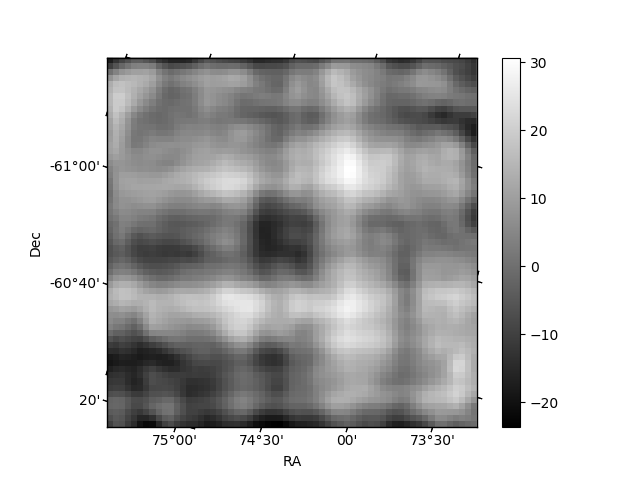
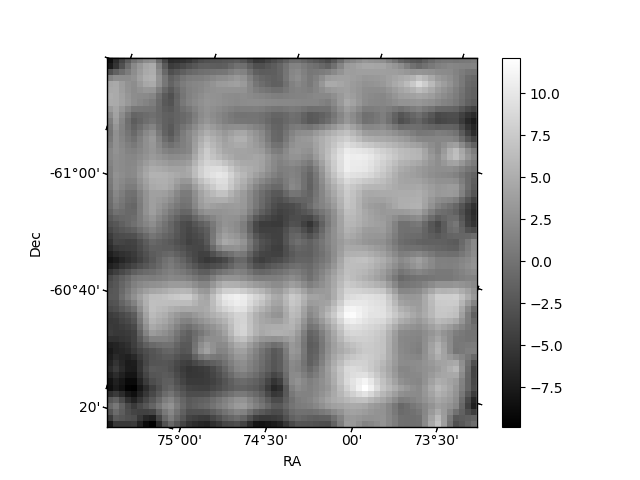
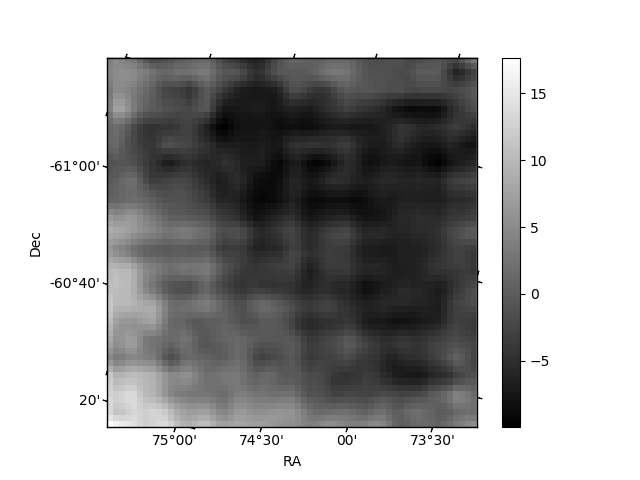
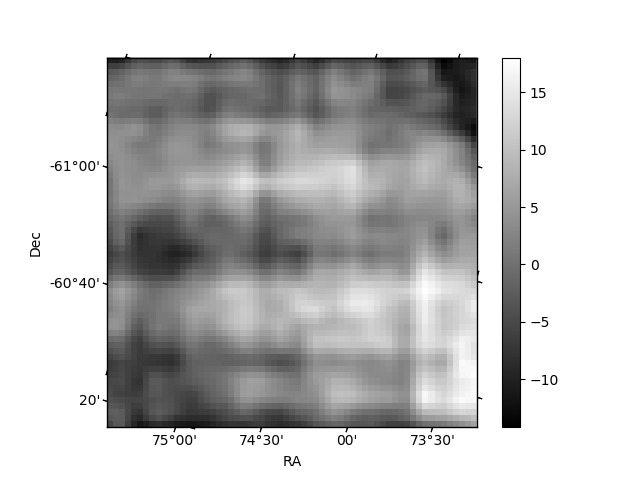
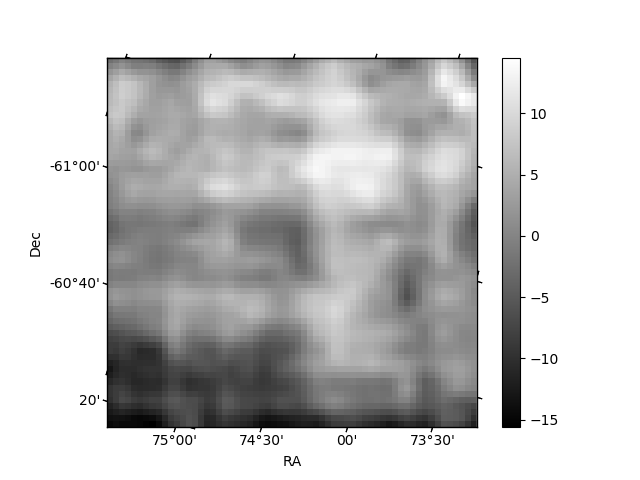
Histogram calculated using DETX and DETY for each event in the final _common_clean file
| Quadrant A | 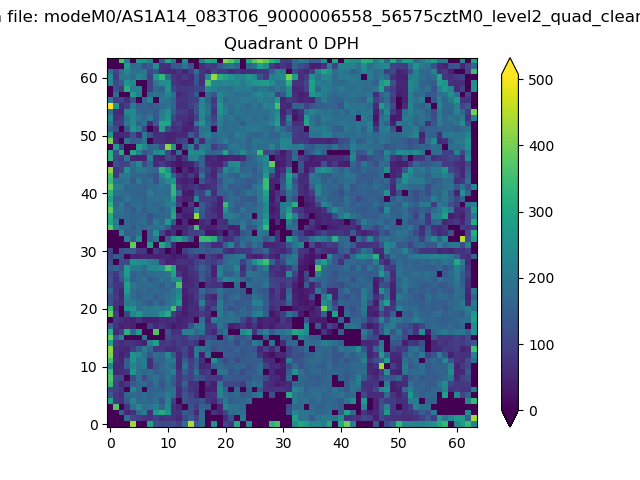 |
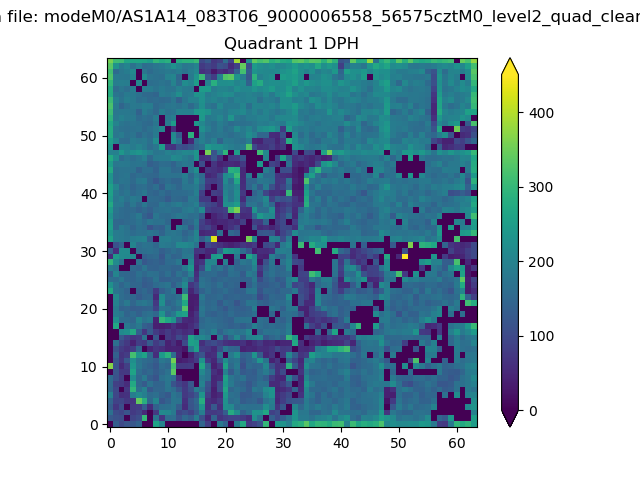 |
Quadrant B |
|---|---|---|---|
| Quadrant D | 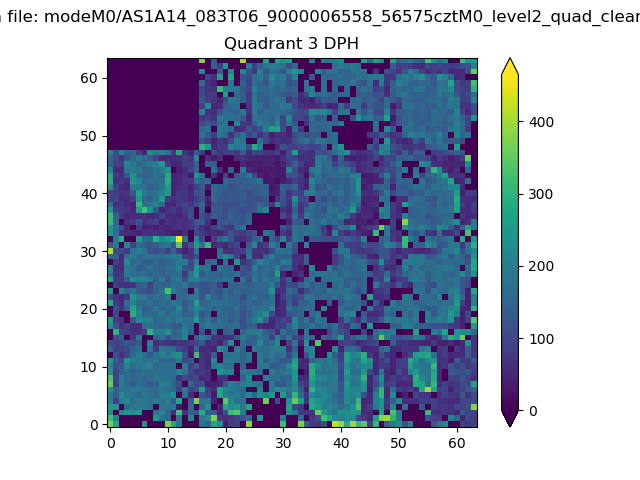 |
 |
Quadrant C |
| Plot type | Count rate plots | Images |
|---|---|---|
| Comparison with Poisson distribution Blue bars denote a histogram of data divided into 1 sec bins. Red curve is a Poisson curve with rate = median count rate of data. |
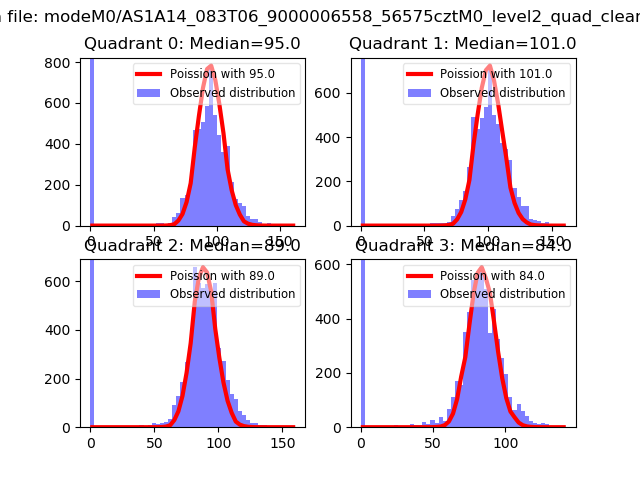 |
 |
| Quadrant-wise count rates Data is divided into 100 sec bins |
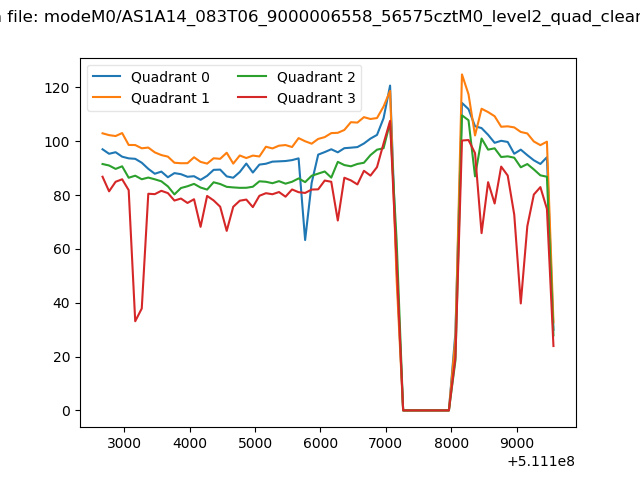 |
|
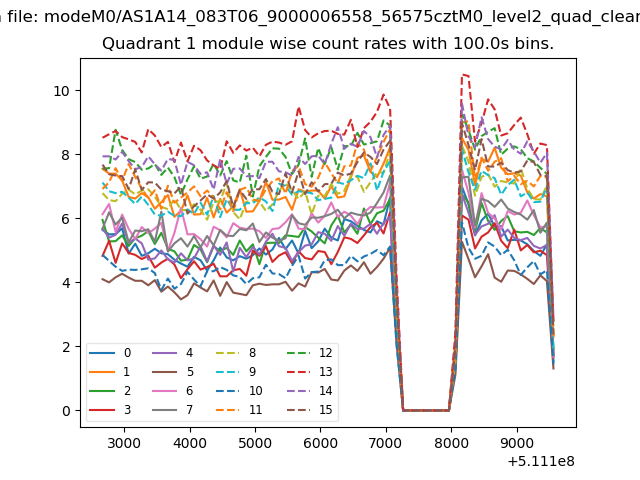
| Module-wise count rates for Quadrant A Data is divided into 100 sec bins |
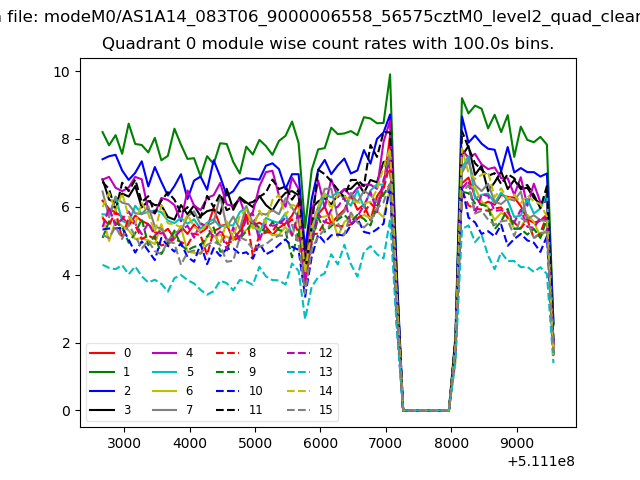 |
 |
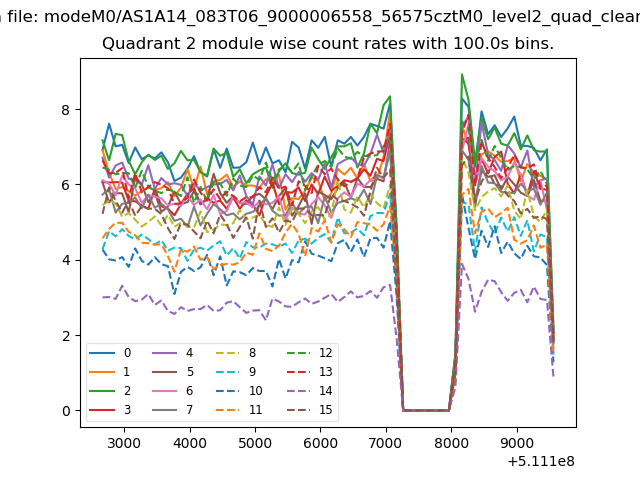
| Module-wise count rates for Quadrant B Data is divided into 100 sec bins |
 |
 |
| Module-wise count rates for Quadrant C Data is divided into 100 sec bins |
 |
 |
| Module-wise count rates for Quadrant D Data is divided into 100 sec bins |
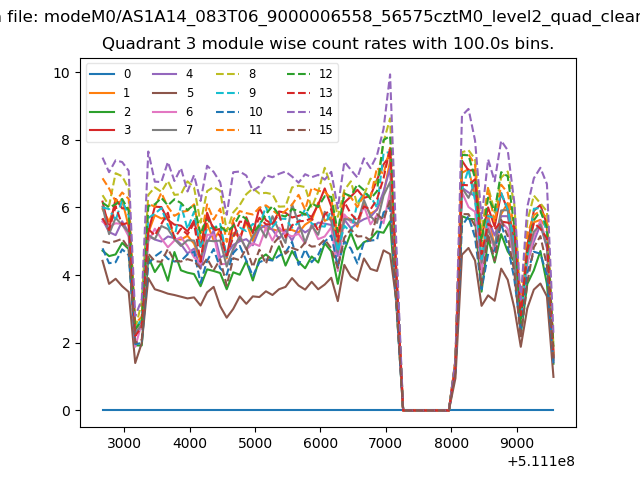 |
 |
| Parameter | Plot |
|---|---|
| CZT HV Monitor | 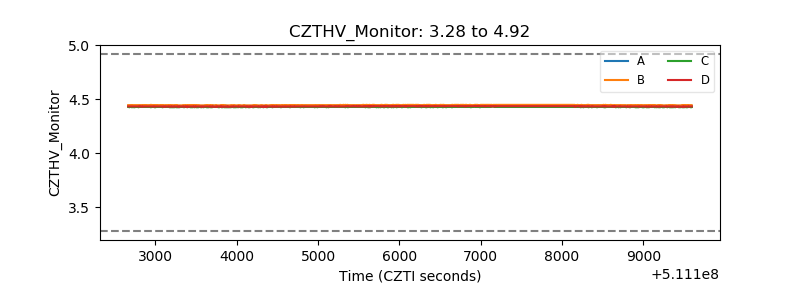 |
| D_VDD | 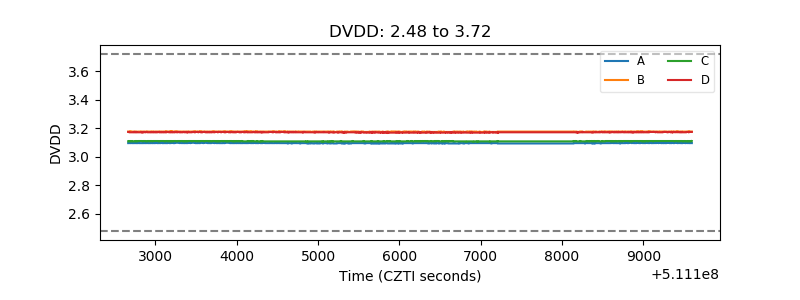 |
| Temperature 1 | 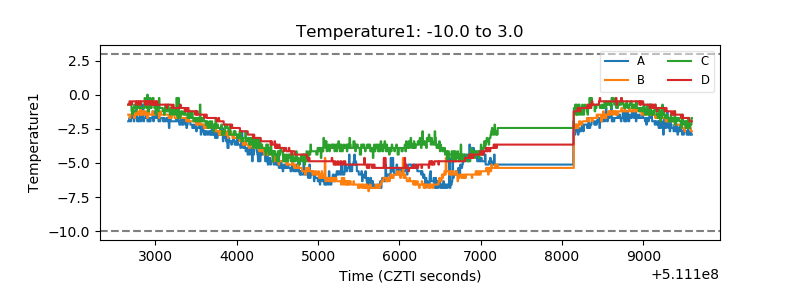 |
| Veto HV Monitor | 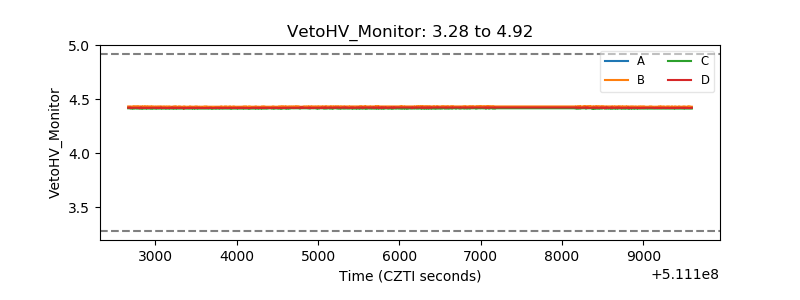 |
| Veto LLD | 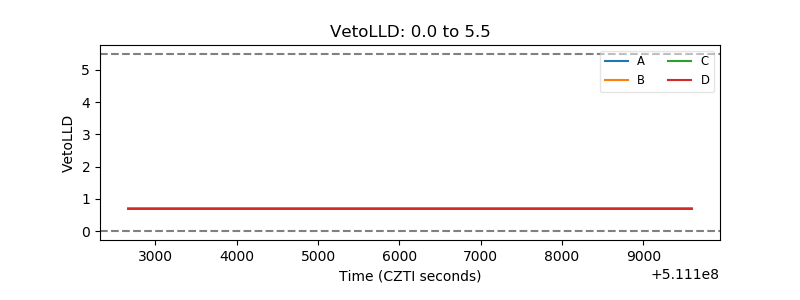 |
| Alpha Counter | 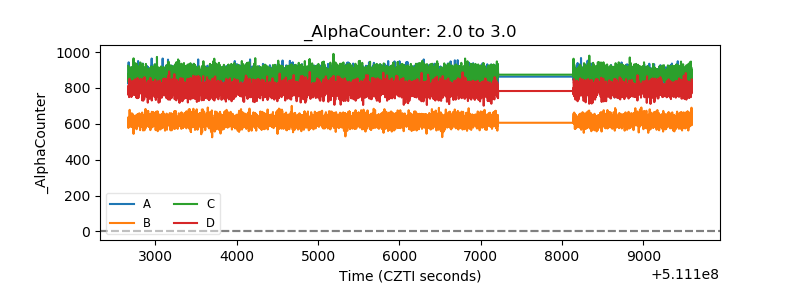 |
| _CPM_Rate | 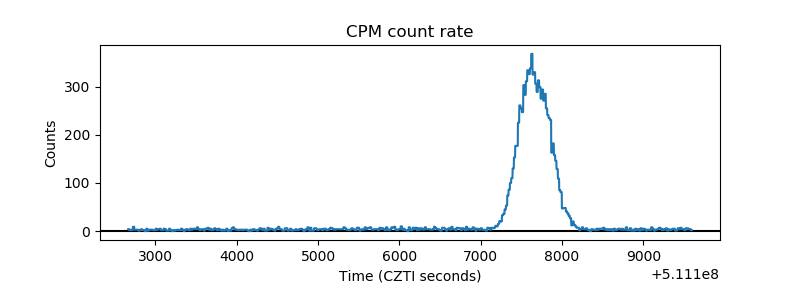 |
| CZT Counter | 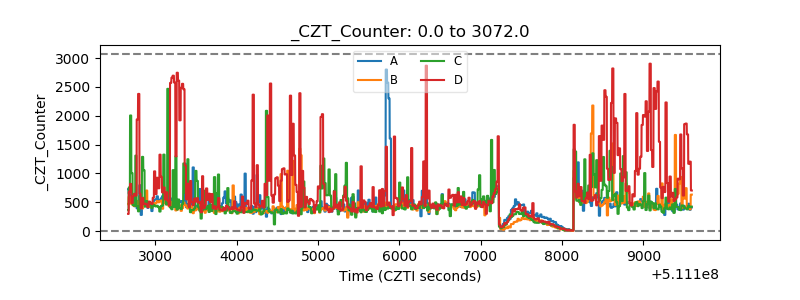 |
| +2.5 Volts monitor |  |
| +5 Volts monitor |  |
| _ROLL_ROT | 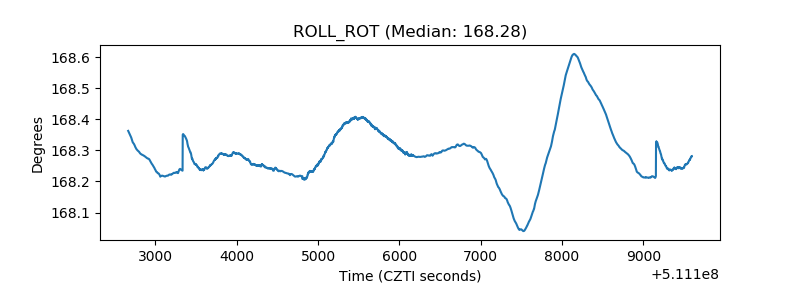 |
| _Roll_DEC | 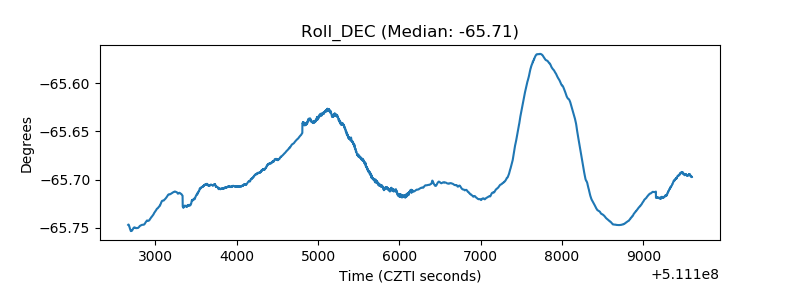 |
| _Roll_RA | 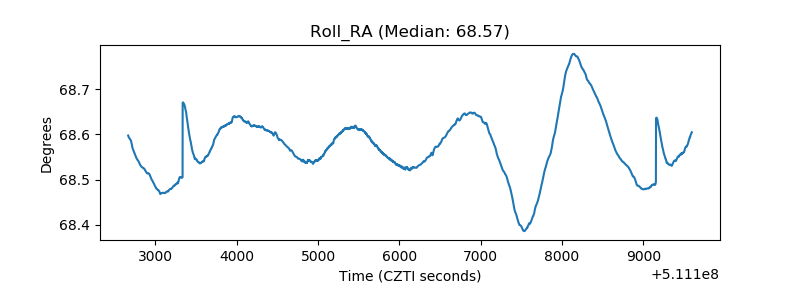 |
| Veto Counter | 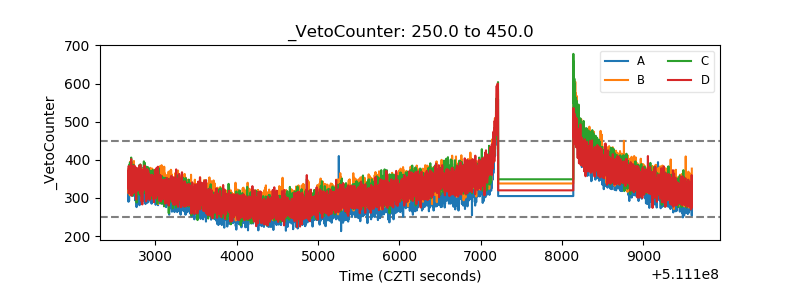 |