| Param | Original file | Final file |
|---|---|---|
| Filename | modeM0/AS1A14_083T06_9000006558_56577cztM0_level2.fits | modeM0/AS1A14_083T06_9000006558_56577cztM0_level2_quad_clean.evt |
| Size (bytes) | 457,375,680 | 91,768,320 |
| Size | 436.2 MB | 87.5 MB |
| Events in quadrant A | 3,088,090 | 614,023 |
| Events in quadrant B | 3,182,632 | 658,316 |
| Events in quadrant C | 3,166,579 | 581,848 |
| Events in quadrant D | 6,997,377 | 478,976 |
| Mode SS | |||
|---|---|---|---|
| Quadrant | BADHDUFLAG | Total packets | Discarded packets |
| A | 0 | 130 | 0 |
| B | 0 | 130 | 0 |
| C | 0 | 130 | 0 |
| D | 0 | 130 | 0 |
| Mode M9 | |||
|---|---|---|---|
| Quadrant | BADHDUFLAG | Total packets | Discarded packets |
| A | 0 | 11 | 0 |
| B | 0 | 11 | 0 |
| C | 0 | 11 | 0 |
| D | 0 | 11 | 0 |
| Mode M0 | |||
|---|---|---|---|
| Quadrant | BADHDUFLAG | Total packets | Discarded packets |
| A | 0 | 13744 | 1 |
| B | 0 | 14097 | 1 |
| C | 0 | 14364 | 1 |
| D | 0 | 25173 | 1 |
| Quadrant | Total seconds | Saturated seconds | Saturation percentage |
|---|---|---|---|
| A | 6379 | 64 | 1.003292% |
| B | 6380 | 98 | 1.536050% |
| C | 6380 | 52 | 0.815047% |
| D | 6379 | 930 | 14.579088% |
Noise dominated data is calculated using 1-second bins in cleaned event files. If a bin has >2000 counts, and if more than 50% of those come from <1% of pixels, then it is considered to be noise-dominated and hence unusable.
| Quadrant | # 1 sec bins | Bins with >0 counts | Bins with >2000 counts | High rate bins dominated by noise | Noise dominated (total time) | Noise dominated (detector-on time) | Marked lightcurve |
|---|---|---|---|---|---|---|---|
| A | 7434 | 6380 | 32 | 32 | 0.43% | 0.50% | 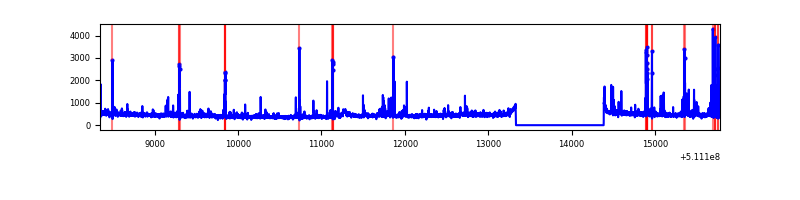 |
| B | 7435 | 6381 | 58 | 58 | 0.78% | 0.91% | 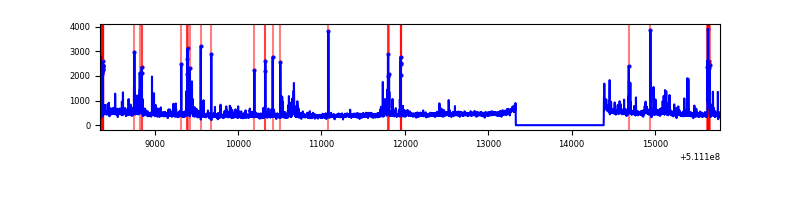 |
| C | 7435 | 6381 | 58 | 58 | 0.78% | 0.91% | 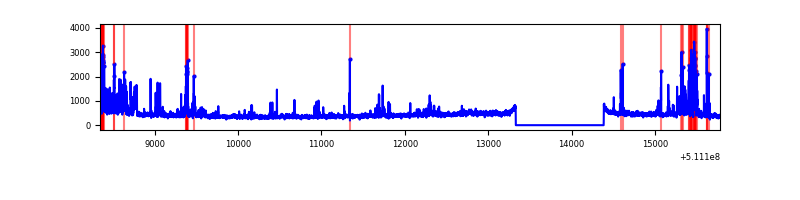 |
| D | 7434 | 6380 | 906 | 906 | 12.19% | 14.20% | 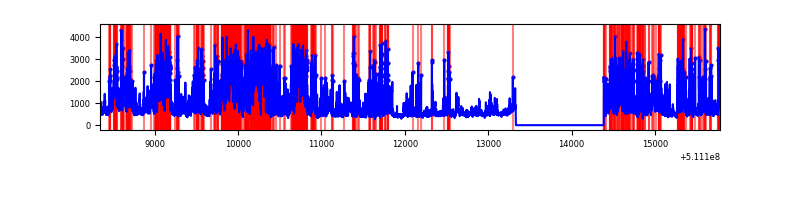 |
Top three noisy pixels from each quadrant. If the there are fewer than three noisy pixels in the level2.evt file, extra rows are filled as -1
| Pixel properties | Quadrant properties | ||||||
|---|---|---|---|---|---|---|---|
| Quadrant | DetID | PixID | Counts | Sigma | Mean | Median | Sigma |
| A | 0 | 8 | 106892 | 625.95 | 686 | 670 | 169.7 |
| A | 4 | 249 | 105266 | 616.37 | 686 | 670 | 169.7 |
| A | 3 | 62 | 48510 | 281.91 | 686 | 670 | 169.7 |
| B | 0 | 173 | 126423 | 866.61 | 679 | 655 | 145.1 |
| B | 4 | 141 | 61628 | 420.14 | 679 | 655 | 145.1 |
| B | 4 | 206 | 59647 | 406.49 | 679 | 655 | 145.1 |
| C | 15 | 230 | 201045 | 1109.28 | 656 | 651 | 180.7 |
| C | 13 | 3 | 137500 | 757.53 | 656 | 651 | 180.7 |
| C | 9 | 38 | 108010 | 594.29 | 656 | 651 | 180.7 |
| D | 8 | 129 | 1433180 | 8047.59 | 622 | 593 | 178.0 |
| D | 8 | 240 | 1244548 | 6987.95 | 622 | 593 | 178.0 |
| D | 6 | 239 | 666590 | 3741.25 | 622 | 593 | 178.0 |
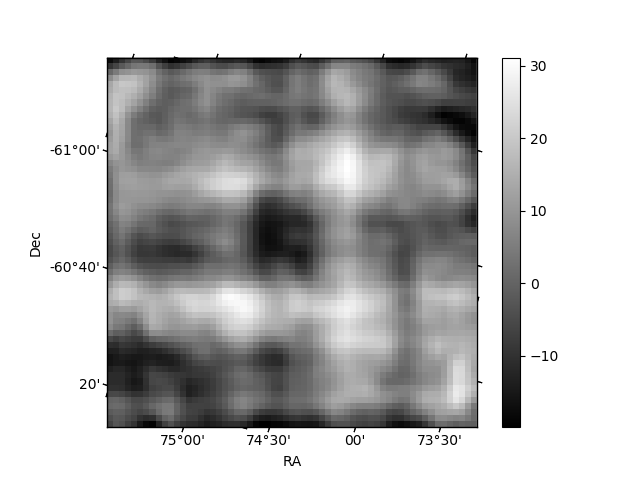
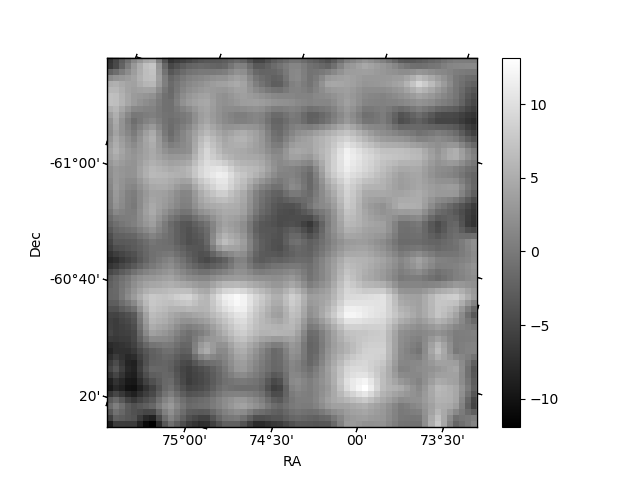
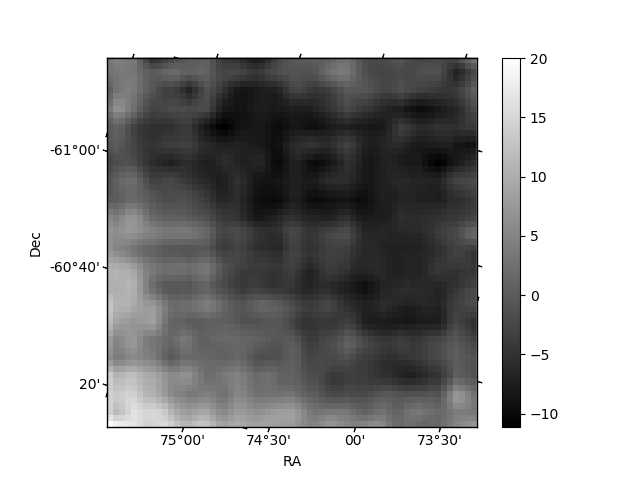
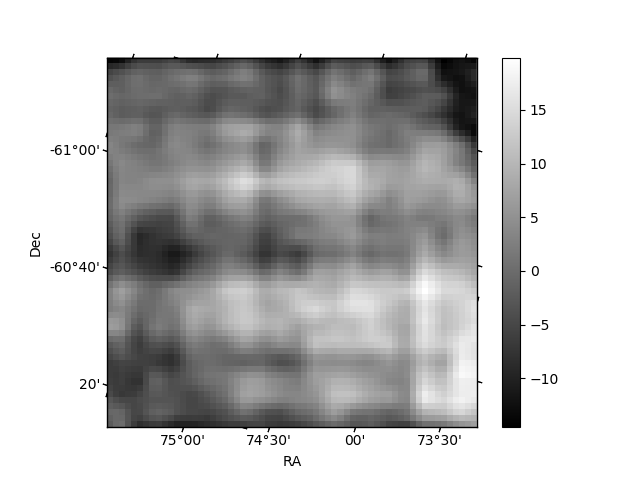
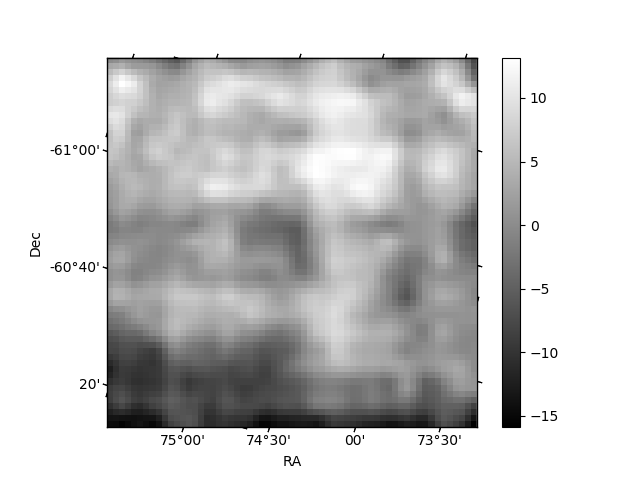
Histogram calculated using DETX and DETY for each event in the final _common_clean file
| Quadrant A | 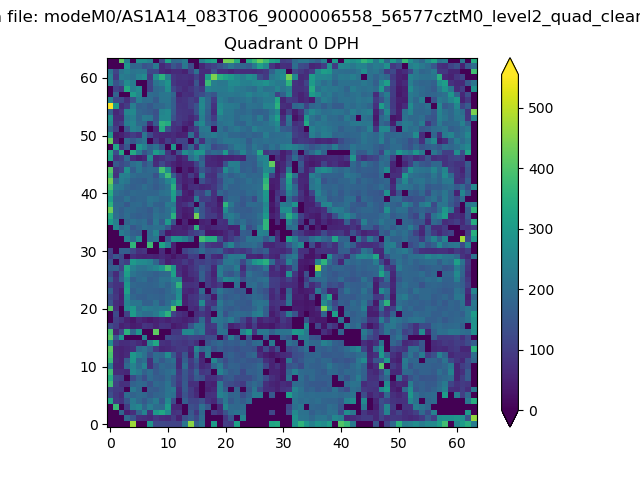 |
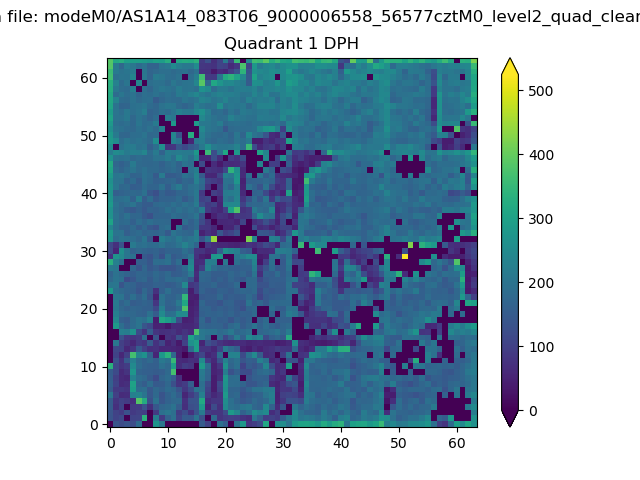 |
Quadrant B |
|---|---|---|---|
| Quadrant D | 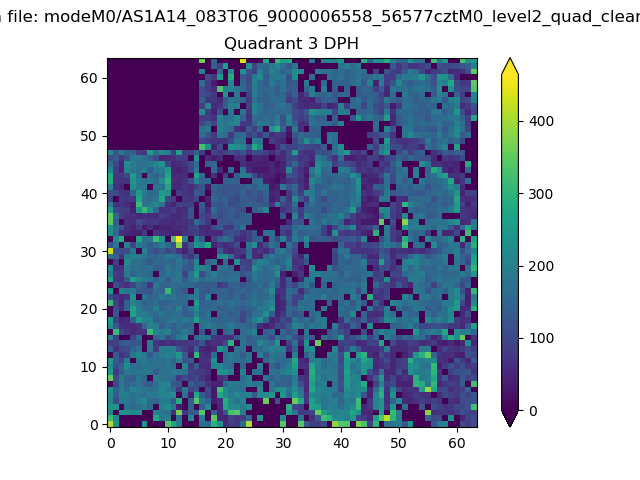 |
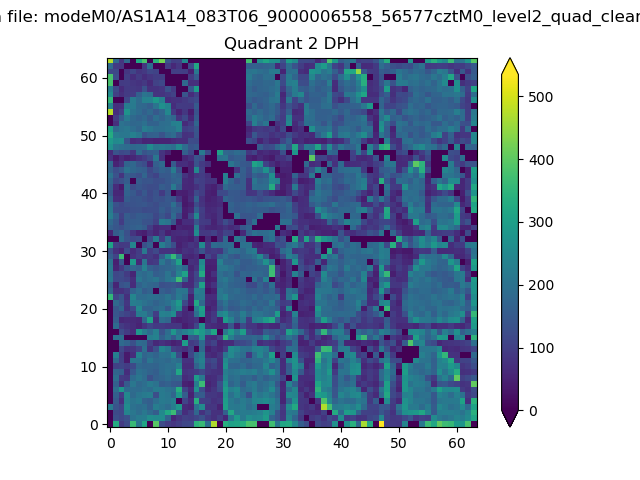 |
Quadrant C |
| Plot type | Count rate plots | Images |
|---|---|---|
| Comparison with Poisson distribution Blue bars denote a histogram of data divided into 1 sec bins. Red curve is a Poisson curve with rate = median count rate of data. |
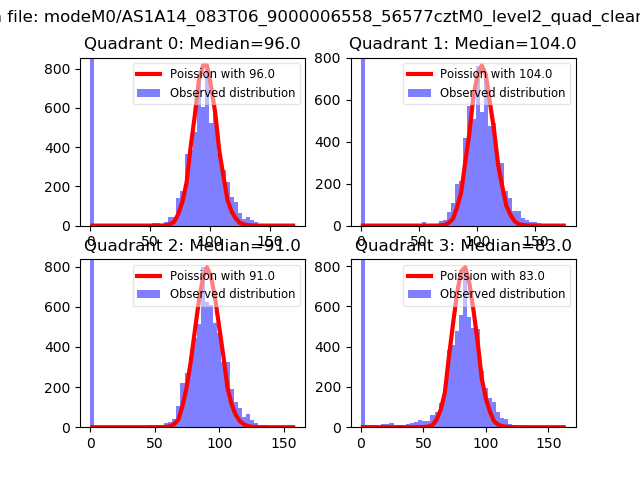 |
 |
| Quadrant-wise count rates Data is divided into 100 sec bins |
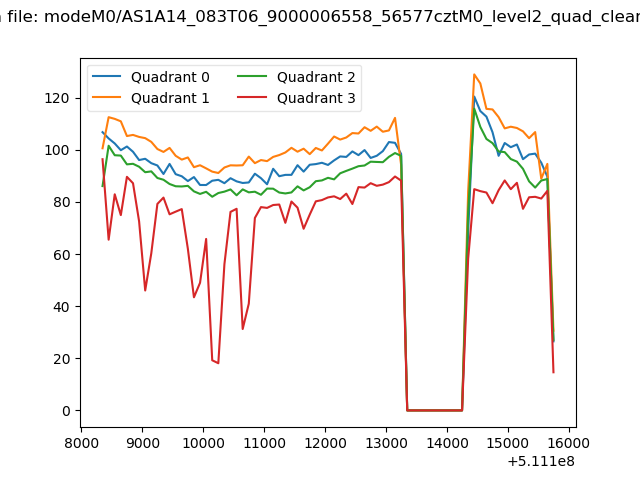 |
|
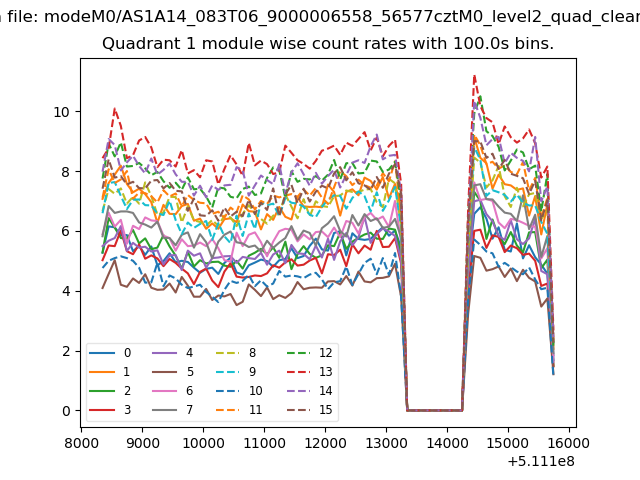
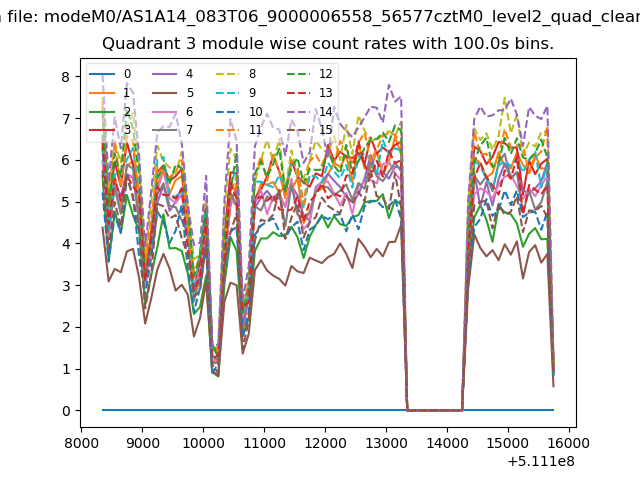
| Module-wise count rates for Quadrant A Data is divided into 100 sec bins |
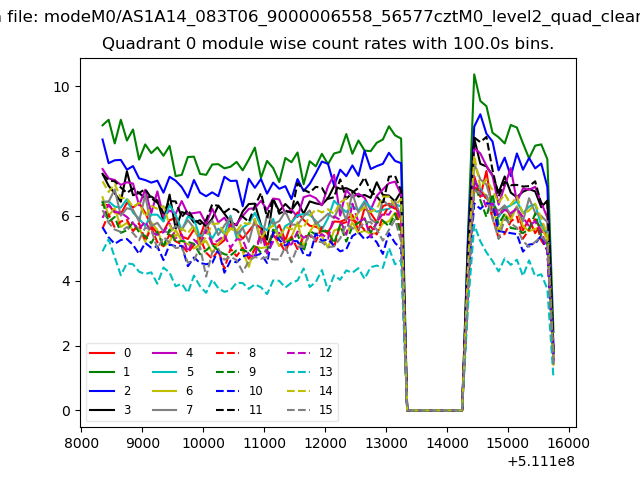 |
 |
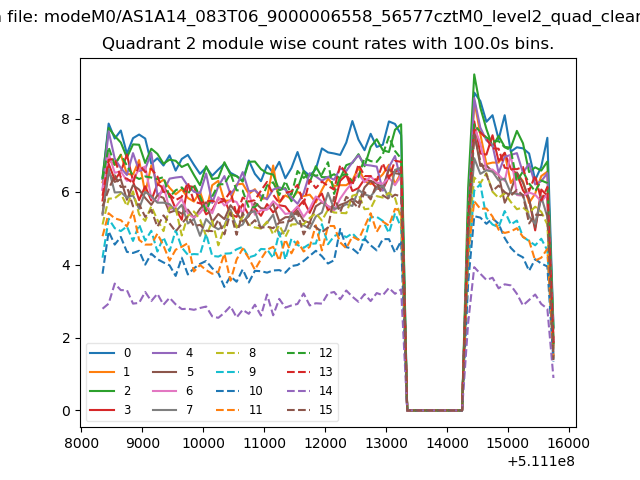
| Module-wise count rates for Quadrant B Data is divided into 100 sec bins |
 |
 |
| Module-wise count rates for Quadrant C Data is divided into 100 sec bins |
 |
 |
| Module-wise count rates for Quadrant D Data is divided into 100 sec bins |
 |
 |
| Parameter | Plot |
|---|---|
| CZT HV Monitor | 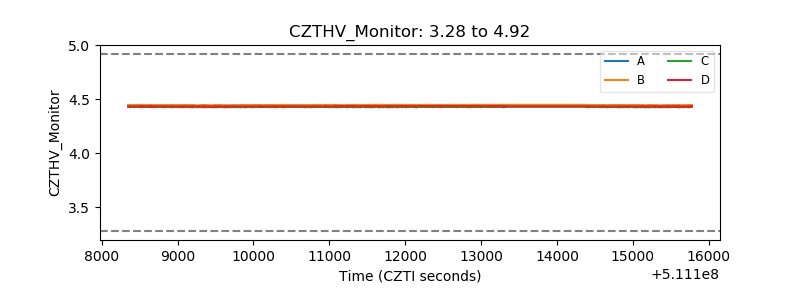 |
| D_VDD | 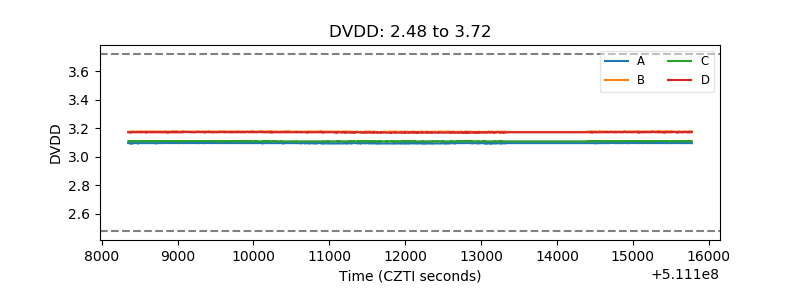 |
| Temperature 1 | 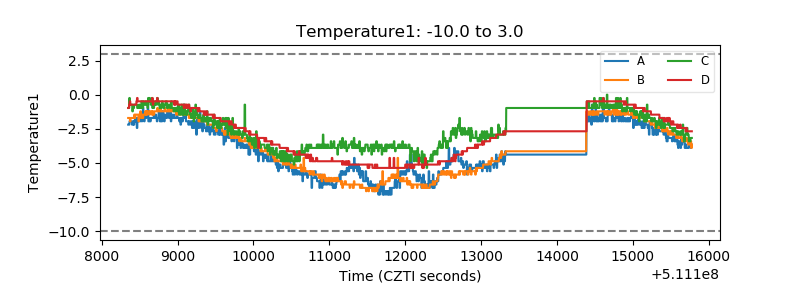 |
| Veto HV Monitor | 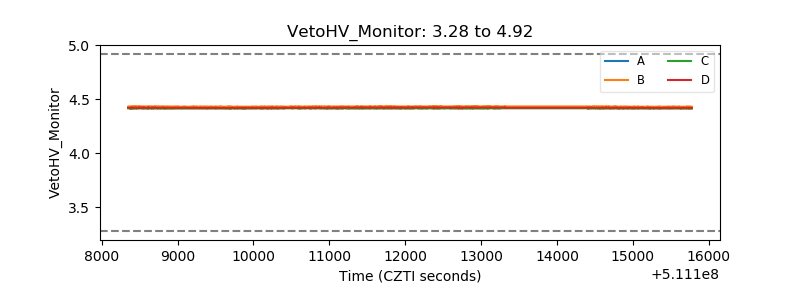 |
| Veto LLD | 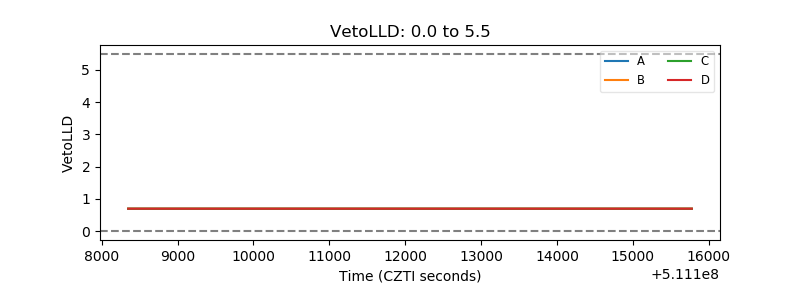 |
| Alpha Counter | 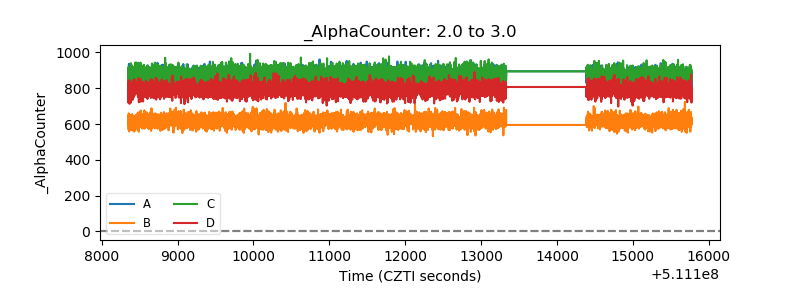 |
| _CPM_Rate | 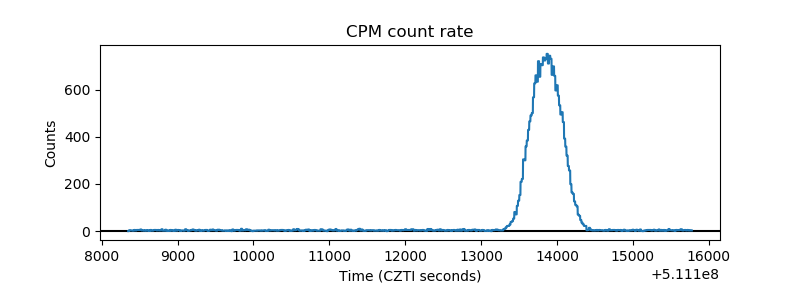 |
| CZT Counter | 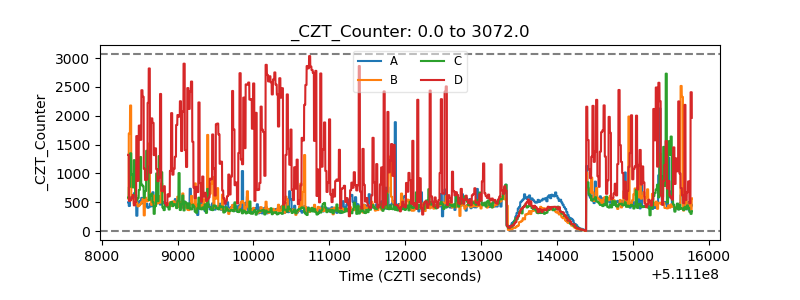 |
| +2.5 Volts monitor |  |
| +5 Volts monitor |  |
| _ROLL_ROT | 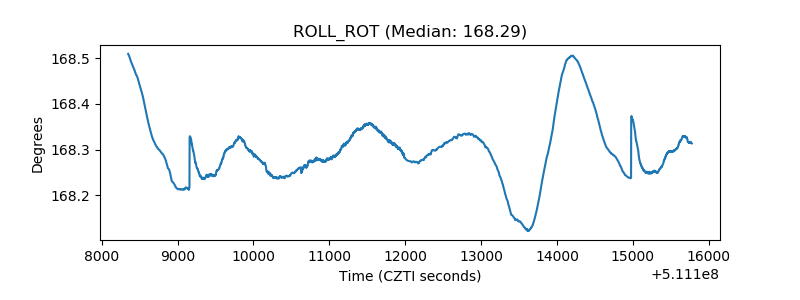 |
| _Roll_DEC | 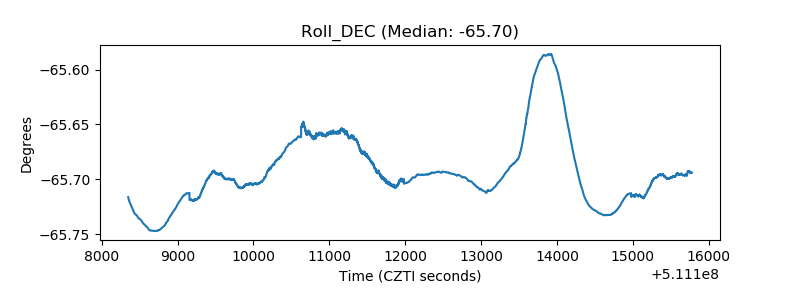 |
| _Roll_RA | 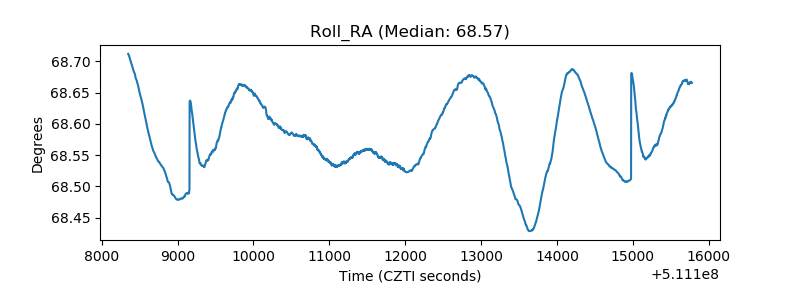 |
| Veto Counter | 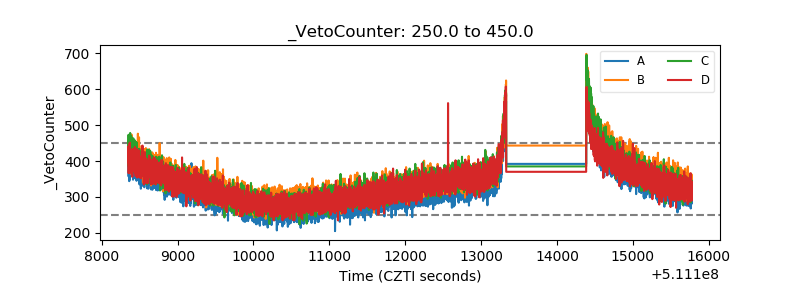 |