| Param | Original file | Final file |
|---|---|---|
| Filename | modeM0/AS1A14_083T06_9000006558_56578cztM0_level2.fits | modeM0/AS1A14_083T06_9000006558_56578cztM0_level2_quad_clean.evt |
| Size (bytes) | 441,662,400 | 89,020,800 |
| Size | 421.2 MB | 84.9 MB |
| Events in quadrant A | 3,333,797 | 593,804 |
| Events in quadrant B | 2,991,467 | 639,069 |
| Events in quadrant C | 3,429,848 | 556,486 |
| Events in quadrant D | 6,120,114 | 480,042 |
| Mode SS | |||
|---|---|---|---|
| Quadrant | BADHDUFLAG | Total packets | Discarded packets |
| A | 0 | 126 | 0 |
| B | 0 | 126 | 0 |
| C | 0 | 126 | 0 |
| D | 0 | 126 | 0 |
| Mode M9 | |||
|---|---|---|---|
| Quadrant | BADHDUFLAG | Total packets | Discarded packets |
| A | 0 | 11 | 0 |
| B | 0 | 11 | 0 |
| C | 0 | 11 | 0 |
| D | 0 | 11 | 0 |
| Mode M0 | |||
|---|---|---|---|
| Quadrant | BADHDUFLAG | Total packets | Discarded packets |
| A | 0 | 14352 | 1 |
| B | 0 | 13317 | 1 |
| C | 0 | 14761 | 1 |
| D | 0 | 22346 | 4 |
| Quadrant | Total seconds | Saturated seconds | Saturation percentage |
|---|---|---|---|
| A | 6093 | 96 | 1.575579% |
| B | 6093 | 95 | 1.559166% |
| C | 6094 | 122 | 2.001969% |
| D | 6093 | 746 | 12.243558% |
Noise dominated data is calculated using 1-second bins in cleaned event files. If a bin has >2000 counts, and if more than 50% of those come from <1% of pixels, then it is considered to be noise-dominated and hence unusable.
| Quadrant | # 1 sec bins | Bins with >0 counts | Bins with >2000 counts | High rate bins dominated by noise | Noise dominated (total time) | Noise dominated (detector-on time) | Marked lightcurve |
|---|---|---|---|---|---|---|---|
| A | 7243 | 6094 | 49 | 49 | 0.68% | 0.80% | 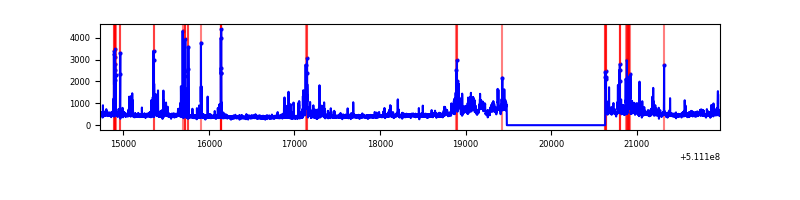 |
| B | 7243 | 6094 | 51 | 51 | 0.70% | 0.84% | 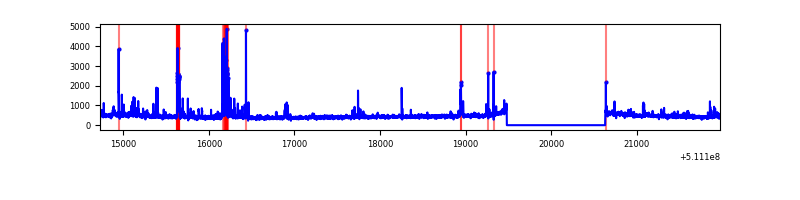 |
| C | 7244 | 6095 | 139 | 139 | 1.92% | 2.28% | 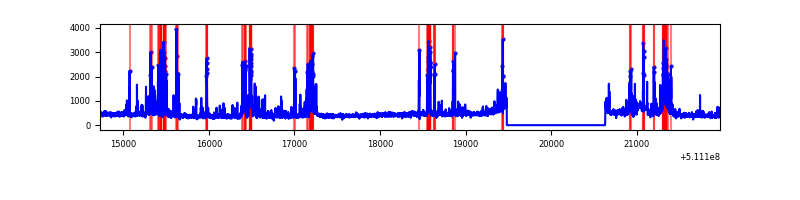 |
| D | 7243 | 6094 | 729 | 729 | 10.06% | 11.96% | 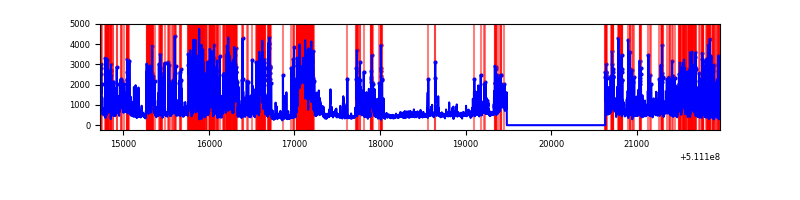 |
Top three noisy pixels from each quadrant. If the there are fewer than three noisy pixels in the level2.evt file, extra rows are filled as -1
| Pixel properties | Quadrant properties | ||||||
|---|---|---|---|---|---|---|---|
| Quadrant | DetID | PixID | Counts | Sigma | Mean | Median | Sigma |
| A | 4 | 95 | 220861 | 1364.3 | 653 | 637 | 161.4 |
| A | 0 | 8 | 164856 | 1017.35 | 653 | 637 | 161.4 |
| A | 4 | 249 | 97081 | 597.48 | 653 | 637 | 161.4 |
| B | 0 | 173 | 139849 | 1007.91 | 650 | 629 | 138.1 |
| B | 8 | 128 | 51748 | 370.08 | 650 | 629 | 138.1 |
| B | 4 | 171 | 48285 | 345.01 | 650 | 629 | 138.1 |
| C | 15 | 230 | 474987 | 2763.2 | 624 | 618 | 171.7 |
| C | 12 | 252 | 285002 | 1656.54 | 624 | 618 | 171.7 |
| C | 6 | 223 | 84499 | 488.61 | 624 | 618 | 171.7 |
| D | 8 | 129 | 1440519 | 8504.61 | 591 | 564 | 169.3 |
| D | 6 | 239 | 1391392 | 8214.46 | 591 | 564 | 169.3 |
| D | 14 | 52 | 243075 | 1432.31 | 591 | 564 | 169.3 |
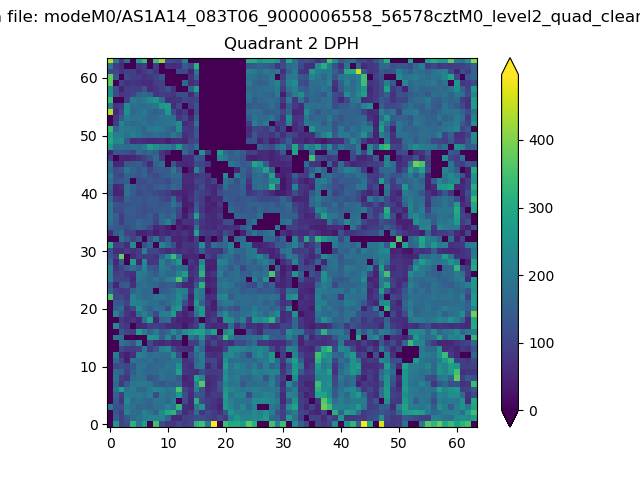
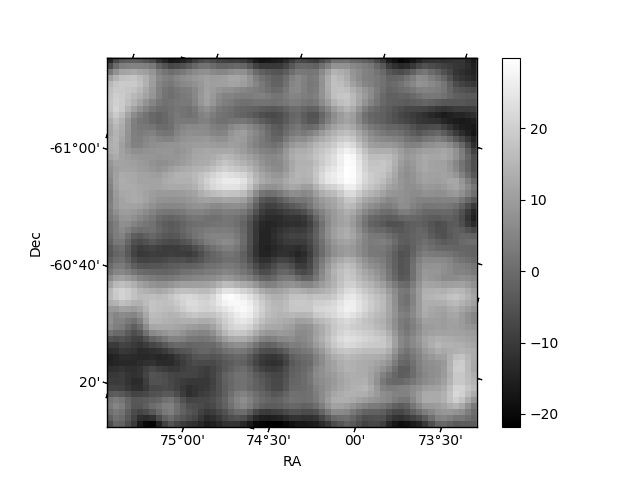
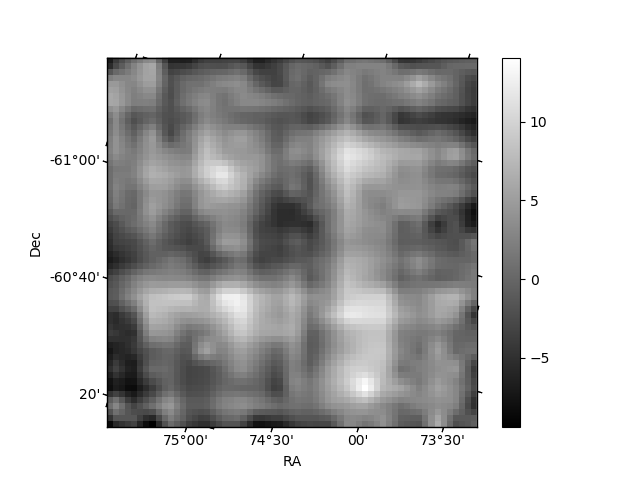
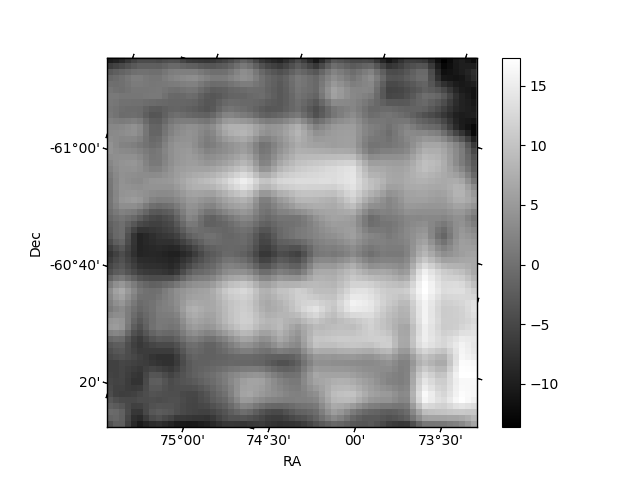
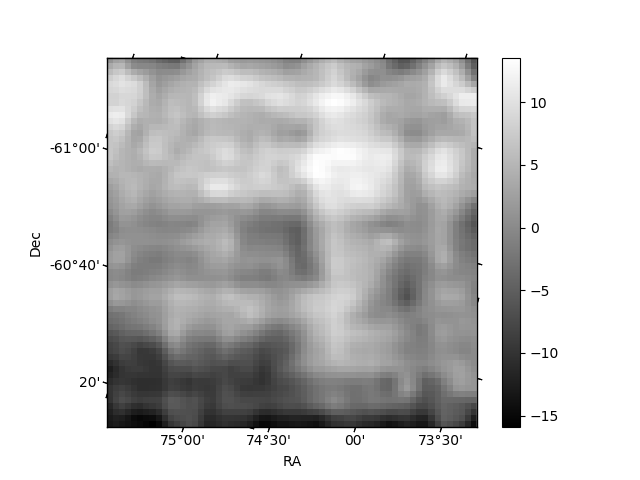
Histogram calculated using DETX and DETY for each event in the final _common_clean file
| Quadrant A | 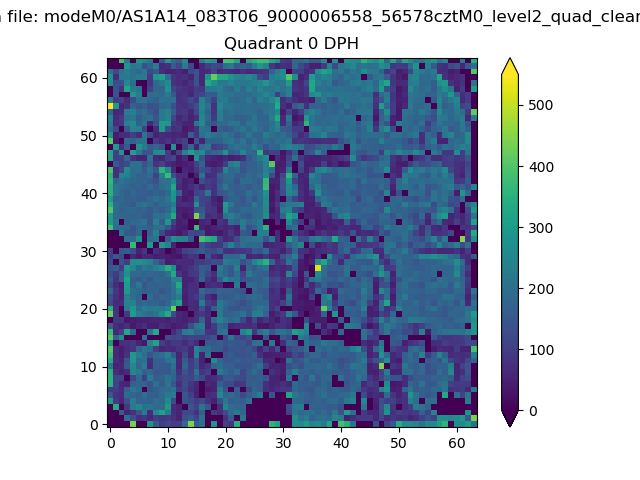 |
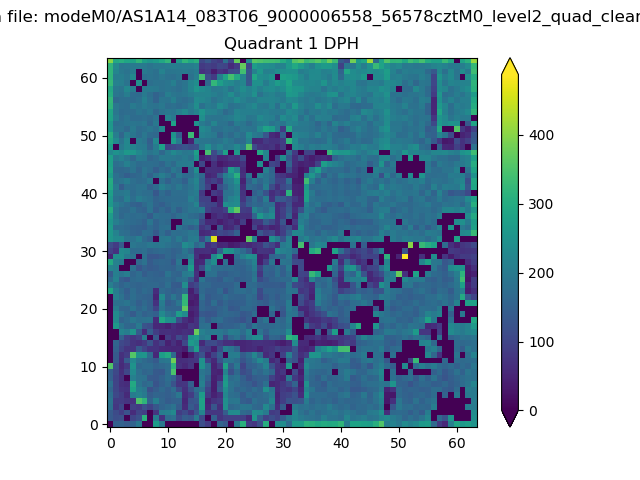 |
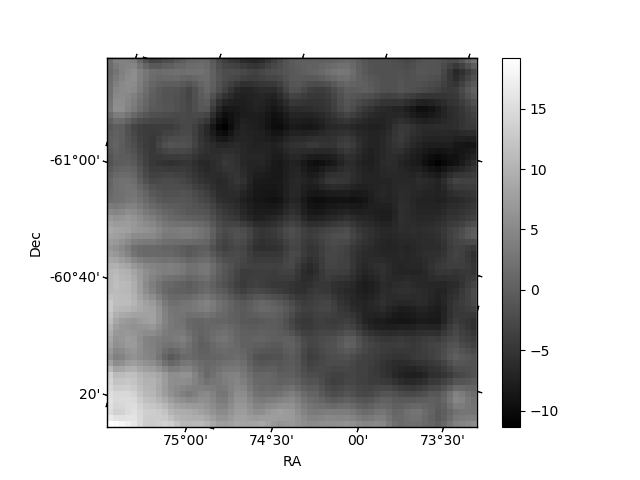
Quadrant B |
|---|---|---|---|
| Quadrant D | 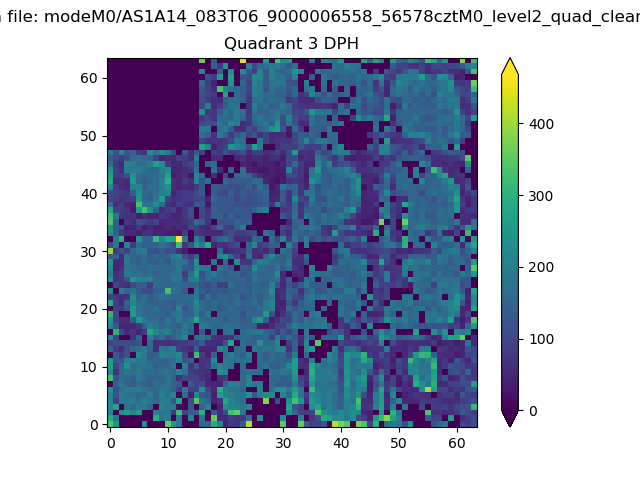 |
 |
Quadrant C |
| Plot type | Count rate plots | Images |
|---|---|---|
| Comparison with Poisson distribution Blue bars denote a histogram of data divided into 1 sec bins. Red curve is a Poisson curve with rate = median count rate of data. |
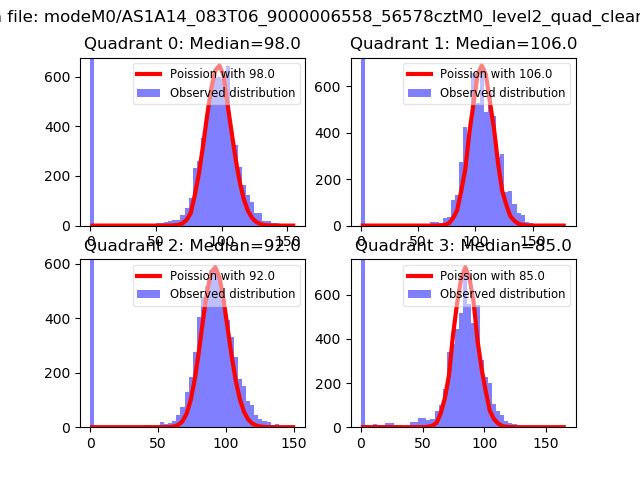 |
 |
| Quadrant-wise count rates Data is divided into 100 sec bins |
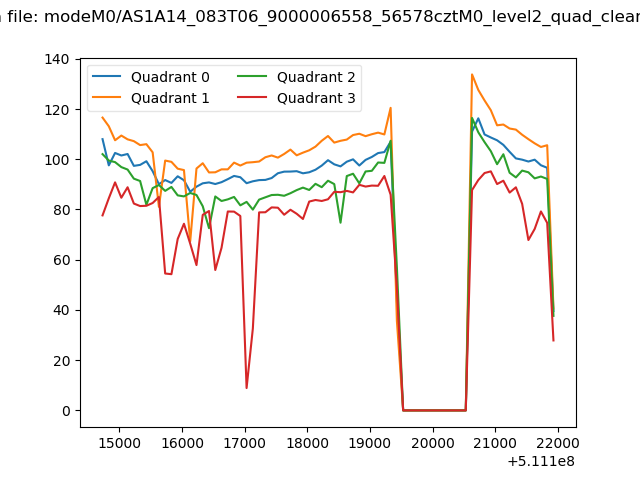 |
|
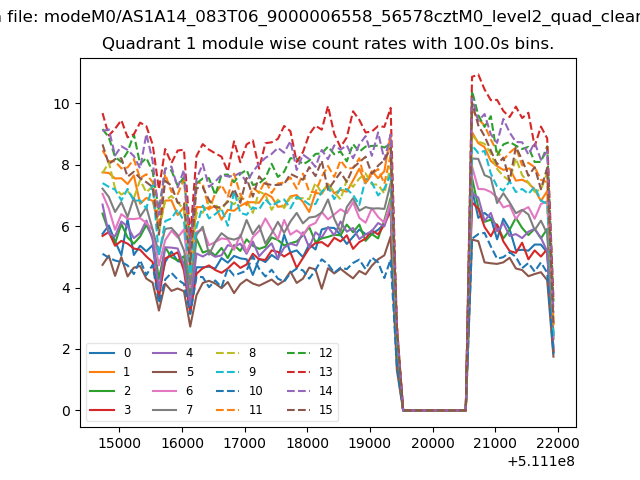
| Module-wise count rates for Quadrant A Data is divided into 100 sec bins |
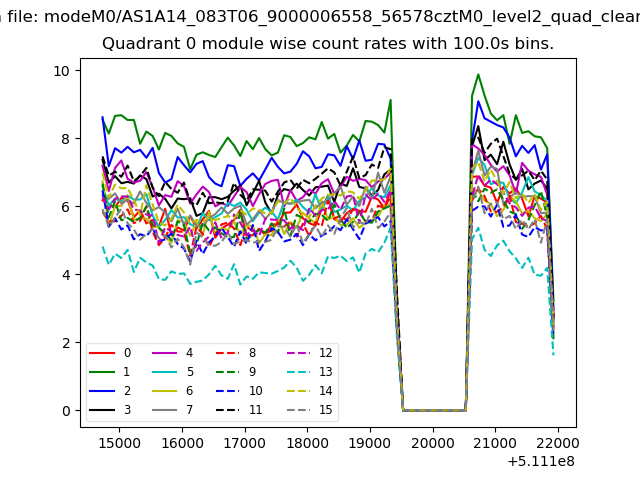 |
 |
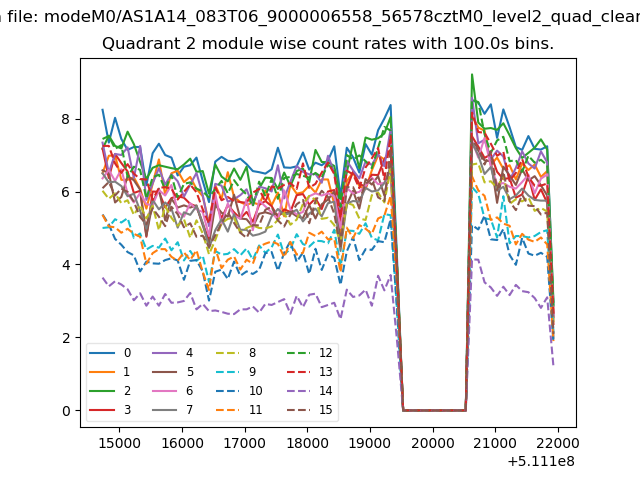
| Module-wise count rates for Quadrant B Data is divided into 100 sec bins |
 |
 |
| Module-wise count rates for Quadrant C Data is divided into 100 sec bins |
 |
 |
| Module-wise count rates for Quadrant D Data is divided into 100 sec bins |
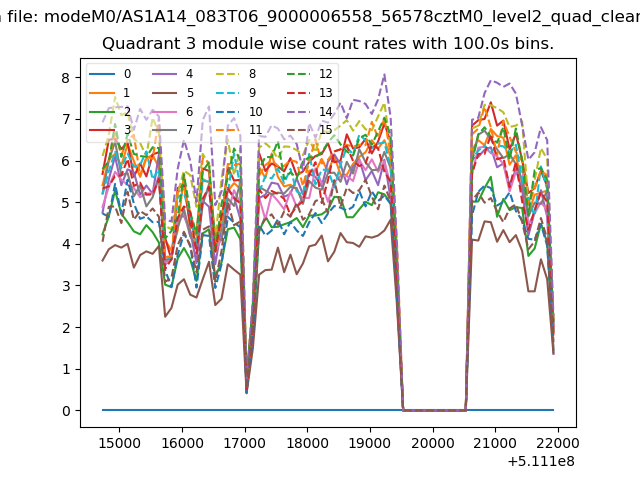 |
 |
| Parameter | Plot |
|---|---|
| CZT HV Monitor | 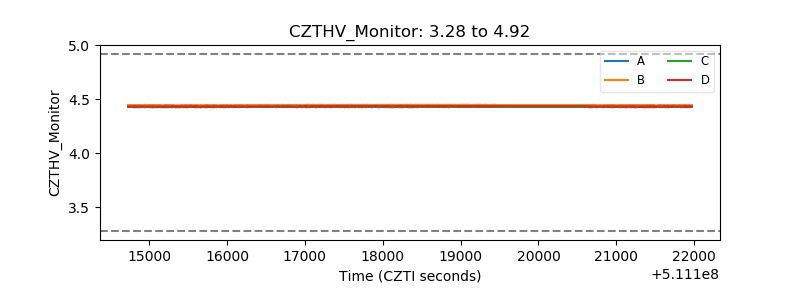 |
| D_VDD | 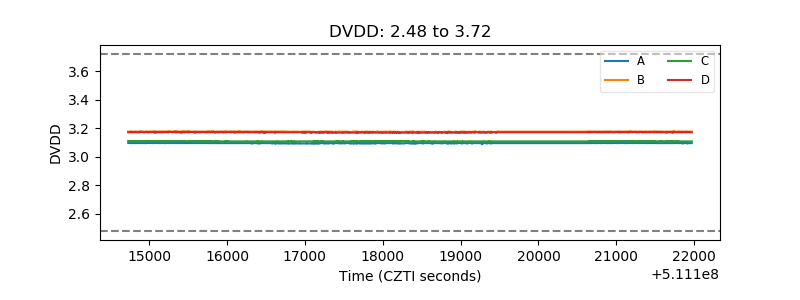 |
| Temperature 1 | 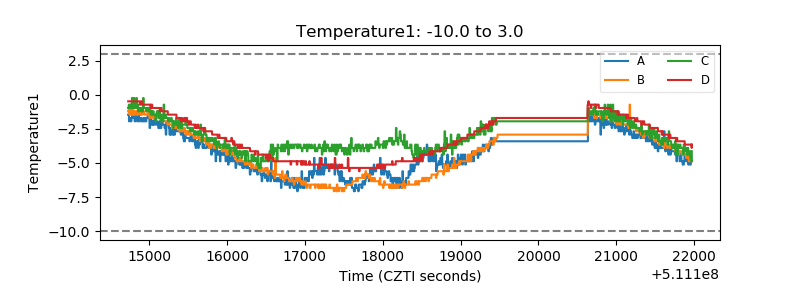 |
| Veto HV Monitor |  |
| Veto LLD | 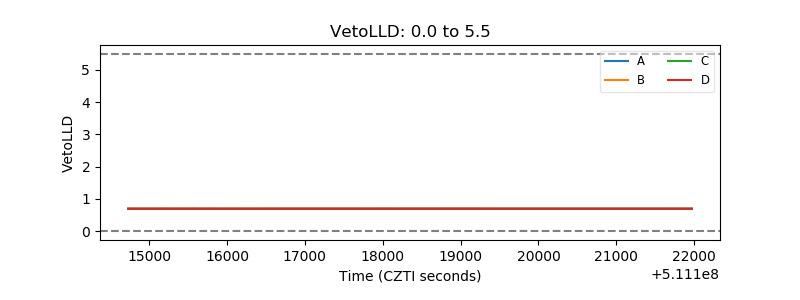 |
| Alpha Counter | 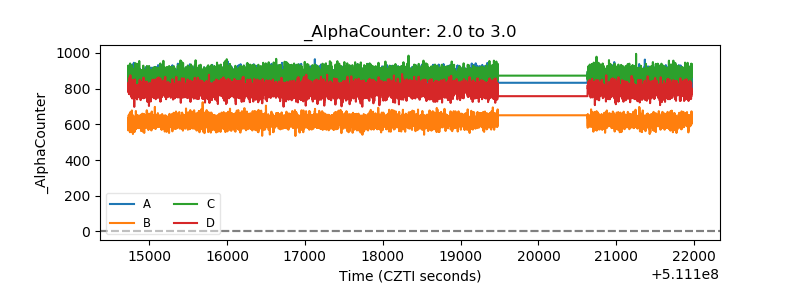 |
| _CPM_Rate | 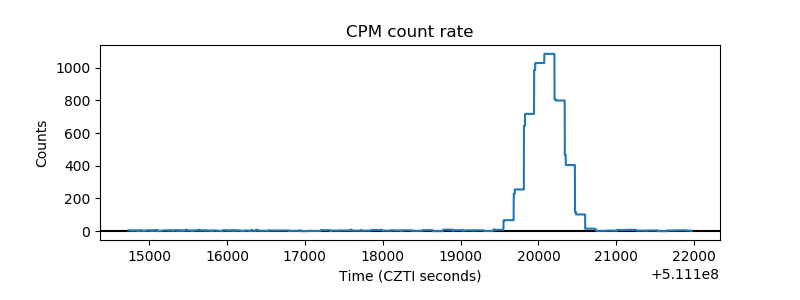 |
| CZT Counter | 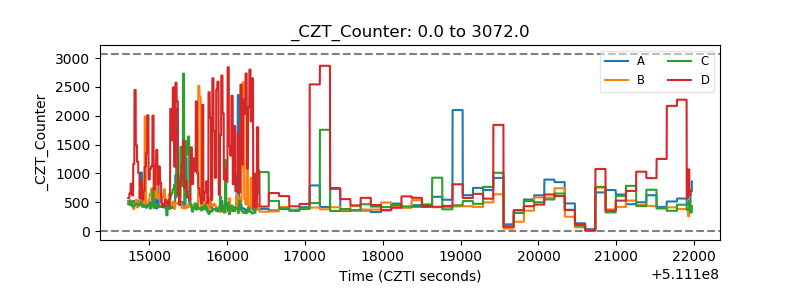 |
| +2.5 Volts monitor |  |
| +5 Volts monitor |  |
| _ROLL_ROT | 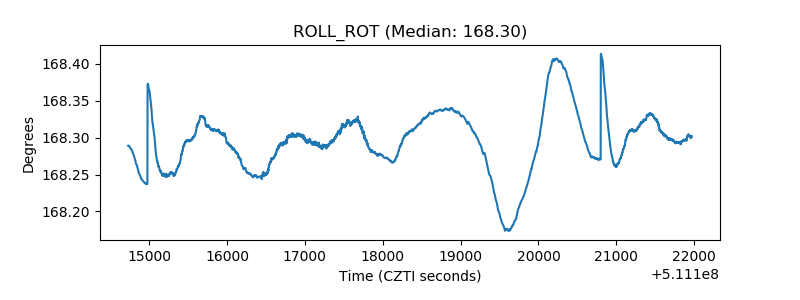 |
| _Roll_DEC | 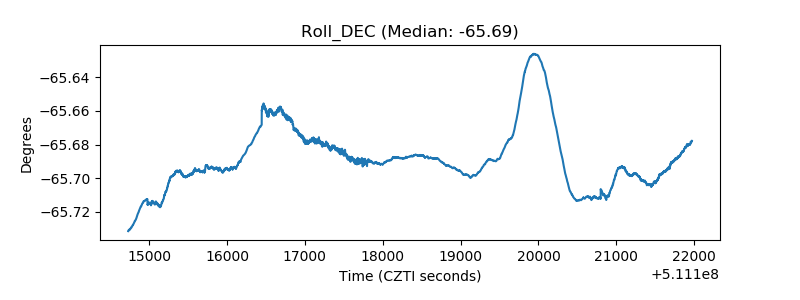 |
| _Roll_RA | 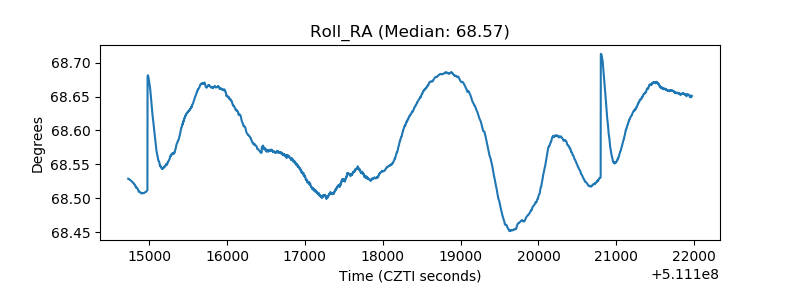 |
| Veto Counter | 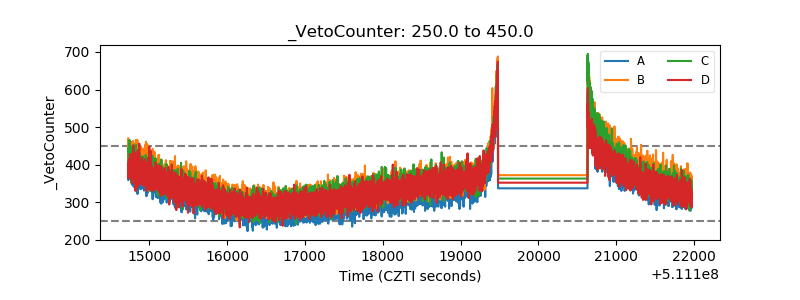 |