| Param | Original file | Final file |
|---|---|---|
| Filename | modeM0/AS1A14_083T06_9000006558_56580cztM0_level2.fits | modeM0/AS1A14_083T06_9000006558_56580cztM0_level2_quad_clean.evt |
| Size (bytes) | 475,346,880 | 90,768,960 |
| Size | 453.3 MB | 86.6 MB |
| Events in quadrant A | 3,991,890 | 615,496 |
| Events in quadrant B | 2,891,038 | 676,110 |
| Events in quadrant C | 4,429,197 | 532,161 |
| Events in quadrant D | 5,799,556 | 489,358 |
| Mode SS | |||
|---|---|---|---|
| Quadrant | BADHDUFLAG | Total packets | Discarded packets |
| A | 0 | 128 | 0 |
| B | 0 | 128 | 0 |
| C | 0 | 128 | 0 |
| D | 0 | 128 | 0 |
| Mode M9 | |||
|---|---|---|---|
| Quadrant | BADHDUFLAG | Total packets | Discarded packets |
| A | 0 | 12 | 0 |
| B | 0 | 12 | 0 |
| C | 0 | 12 | 0 |
| D | 0 | 12 | 0 |
| Mode M0 | |||
|---|---|---|---|
| Quadrant | BADHDUFLAG | Total packets | Discarded packets |
| A | 0 | 16233 | 3 |
| B | 0 | 13111 | 2 |
| C | 0 | 17823 | 2 |
| D | 0 | 21562 | 2 |
| Quadrant | Total seconds | Saturated seconds | Saturation percentage |
|---|---|---|---|
| A | 6231 | 157 | 2.519660% |
| B | 6232 | 28 | 0.449294% |
| C | 6232 | 599 | 9.611682% |
| D | 6232 | 752 | 12.066752% |
Noise dominated data is calculated using 1-second bins in cleaned event files. If a bin has >2000 counts, and if more than 50% of those come from <1% of pixels, then it is considered to be noise-dominated and hence unusable.
| Quadrant | # 1 sec bins | Bins with >0 counts | Bins with >2000 counts | High rate bins dominated by noise | Noise dominated (total time) | Noise dominated (detector-on time) | Marked lightcurve |
|---|---|---|---|---|---|---|---|
| A | 7451 | 6232 | 152 | 152 | 2.04% | 2.44% | 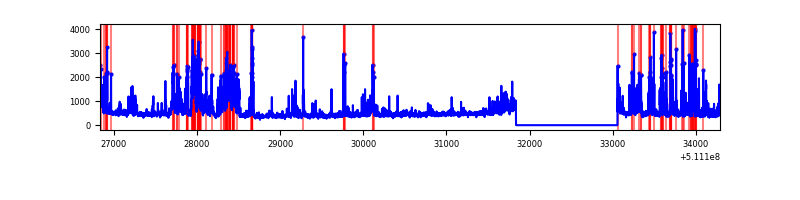 |
| B | 7452 | 6233 | 5 | 5 | 0.07% | 0.08% | 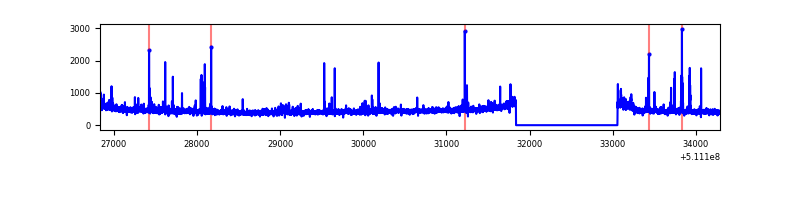 |
| C | 7452 | 6233 | 560 | 560 | 7.51% | 8.98% | 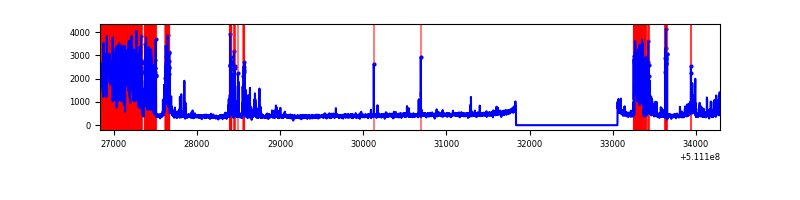 |
| D | 7452 | 6233 | 706 | 706 | 9.47% | 11.33% | 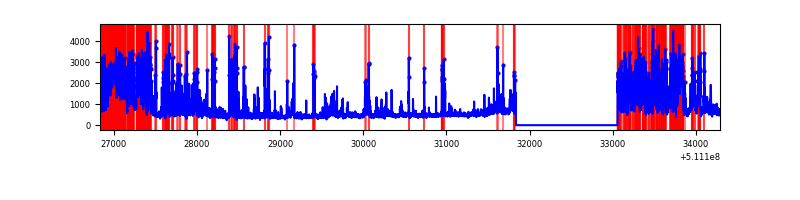 |
Top three noisy pixels from each quadrant. If the there are fewer than three noisy pixels in the level2.evt file, extra rows are filled as -1
| Pixel properties | Quadrant properties | ||||||
|---|---|---|---|---|---|---|---|
| Quadrant | DetID | PixID | Counts | Sigma | Mean | Median | Sigma |
| A | 4 | 249 | 715136 | 4255.7 | 673 | 656 | 167.9 |
| A | 12 | 3 | 464349 | 2761.92 | 673 | 656 | 167.9 |
| A | 12 | 194 | 72862 | 430.08 | 673 | 656 | 167.9 |
| B | 7 | 252 | 47975 | 325.77 | 677 | 653 | 145.3 |
| B | 10 | 247 | 33455 | 225.81 | 677 | 653 | 145.3 |
| B | 8 | 128 | 29665 | 199.72 | 677 | 653 | 145.3 |
| C | 15 | 230 | 1785570 | 10412.24 | 621 | 615 | 171.4 |
| C | 6 | 223 | 93461 | 541.6 | 621 | 615 | 171.4 |
| C | 12 | 252 | 88644 | 513.5 | 621 | 615 | 171.4 |
| D | 8 | 129 | 959660 | 5544.81 | 608 | 580 | 173.0 |
| D | 6 | 239 | 847591 | 4896.9 | 608 | 580 | 173.0 |
| D | 8 | 240 | 511443 | 2953.49 | 608 | 580 | 173.0 |
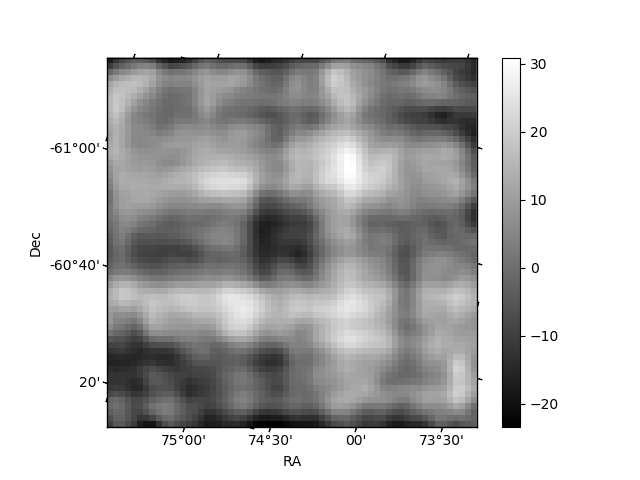
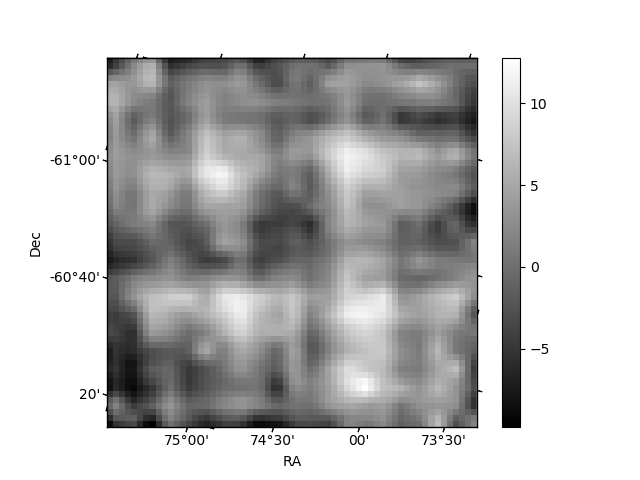
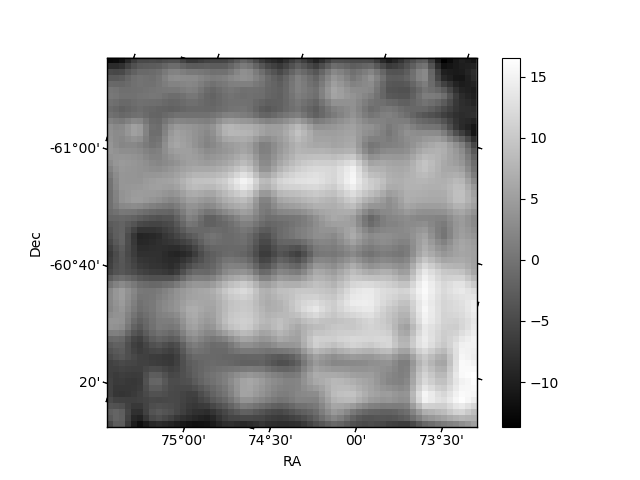
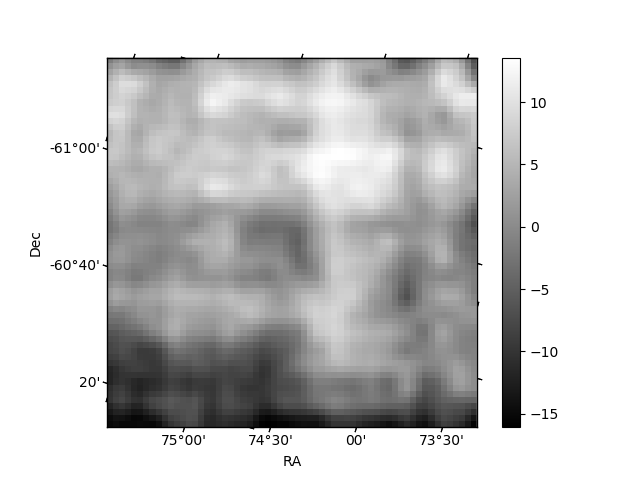
Histogram calculated using DETX and DETY for each event in the final _common_clean file
| Quadrant A | 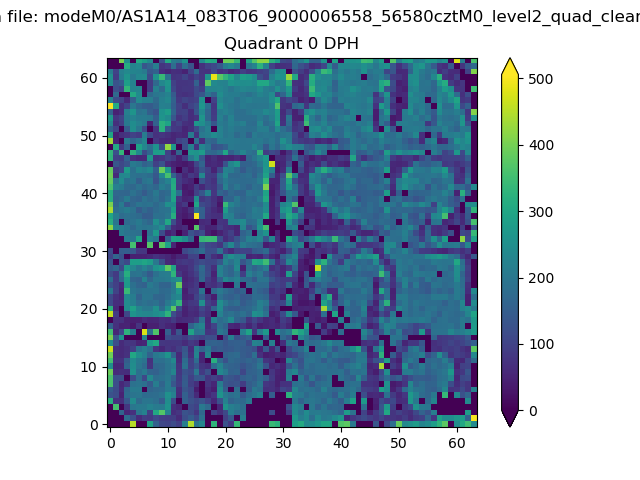 |
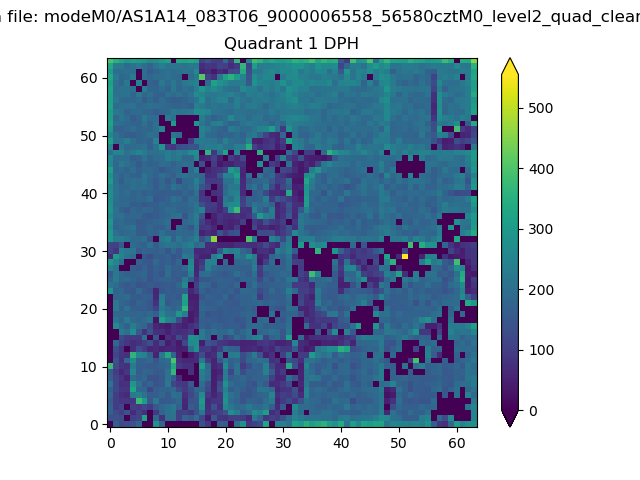 |
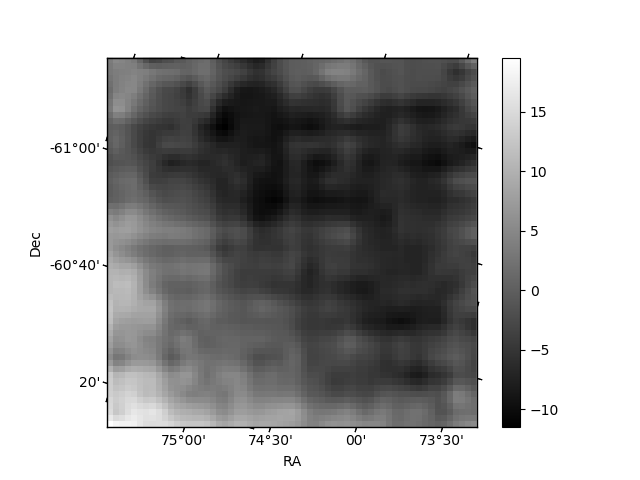
Quadrant B |
|---|---|---|---|
| Quadrant D | 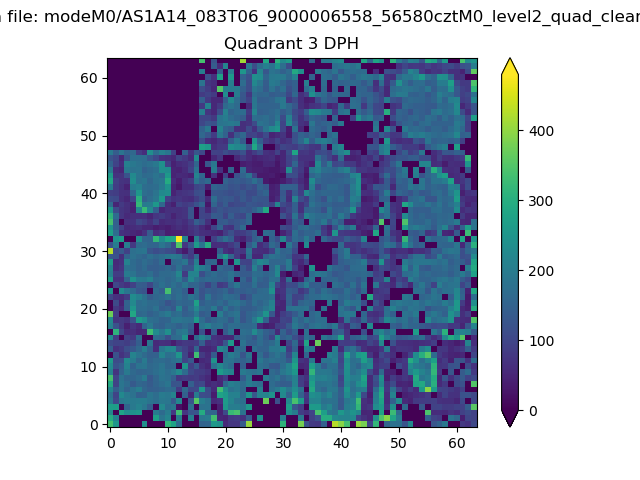 |
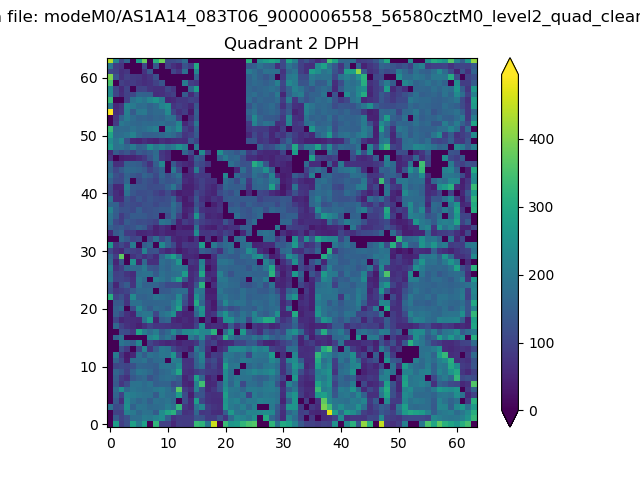 |
Quadrant C |
| Plot type | Count rate plots | Images |
|---|---|---|
| Comparison with Poisson distribution Blue bars denote a histogram of data divided into 1 sec bins. Red curve is a Poisson curve with rate = median count rate of data. |
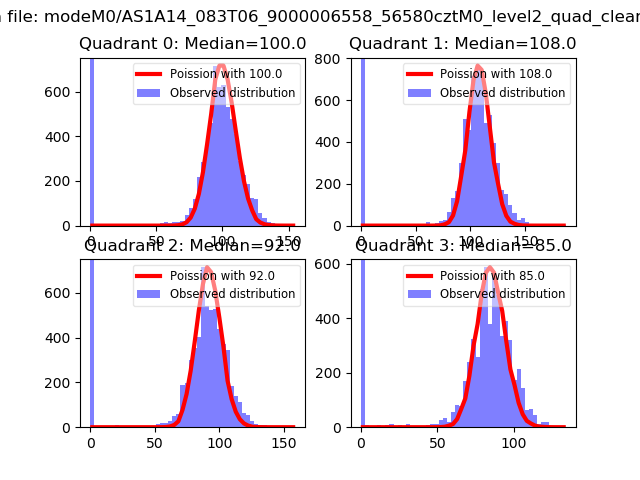 |
 |
| Quadrant-wise count rates Data is divided into 100 sec bins |
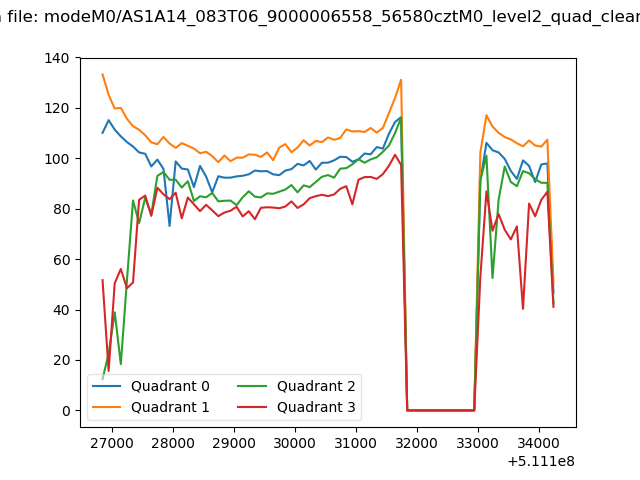 |
|
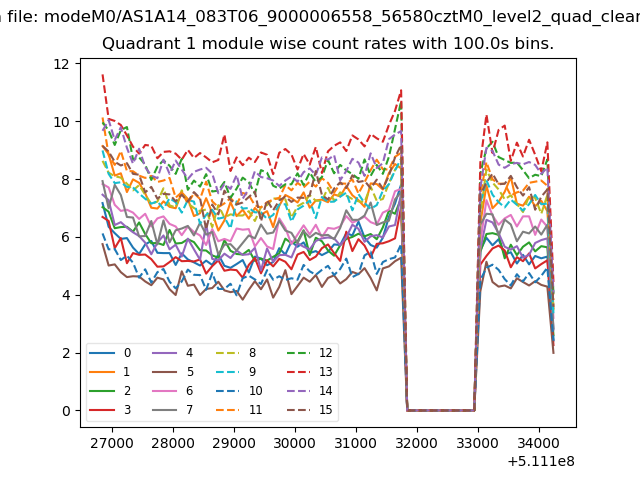
| Module-wise count rates for Quadrant A Data is divided into 100 sec bins |
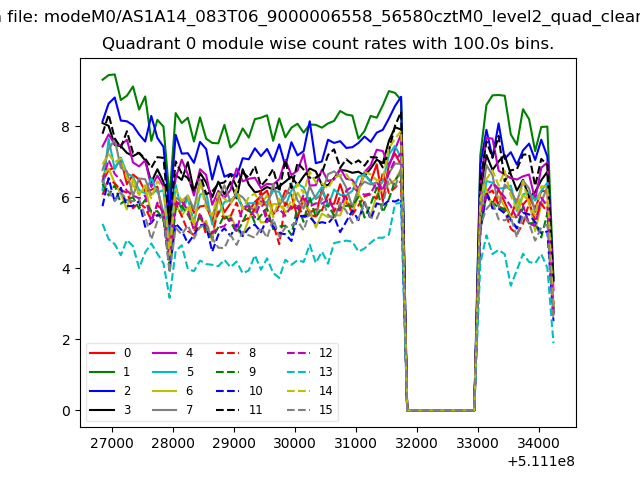 |
 |
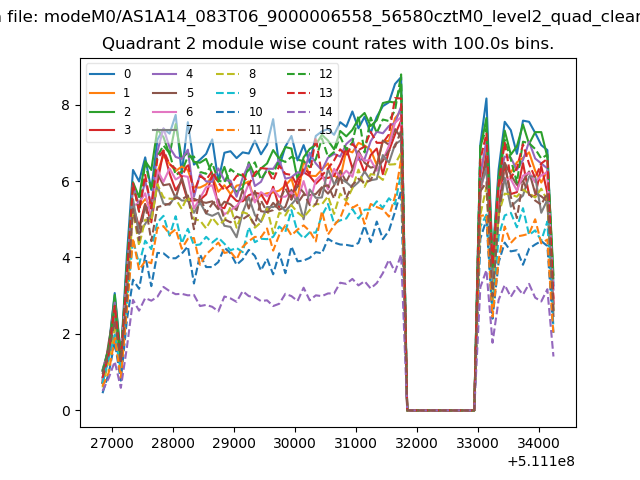
| Module-wise count rates for Quadrant B Data is divided into 100 sec bins |
 |
 |
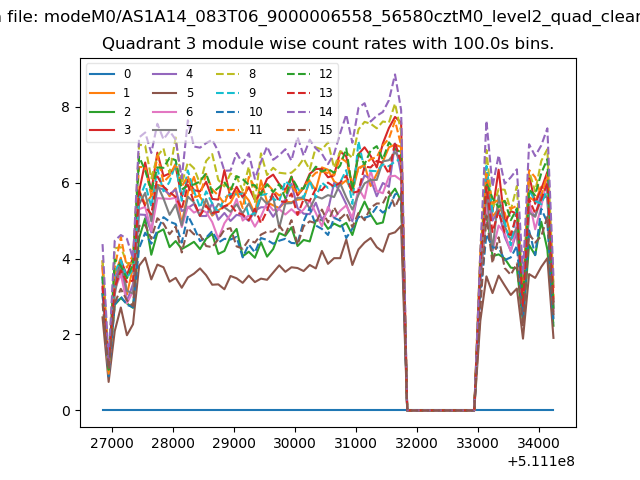
| Module-wise count rates for Quadrant C Data is divided into 100 sec bins |
 |
 |
| Module-wise count rates for Quadrant D Data is divided into 100 sec bins |
 |
 |
| Parameter | Plot |
|---|---|
| CZT HV Monitor |  |
| D_VDD | 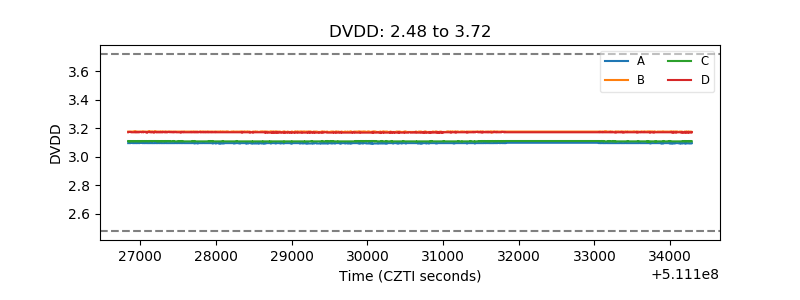 |
| Temperature 1 | 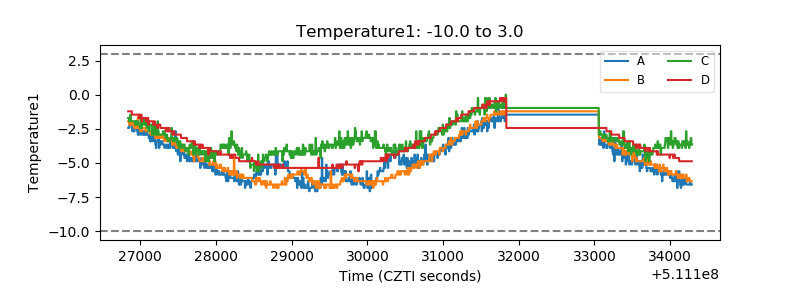 |
| Veto HV Monitor | 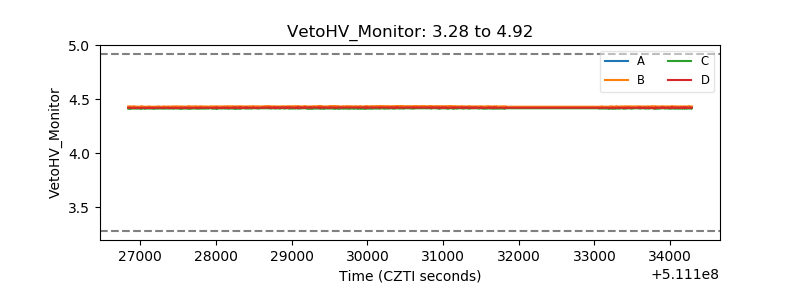 |
| Veto LLD | 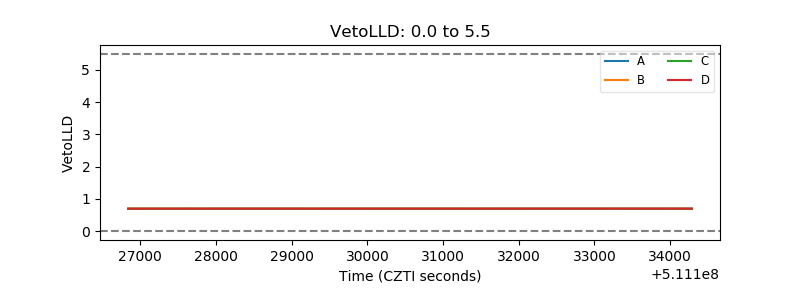 |
| Alpha Counter | 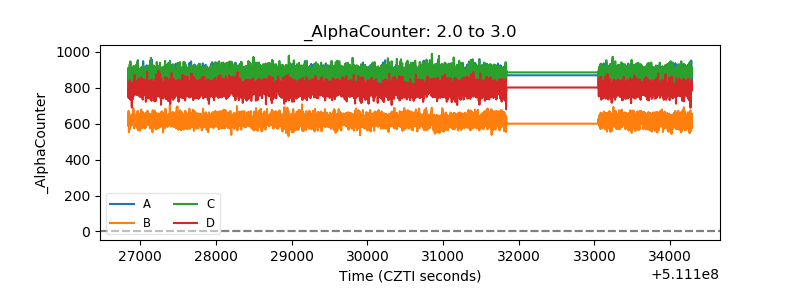 |
| _CPM_Rate | 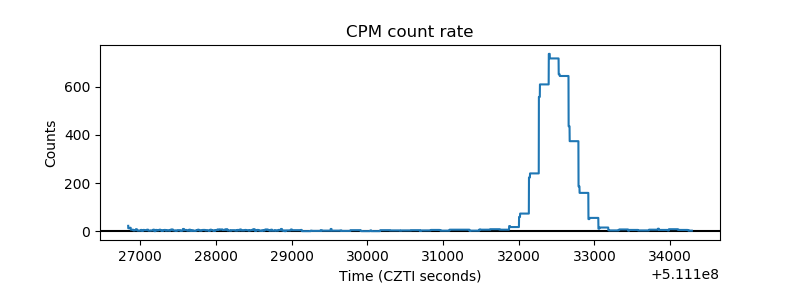 |
| CZT Counter | 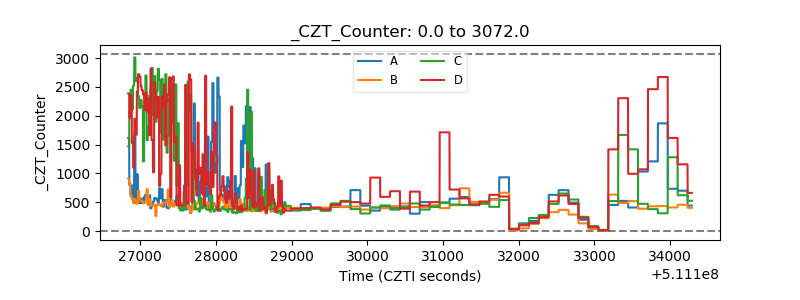 |
| +2.5 Volts monitor |  |
| +5 Volts monitor |  |
| _ROLL_ROT | 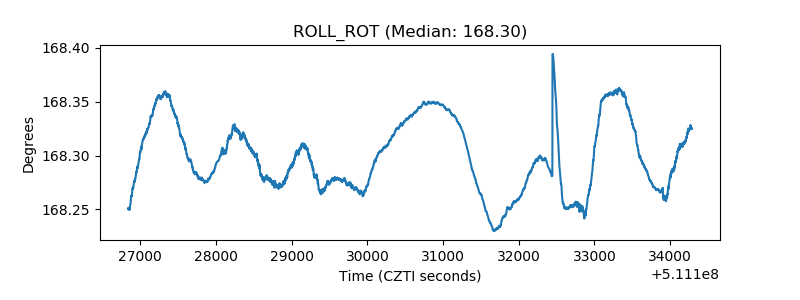 |
| _Roll_DEC | 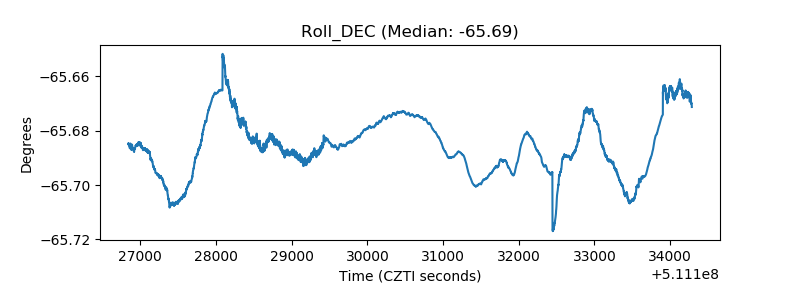 |
| _Roll_RA | 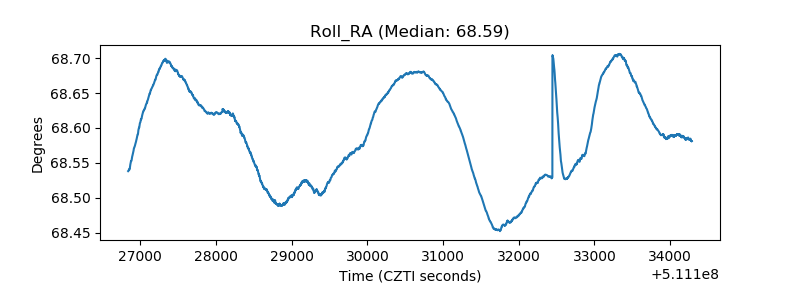 |
| Veto Counter | 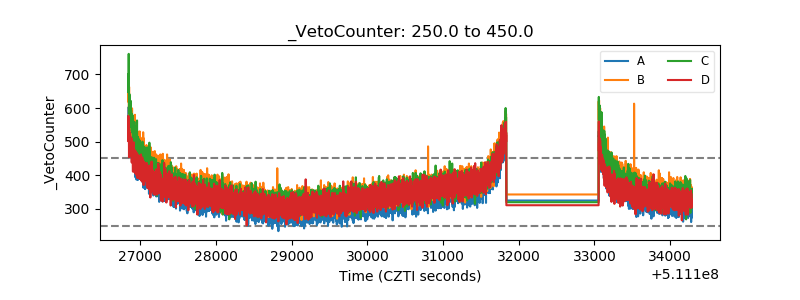 |