| Param | Original file | Final file |
|---|---|---|
| Filename | modeM0/AS1A14_083T06_9000006558_56581cztM0_level2.fits | modeM0/AS1A14_083T06_9000006558_56581cztM0_level2_quad_clean.evt |
| Size (bytes) | 442,244,160 | 95,443,200 |
| Size | 421.8 MB | 91.0 MB |
| Events in quadrant A | 3,477,612 | 637,356 |
| Events in quadrant B | 3,025,963 | 695,062 |
| Events in quadrant C | 4,249,117 | 573,028 |
| Events in quadrant D | 5,107,588 | 526,848 |
| Mode SS | |||
|---|---|---|---|
| Quadrant | BADHDUFLAG | Total packets | Discarded packets |
| A | 0 | 134 | 0 |
| B | 0 | 134 | 0 |
| C | 0 | 134 | 0 |
| D | 0 | 134 | 0 |
| Mode M9 | |||
|---|---|---|---|
| Quadrant | BADHDUFLAG | Total packets | Discarded packets |
| A | 0 | 18 | 0 |
| B | 0 | 19 | 0 |
| C | 0 | 19 | 0 |
| D | 0 | 19 | 0 |
| Mode M0 | |||
|---|---|---|---|
| Quadrant | BADHDUFLAG | Total packets | Discarded packets |
| A | 0 | 15119 | 2 |
| B | 0 | 13895 | 2 |
| C | 0 | 17486 | 2 |
| D | 0 | 19841 | 2 |
| Quadrant | Total seconds | Saturated seconds | Saturation percentage |
|---|---|---|---|
| A | 6561 | 87 | 1.326017% |
| B | 6560 | 34 | 0.518293% |
| C | 6560 | 374 | 5.701220% |
| D | 6560 | 513 | 7.820122% |
Noise dominated data is calculated using 1-second bins in cleaned event files. If a bin has >2000 counts, and if more than 50% of those come from <1% of pixels, then it is considered to be noise-dominated and hence unusable.
| Quadrant | # 1 sec bins | Bins with >0 counts | Bins with >2000 counts | High rate bins dominated by noise | Noise dominated (total time) | Noise dominated (detector-on time) | Marked lightcurve |
|---|---|---|---|---|---|---|---|
| A | 7681 | 6562 | 64 | 64 | 0.83% | 0.98% | 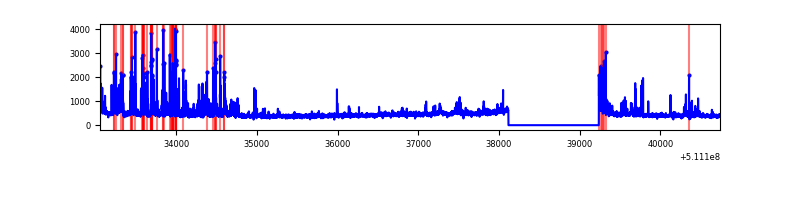 |
| B | 7680 | 6561 | 4 | 4 | 0.05% | 0.06% | 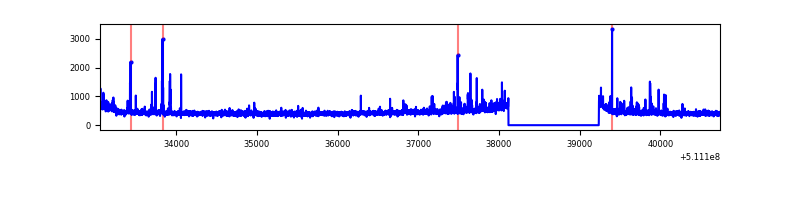 |
| C | 7680 | 6561 | 340 | 340 | 4.43% | 5.18% | 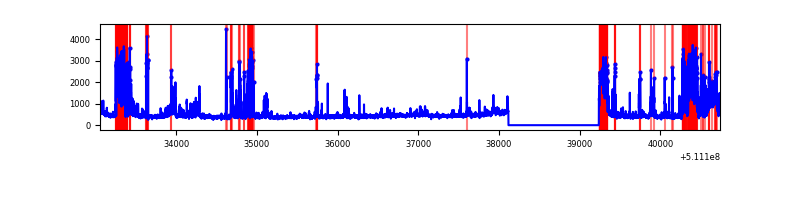 |
| D | 7680 | 6561 | 457 | 457 | 5.95% | 6.97% | 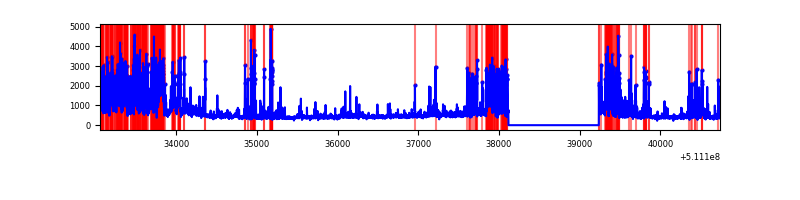 |
Top three noisy pixels from each quadrant. If the there are fewer than three noisy pixels in the level2.evt file, extra rows are filled as -1
| Pixel properties | Quadrant properties | ||||||
|---|---|---|---|---|---|---|---|
| Quadrant | DetID | PixID | Counts | Sigma | Mean | Median | Sigma |
| A | 4 | 249 | 490248 | 2789.57 | 700 | 681 | 175.5 |
| A | 12 | 3 | 106730 | 604.27 | 700 | 681 | 175.5 |
| A | 7 | 64 | 31112 | 173.4 | 700 | 681 | 175.5 |
| B | 10 | 247 | 45923 | 300.89 | 702 | 676 | 150.4 |
| B | 4 | 21 | 34268 | 223.38 | 702 | 676 | 150.4 |
| B | 7 | 252 | 33454 | 217.97 | 702 | 676 | 150.4 |
| C | 15 | 230 | 894575 | 4955.9 | 663 | 656 | 180.4 |
| C | 12 | 252 | 571849 | 3166.7 | 663 | 656 | 180.4 |
| C | 6 | 223 | 112638 | 620.83 | 663 | 656 | 180.4 |
| D | 6 | 239 | 1054214 | 5731.3 | 646 | 616 | 183.8 |
| D | 8 | 129 | 601239 | 3267.23 | 646 | 616 | 183.8 |
| D | 2 | 249 | 275163 | 1493.46 | 646 | 616 | 183.8 |
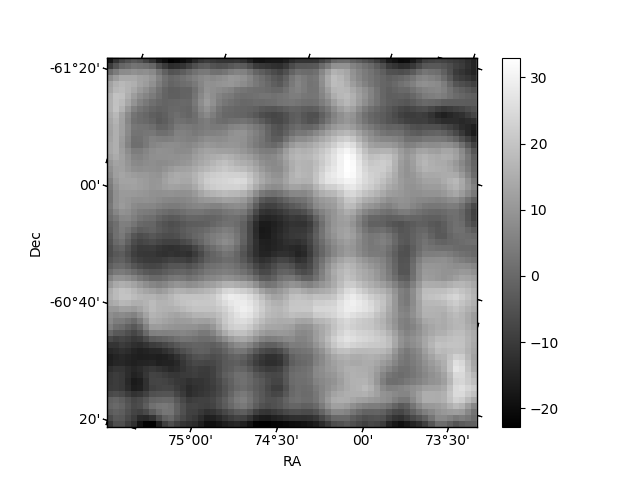
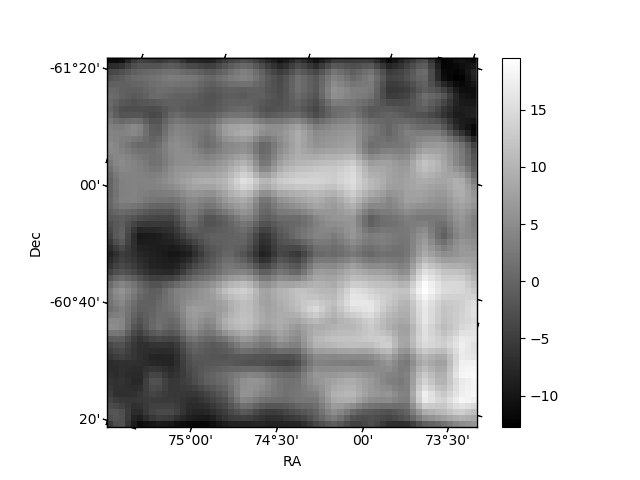
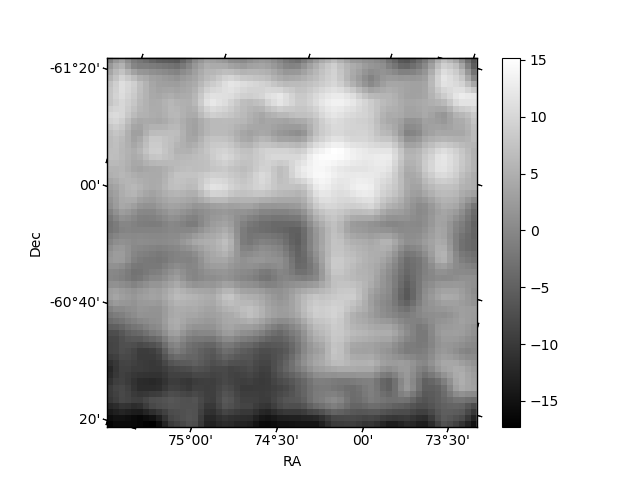
Histogram calculated using DETX and DETY for each event in the final _common_clean file
| Quadrant A | 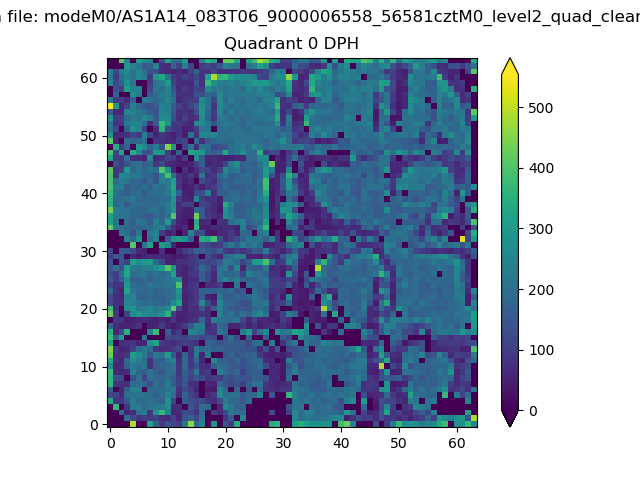 |
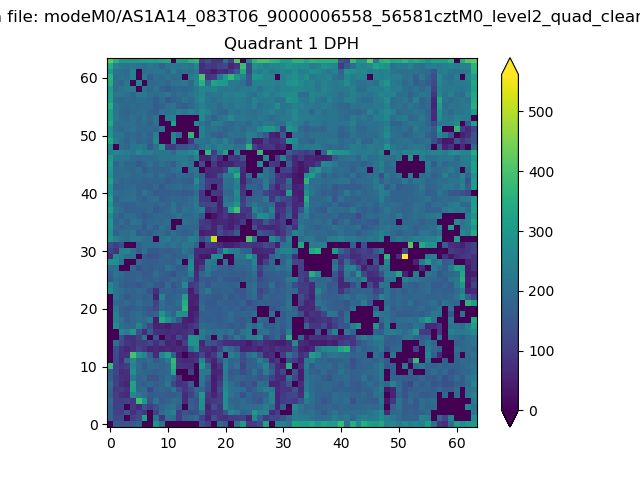 |
Quadrant B |
|---|---|---|---|
| Quadrant D | 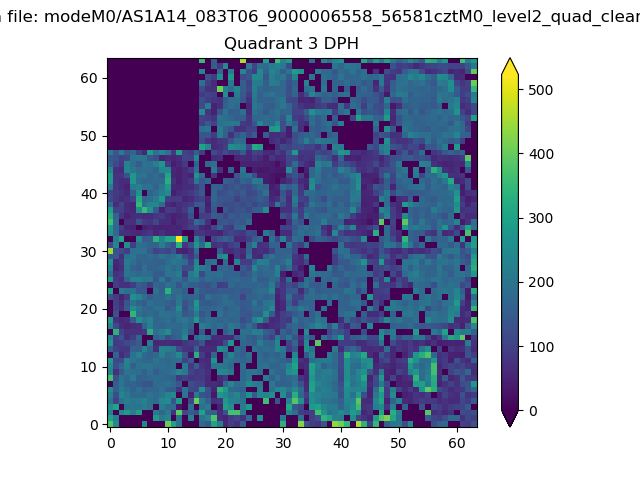 |
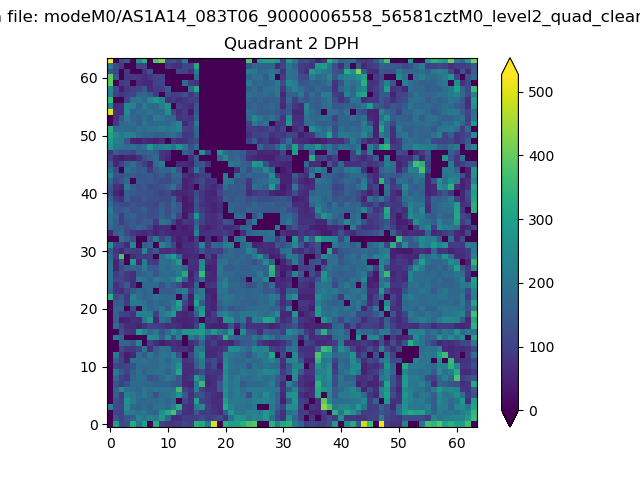 |
Quadrant C |
| Plot type | Count rate plots | Images |
|---|---|---|
| Comparison with Poisson distribution Blue bars denote a histogram of data divided into 1 sec bins. Red curve is a Poisson curve with rate = median count rate of data. |
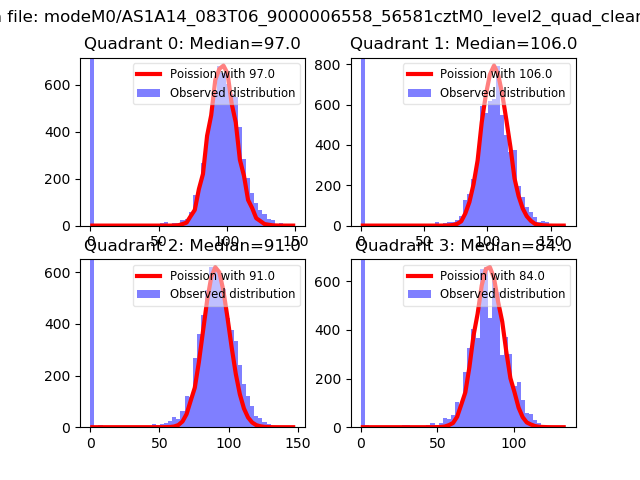 |
 |
| Quadrant-wise count rates Data is divided into 100 sec bins |
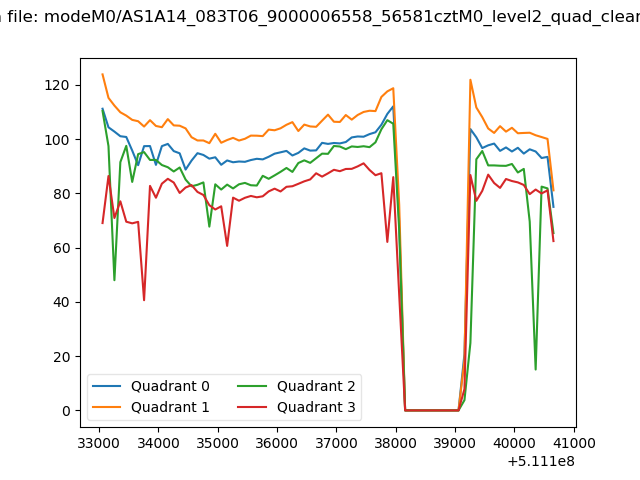 |
|
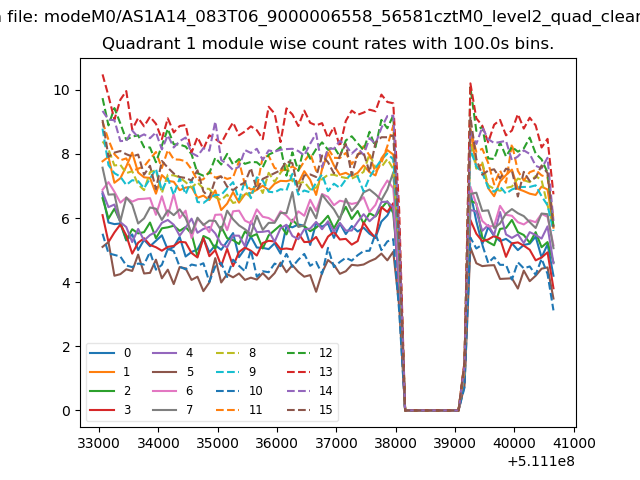
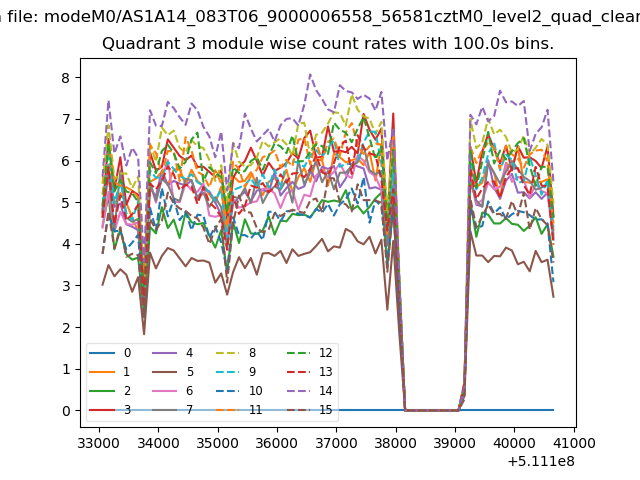
| Module-wise count rates for Quadrant A Data is divided into 100 sec bins |
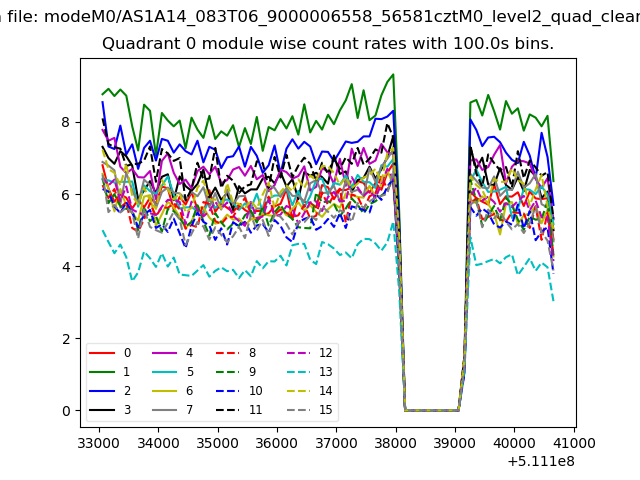 |
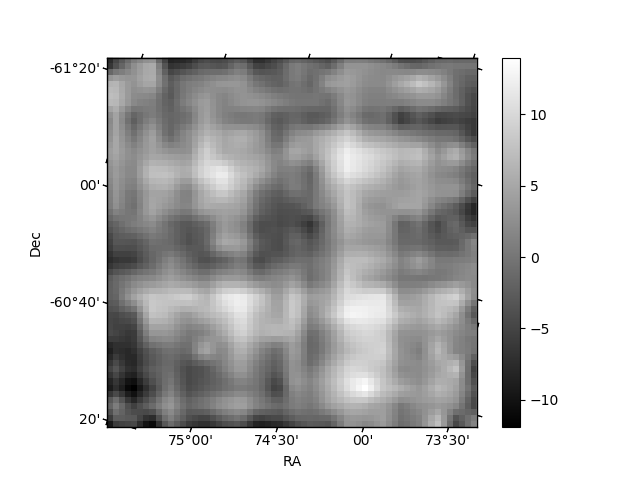 |
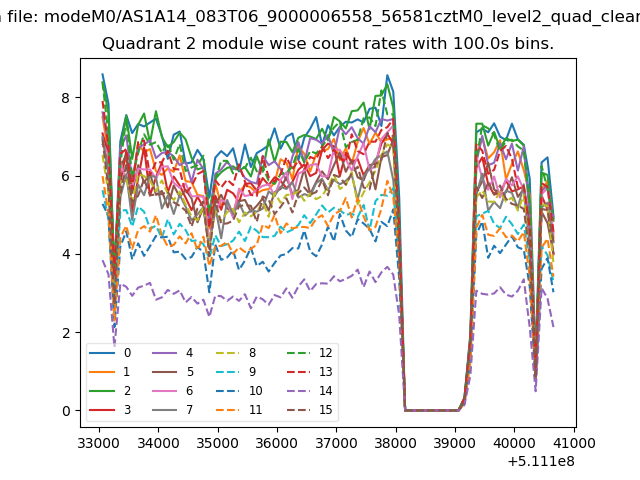
| Module-wise count rates for Quadrant B Data is divided into 100 sec bins |
 |
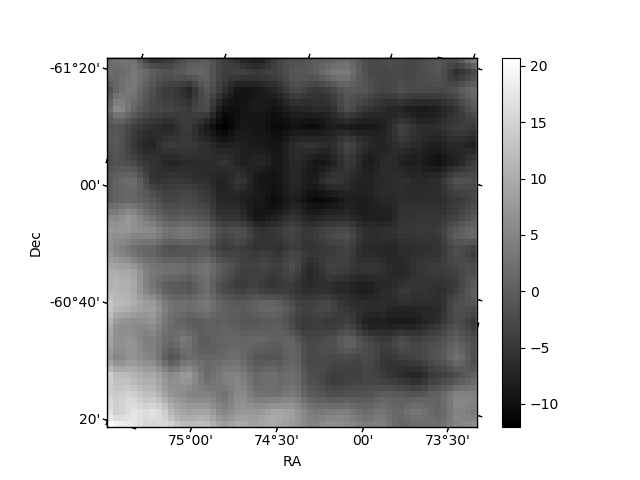 |
| Module-wise count rates for Quadrant C Data is divided into 100 sec bins |
 |
 |
| Module-wise count rates for Quadrant D Data is divided into 100 sec bins |
 |
 |
| Parameter | Plot |
|---|---|
| CZT HV Monitor |  |
| D_VDD | 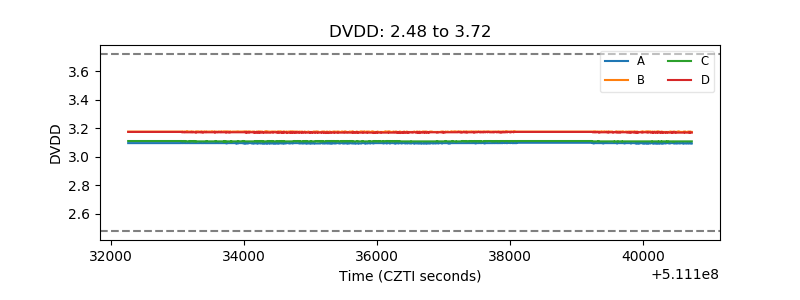 |
| Temperature 1 | 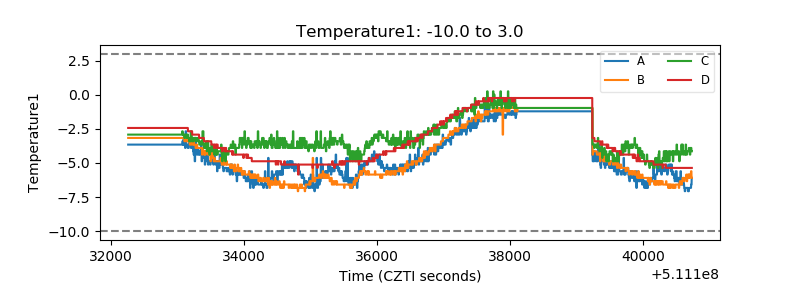 |
| Veto HV Monitor | 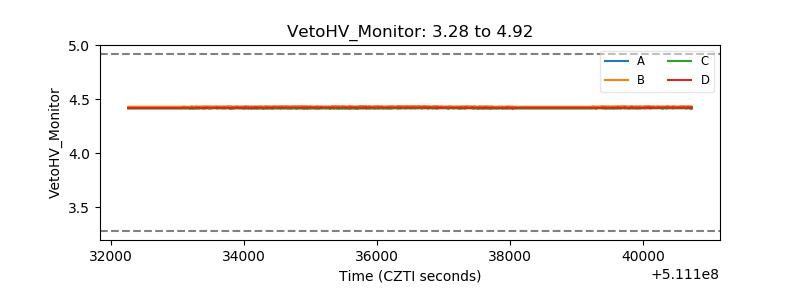 |
| Veto LLD | 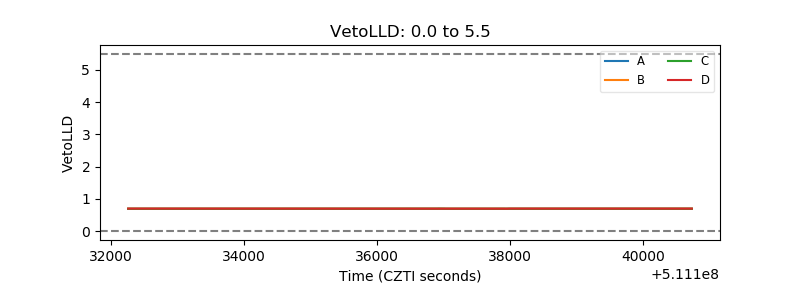 |
| Alpha Counter | 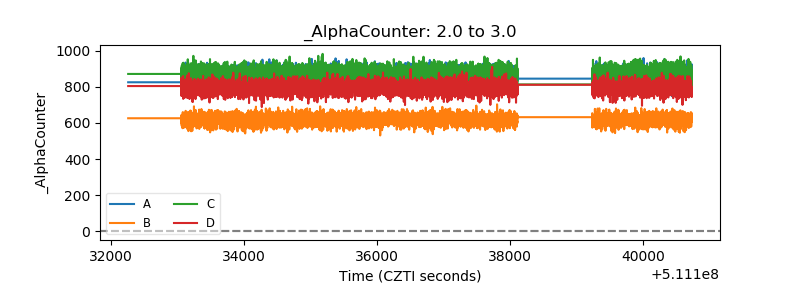 |
| _CPM_Rate | 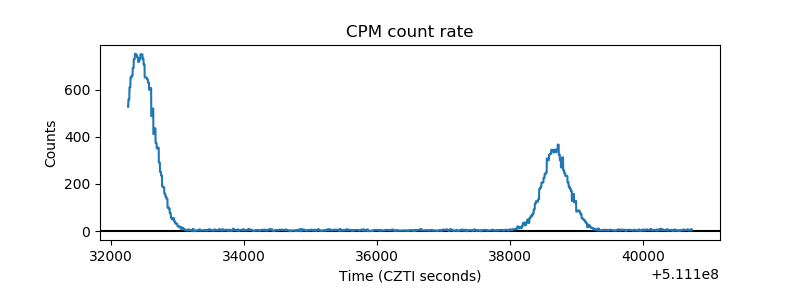 |
| CZT Counter | 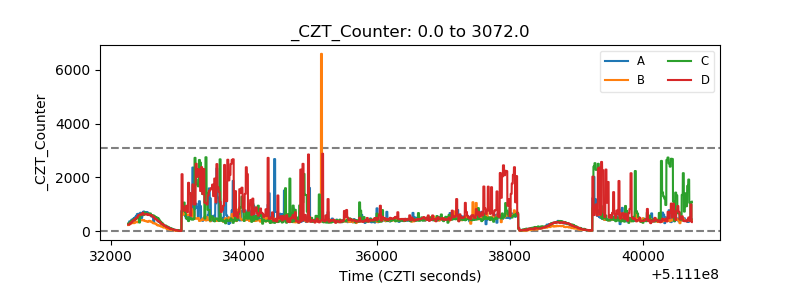 |
| +2.5 Volts monitor |  |
| +5 Volts monitor |  |
| _ROLL_ROT | 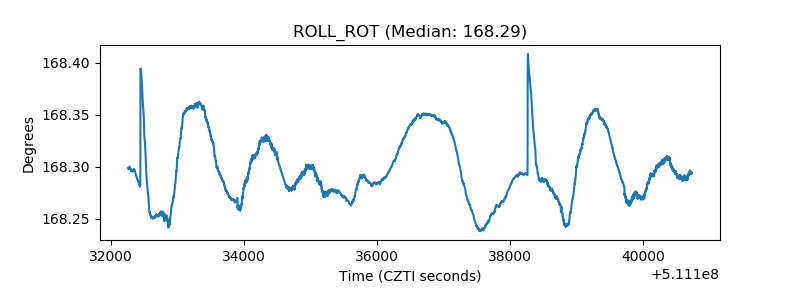 |
| _Roll_DEC | 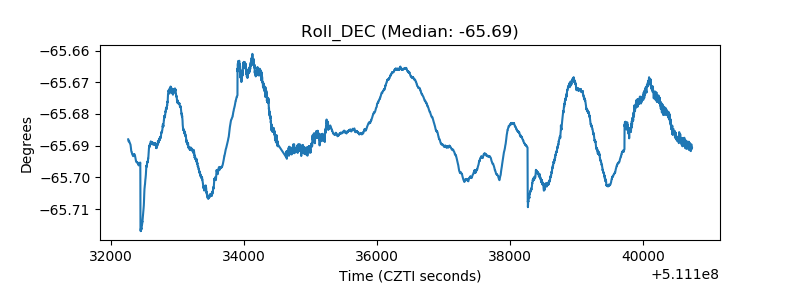 |
| _Roll_RA | 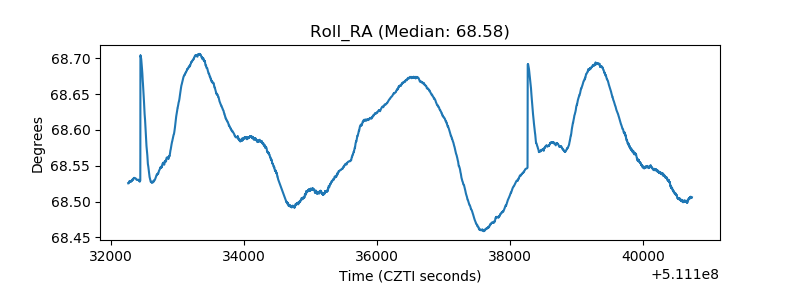 |
| Veto Counter | 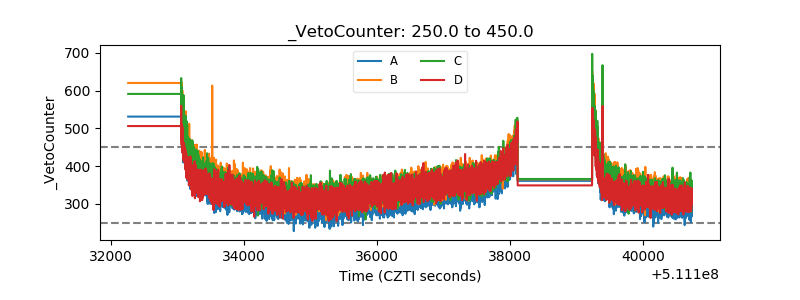 |