| Param | Original file | Final file |
|---|---|---|
| Filename | modeM0/AS1A14_083T06_9000006558_56582cztM0_level2.fits | modeM0/AS1A14_083T06_9000006558_56582cztM0_level2_quad_clean.evt |
| Size (bytes) | 516,225,600 | 98,000,640 |
| Size | 492.3 MB | 93.5 MB |
| Events in quadrant A | 6,043,547 | 581,904 |
| Events in quadrant B | 3,839,513 | 708,614 |
| Events in quadrant C | 4,241,754 | 609,671 |
| Events in quadrant D | 4,443,785 | 582,711 |
| Mode SS | |||
|---|---|---|---|
| Quadrant | BADHDUFLAG | Total packets | Discarded packets |
| A | 0 | 142 | 0 |
| B | 0 | 142 | 0 |
| C | 0 | 142 | 0 |
| D | 0 | 142 | 0 |
| Mode M9 | |||
|---|---|---|---|
| Quadrant | BADHDUFLAG | Total packets | Discarded packets |
| A | 0 | 9 | 0 |
| B | 0 | 10 | 0 |
| C | 0 | 10 | 0 |
| D | 0 | 10 | 0 |
| Mode M0 | |||
|---|---|---|---|
| Quadrant | BADHDUFLAG | Total packets | Discarded packets |
| A | 0 | 22868 | 2 |
| B | 0 | 16434 | 2 |
| C | 0 | 17822 | 2 |
| D | 0 | 18237 | 2 |
| Quadrant | Total seconds | Saturated seconds | Saturation percentage |
|---|---|---|---|
| A | 6952 | 1052 | 15.132336% |
| B | 6952 | 248 | 3.567319% |
| C | 6952 | 321 | 4.617376% |
| D | 6952 | 208 | 2.991945% |
Noise dominated data is calculated using 1-second bins in cleaned event files. If a bin has >2000 counts, and if more than 50% of those come from <1% of pixels, then it is considered to be noise-dominated and hence unusable.
| Quadrant | # 1 sec bins | Bins with >0 counts | Bins with >2000 counts | High rate bins dominated by noise | Noise dominated (total time) | Noise dominated (detector-on time) | Marked lightcurve |
|---|---|---|---|---|---|---|---|
| A | 7752 | 6953 | 953 | 953 | 12.29% | 13.71% | 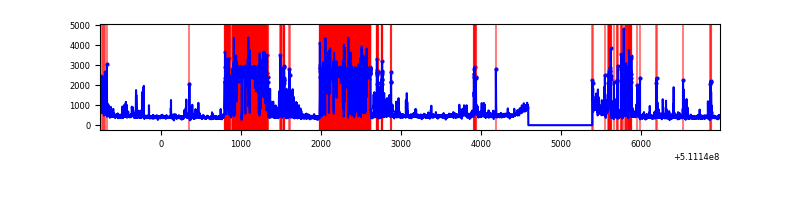 |
| B | 7752 | 6953 | 135 | 135 | 1.74% | 1.94% | 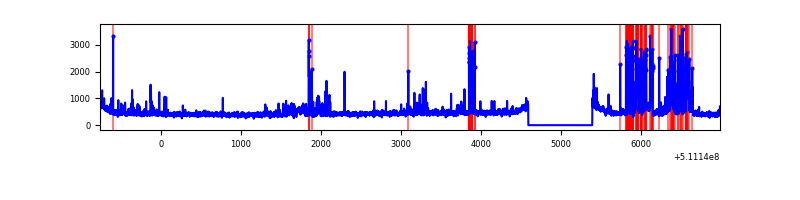 |
| C | 7752 | 6953 | 248 | 248 | 3.20% | 3.57% | 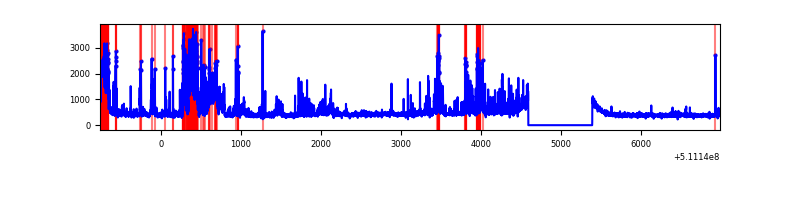 |
| D | 7752 | 6953 | 148 | 148 | 1.91% | 2.13% | 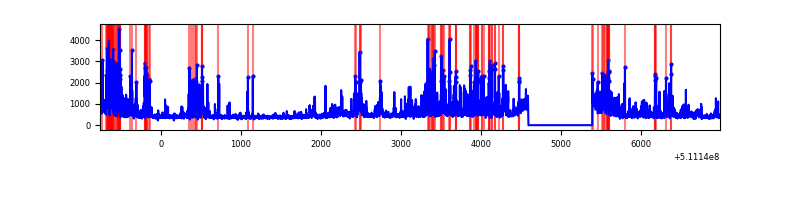 |
Top three noisy pixels from each quadrant. If the there are fewer than three noisy pixels in the level2.evt file, extra rows are filled as -1
| Pixel properties | Quadrant properties | ||||||
|---|---|---|---|---|---|---|---|
| Quadrant | DetID | PixID | Counts | Sigma | Mean | Median | Sigma |
| A | 7 | 64 | 2697274 | 15911.62 | 687 | 670 | 169.5 |
| A | 4 | 249 | 410592 | 2418.79 | 687 | 670 | 169.5 |
| A | 0 | 8 | 106266 | 623.08 | 687 | 670 | 169.5 |
| B | 5 | 185 | 584270 | 3696.05 | 740 | 711 | 157.9 |
| B | 4 | 21 | 134235 | 845.69 | 740 | 711 | 157.9 |
| B | 10 | 247 | 72539 | 454.93 | 740 | 711 | 157.9 |
| C | 12 | 252 | 717331 | 3674.34 | 714 | 705 | 195.0 |
| C | 15 | 230 | 341195 | 1745.79 | 714 | 705 | 195.0 |
| C | 13 | 3 | 148298 | 756.75 | 714 | 705 | 195.0 |
| D | 6 | 239 | 912543 | 4549.03 | 711 | 677 | 200.5 |
| D | 8 | 129 | 167083 | 830.15 | 711 | 677 | 200.5 |
| D | 2 | 249 | 119888 | 594.71 | 711 | 677 | 200.5 |
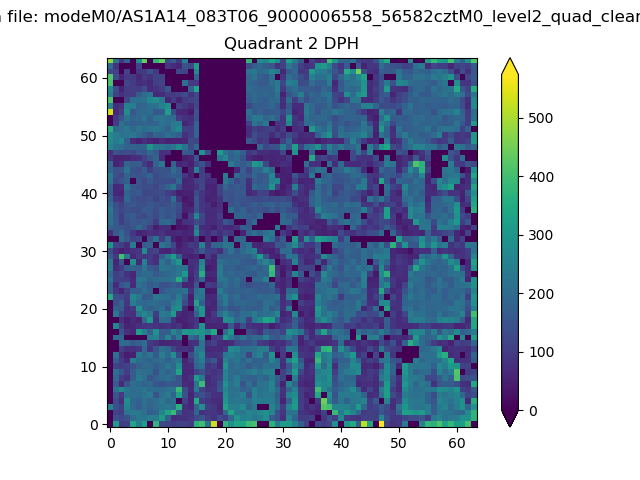
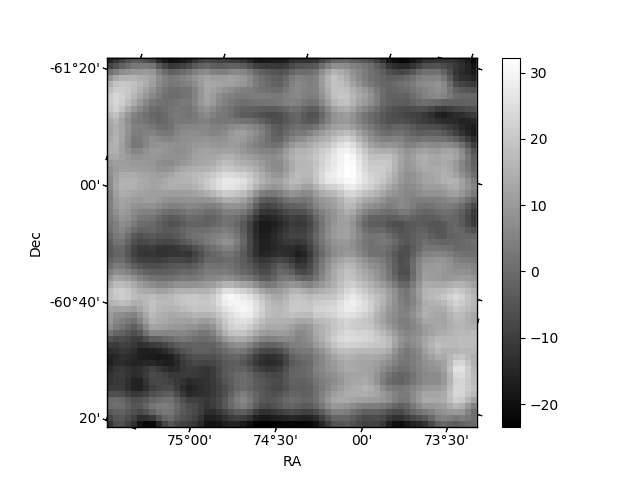
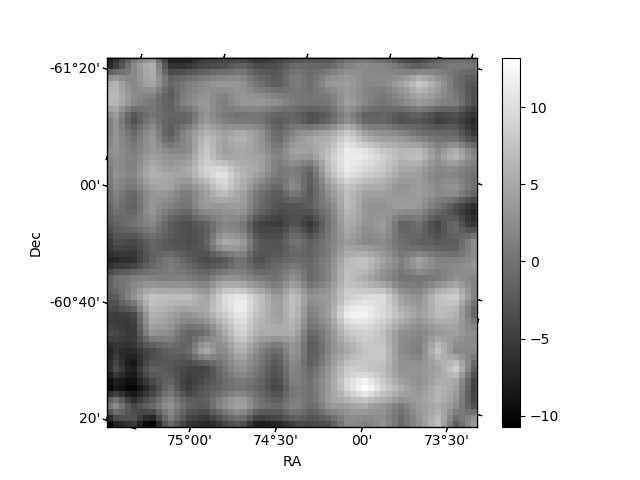
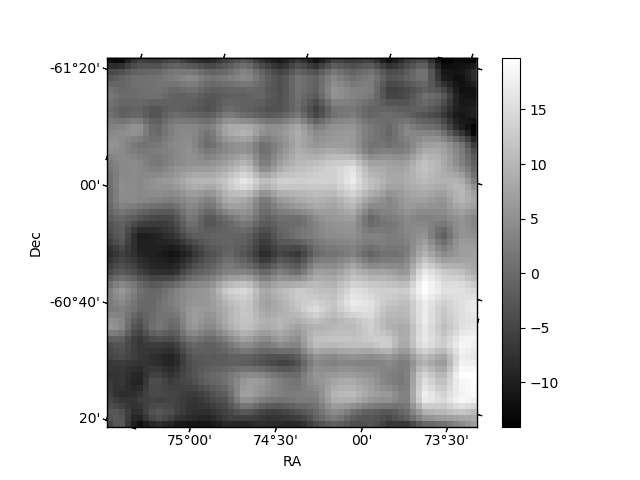
Histogram calculated using DETX and DETY for each event in the final _common_clean file
| Quadrant A | 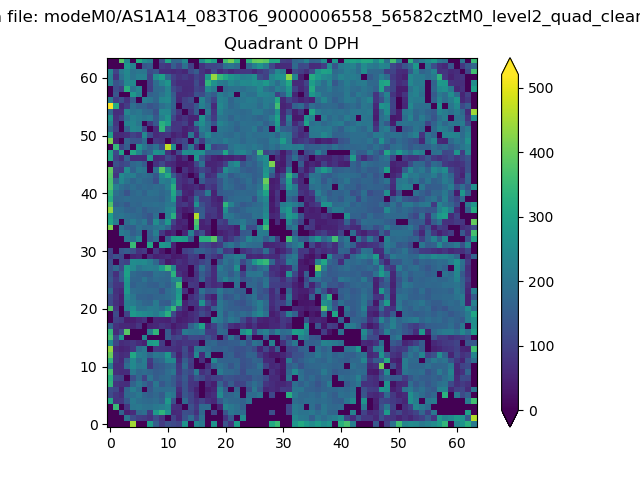 |
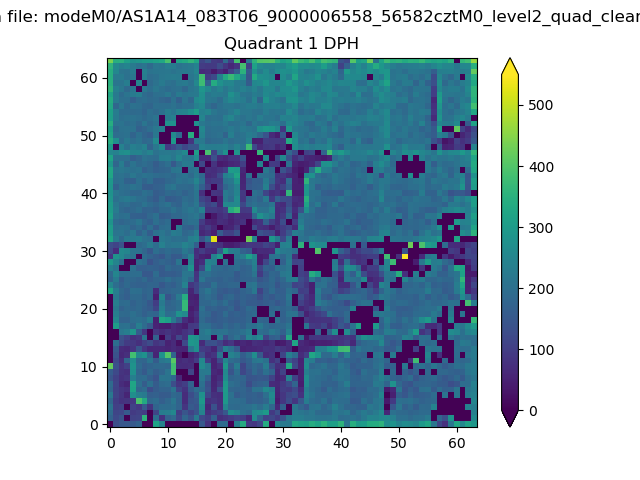 |
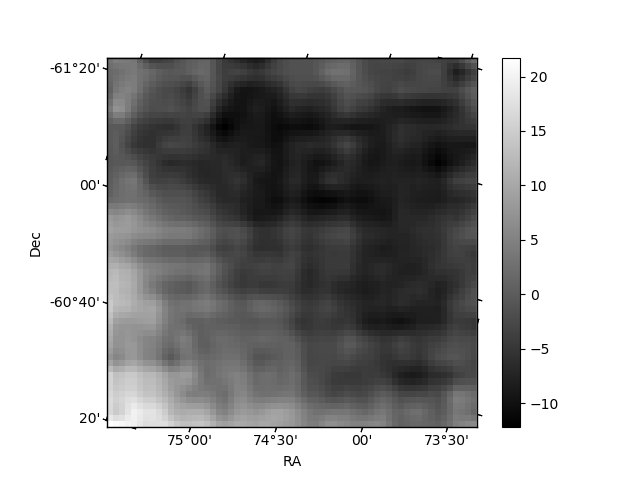
Quadrant B |
|---|---|---|---|
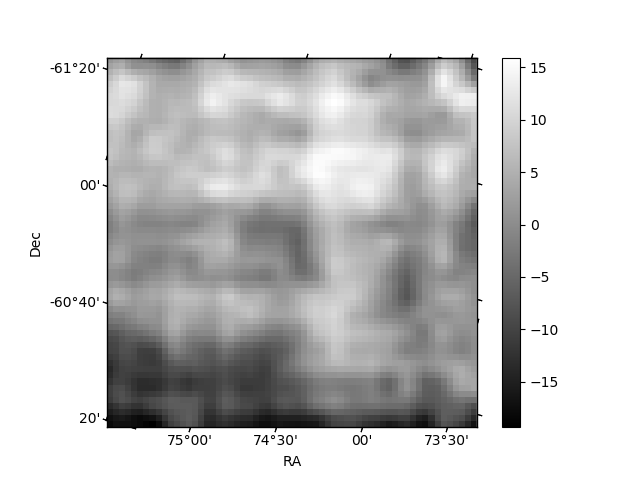
| Quadrant D | 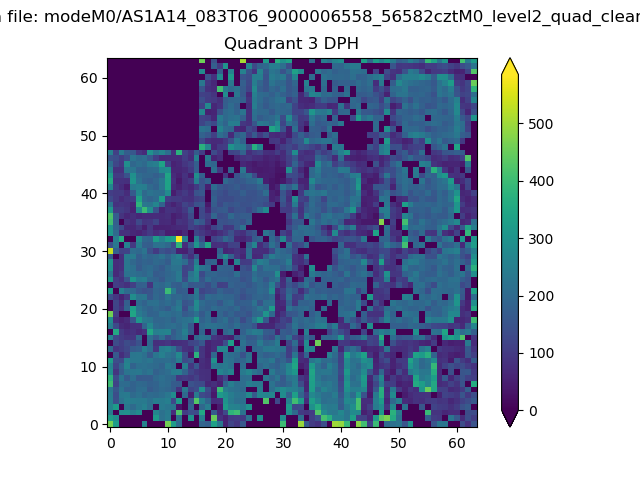 |
 |
Quadrant C |
| Plot type | Count rate plots | Images |
|---|---|---|
| Comparison with Poisson distribution Blue bars denote a histogram of data divided into 1 sec bins. Red curve is a Poisson curve with rate = median count rate of data. |
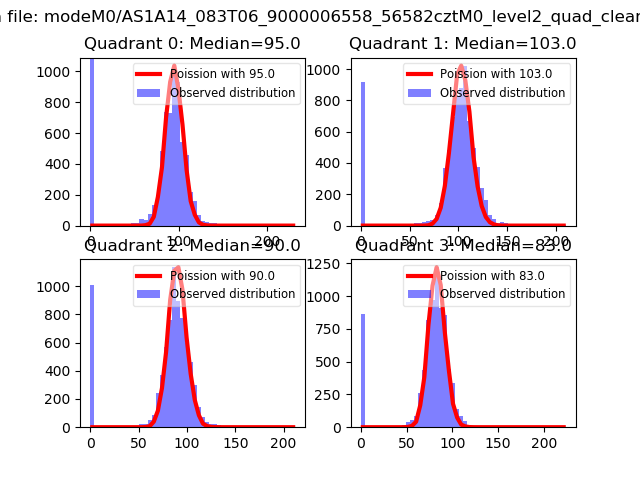 |
 |
| Quadrant-wise count rates Data is divided into 100 sec bins |
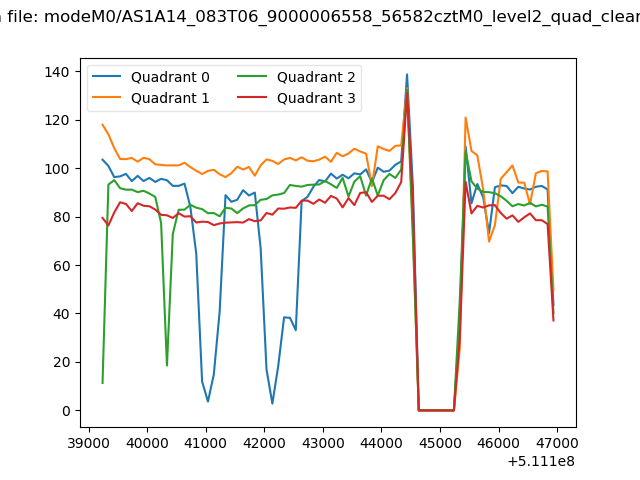 |
|
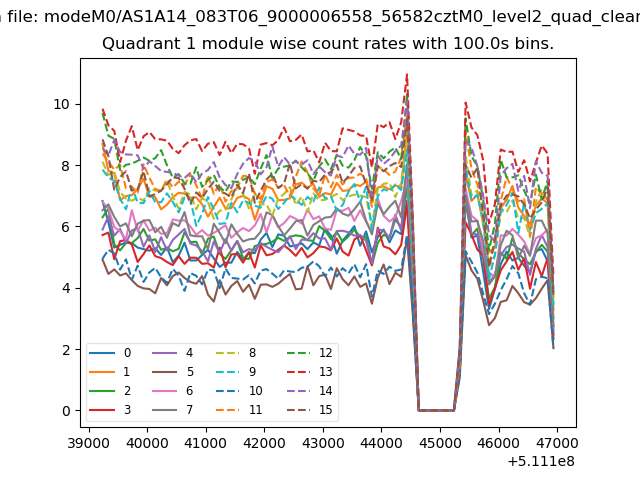
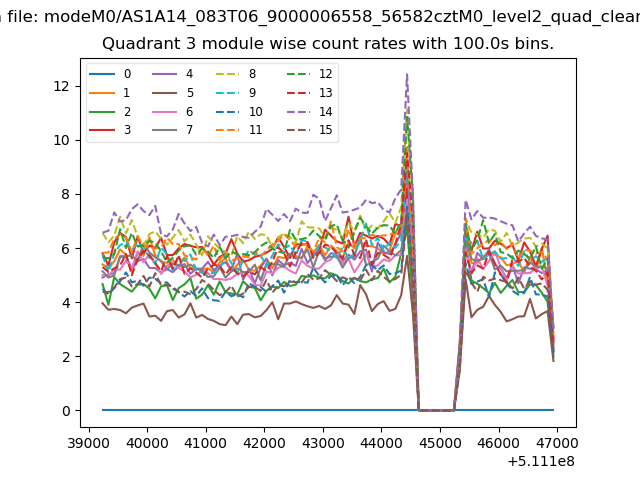
| Module-wise count rates for Quadrant A Data is divided into 100 sec bins |
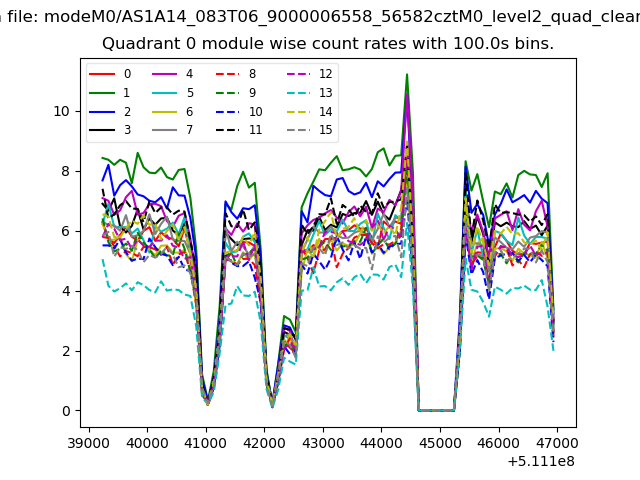 |
 |
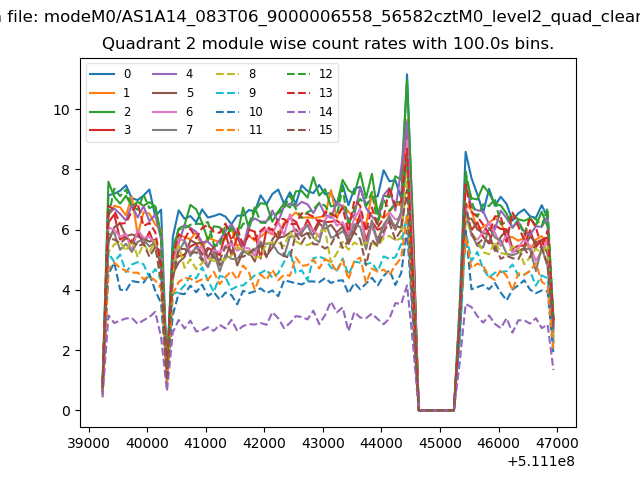
| Module-wise count rates for Quadrant B Data is divided into 100 sec bins |
 |
 |
| Module-wise count rates for Quadrant C Data is divided into 100 sec bins |
 |
 |
| Module-wise count rates for Quadrant D Data is divided into 100 sec bins |
 |
 |
| Parameter | Plot |
|---|---|
| CZT HV Monitor | 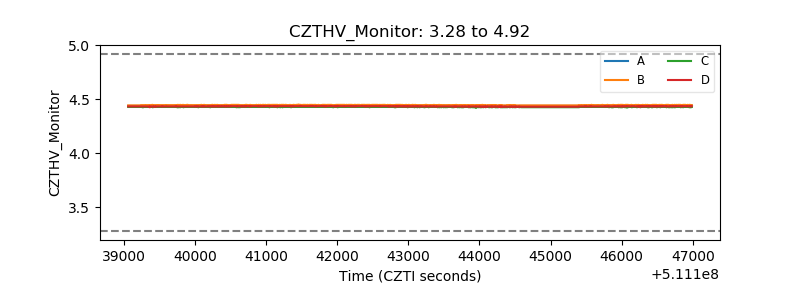 |
| D_VDD | 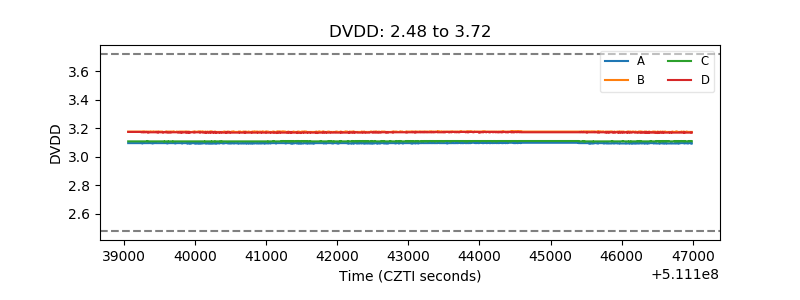 |
| Temperature 1 | 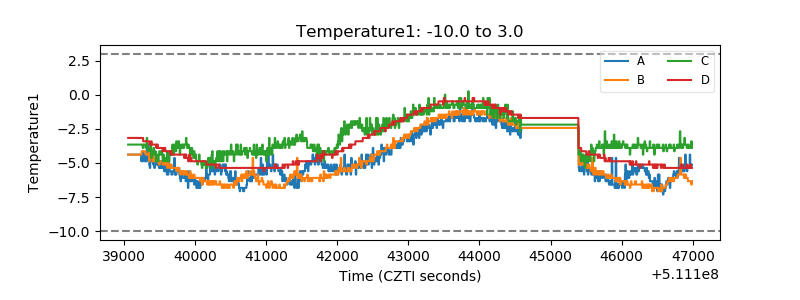 |
| Veto HV Monitor | 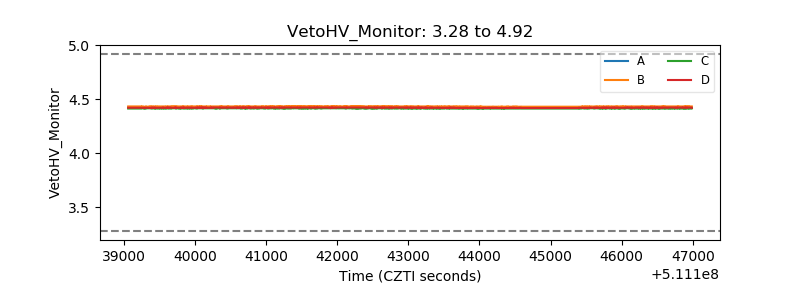 |
| Veto LLD | 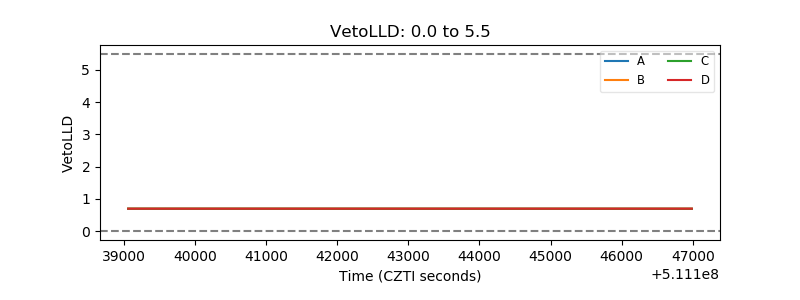 |
| Alpha Counter | 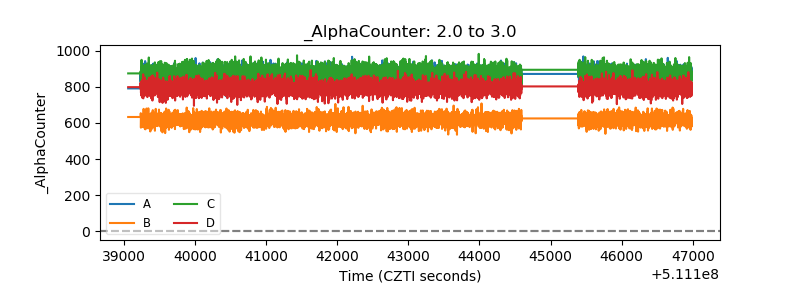 |
| _CPM_Rate | 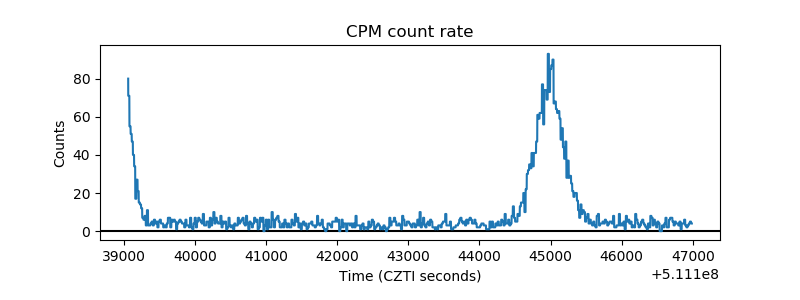 |
| CZT Counter | 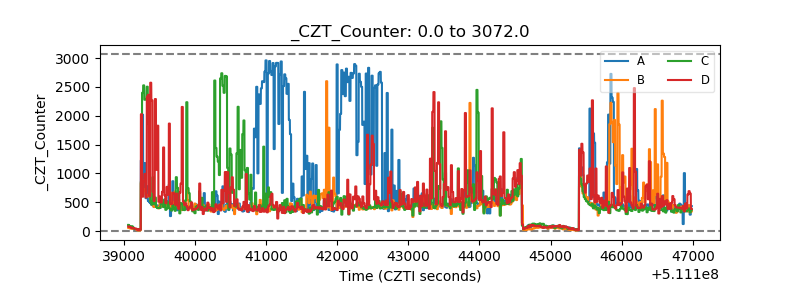 |
| +2.5 Volts monitor |  |
| +5 Volts monitor |  |
| _ROLL_ROT | 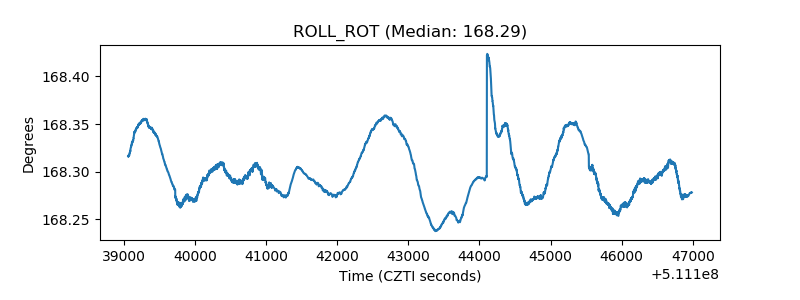 |
| _Roll_DEC | 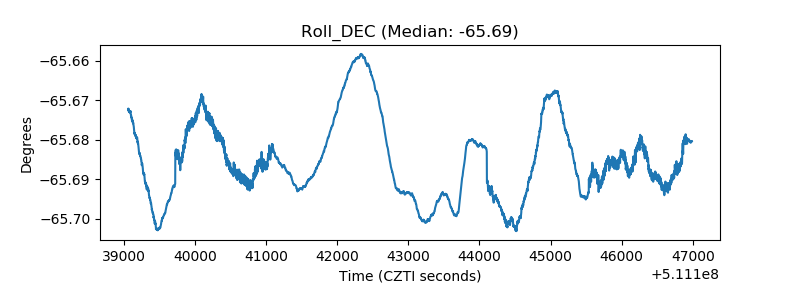 |
| _Roll_RA | 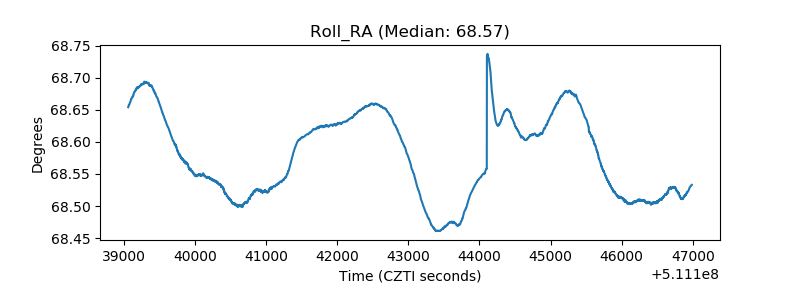 |
| Veto Counter | 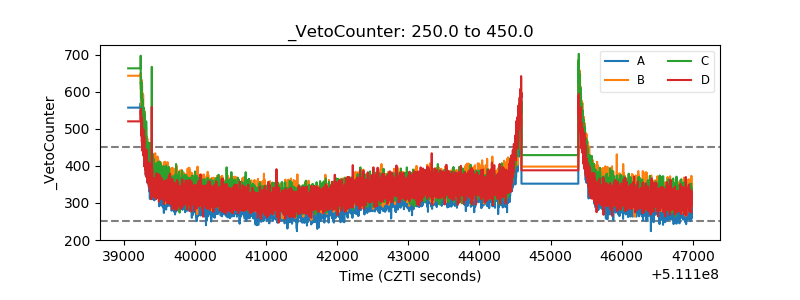 |