| Param | Original file | Final file |
|---|---|---|
| Filename | modeM0/AS1A14_083T06_9000006558_56583cztM0_level2.fits | modeM0/AS1A14_083T06_9000006558_56583cztM0_level2_quad_clean.evt |
| Size (bytes) | 626,379,840 | 119,900,160 |
| Size | 597.4 MB | 114.3 MB |
| Events in quadrant A | 5,301,887 | 790,284 |
| Events in quadrant B | 6,217,310 | 812,638 |
| Events in quadrant C | 4,563,638 | 768,450 |
| Events in quadrant D | 6,446,750 | 670,958 |
| Mode SS | |||
|---|---|---|---|
| Quadrant | BADHDUFLAG | Total packets | Discarded packets |
| A | 0 | 172 | 0 |
| B | 0 | 172 | 0 |
| C | 0 | 172 | 0 |
| D | 0 | 172 | 0 |
| Mode M9 | |||
|---|---|---|---|
| Quadrant | BADHDUFLAG | Total packets | Discarded packets |
| A | 0 | 8 | 0 |
| B | 0 | 8 | 0 |
| C | 0 | 8 | 0 |
| D | 0 | 8 | 0 |
| Mode M0 | |||
|---|---|---|---|
| Quadrant | BADHDUFLAG | Total packets | Discarded packets |
| A | 0 | 21752 | 3 |
| B | 0 | 24559 | 3 |
| C | 0 | 19935 | 3 |
| D | 0 | 25063 | 3 |
| Quadrant | Total seconds | Saturated seconds | Saturation percentage |
|---|---|---|---|
| A | 8461 | 520 | 6.145846% |
| B | 8461 | 819 | 9.679707% |
| C | 8462 | 258 | 3.048925% |
| D | 8461 | 826 | 9.762439% |
Noise dominated data is calculated using 1-second bins in cleaned event files. If a bin has >2000 counts, and if more than 50% of those come from <1% of pixels, then it is considered to be noise-dominated and hence unusable.
| Quadrant | # 1 sec bins | Bins with >0 counts | Bins with >2000 counts | High rate bins dominated by noise | Noise dominated (total time) | Noise dominated (detector-on time) | Marked lightcurve |
|---|---|---|---|---|---|---|---|
| A | 9316 | 8464 | 337 | 337 | 3.62% | 3.98% | 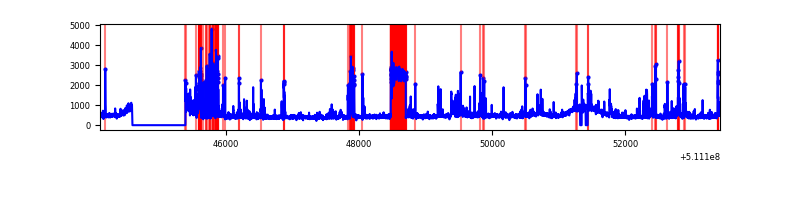 |
| B | 9316 | 8462 | 320 | 320 | 3.43% | 3.78% | 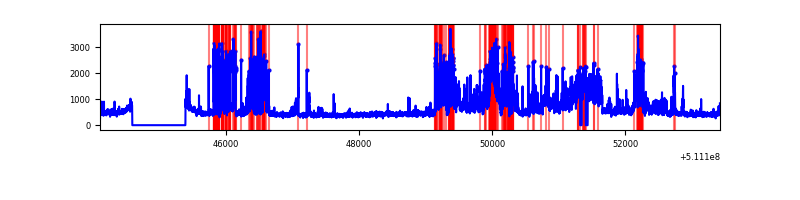 |
| C | 9317 | 8464 | 75 | 75 | 0.80% | 0.89% | 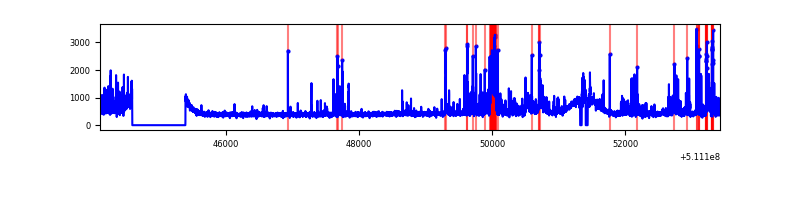 |
| D | 9316 | 8464 | 521 | 521 | 5.59% | 6.16% | 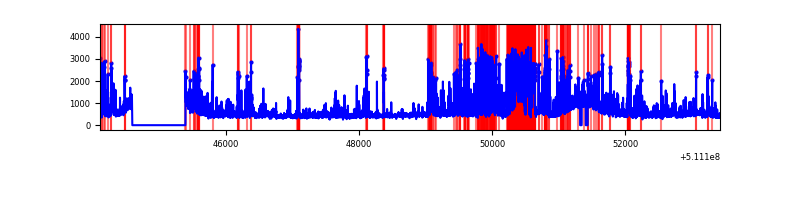 |
Top three noisy pixels from each quadrant. If the there are fewer than three noisy pixels in the level2.evt file, extra rows are filled as -1
| Pixel properties | Quadrant properties | ||||||
|---|---|---|---|---|---|---|---|
| Quadrant | DetID | PixID | Counts | Sigma | Mean | Median | Sigma |
| A | 7 | 64 | 783105 | 3421.02 | 928 | 906 | 228.6 |
| A | 4 | 249 | 406414 | 1773.53 | 928 | 906 | 228.6 |
| A | 12 | 3 | 144980 | 630.12 | 928 | 906 | 228.6 |
| B | 5 | 185 | 2390962 | 12259.35 | 914 | 881 | 195.0 |
| B | 8 | 128 | 39849 | 199.88 | 914 | 881 | 195.0 |
| B | 4 | 21 | 35665 | 178.42 | 914 | 881 | 195.0 |
| C | 5 | 250 | 334282 | 1324.08 | 926 | 916 | 251.8 |
| C | 1 | 12 | 277696 | 1099.33 | 926 | 916 | 251.8 |
| C | 12 | 252 | 144699 | 571.09 | 926 | 916 | 251.8 |
| D | 6 | 239 | 1734397 | 7000.05 | 884 | 842 | 247.6 |
| D | 5 | 222 | 289053 | 1163.79 | 884 | 842 | 247.6 |
| D | 2 | 249 | 171930 | 690.85 | 884 | 842 | 247.6 |
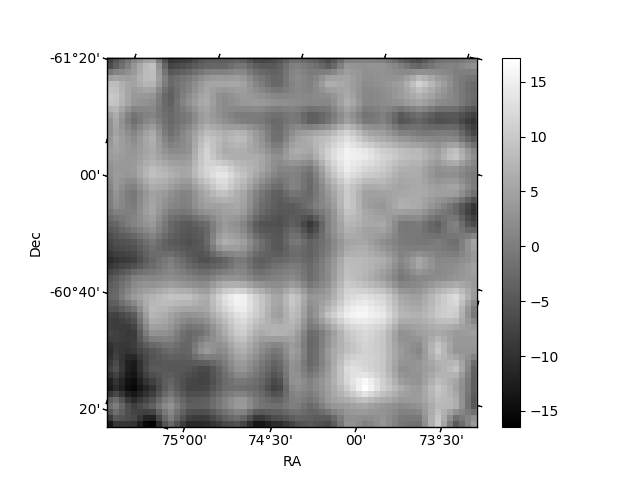
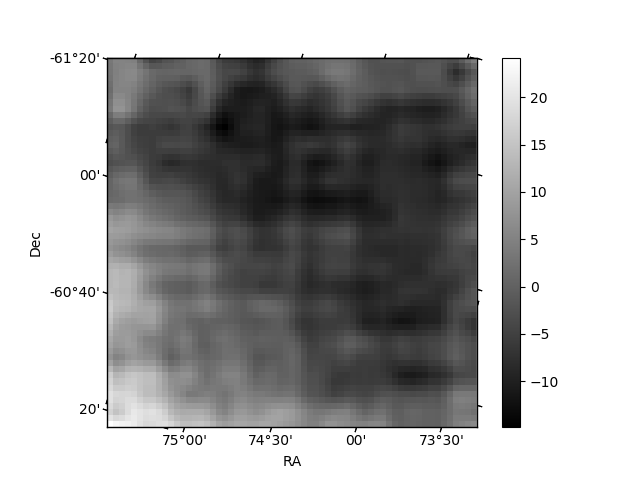
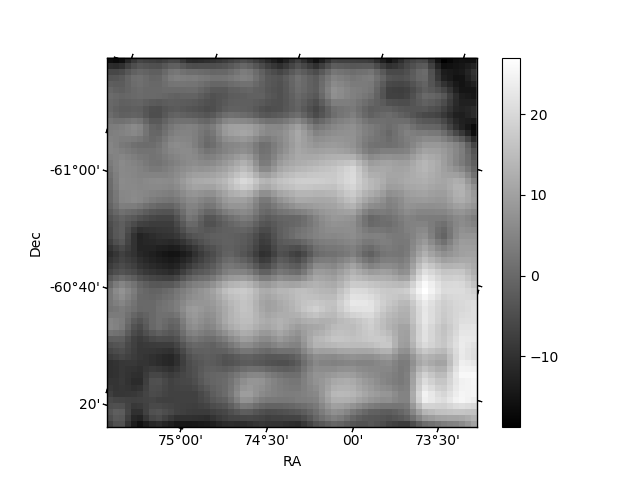
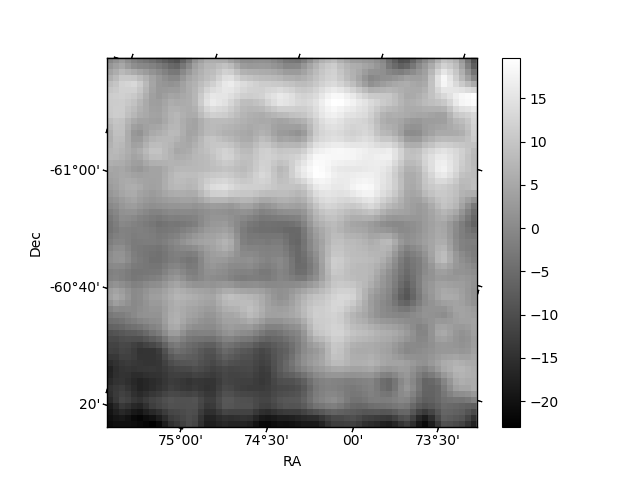
Histogram calculated using DETX and DETY for each event in the final _common_clean file
| Quadrant A | 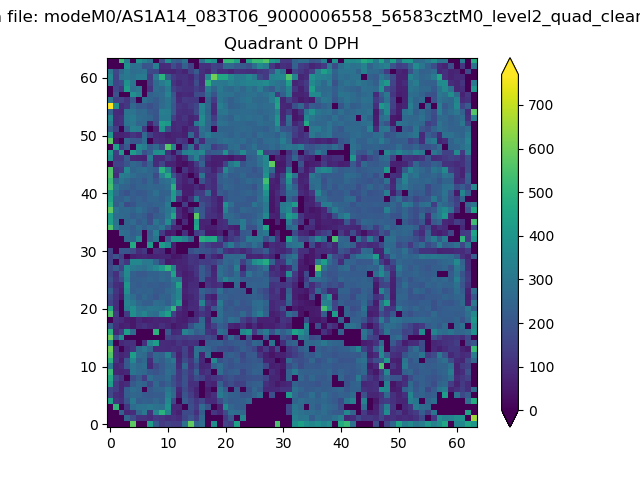 |
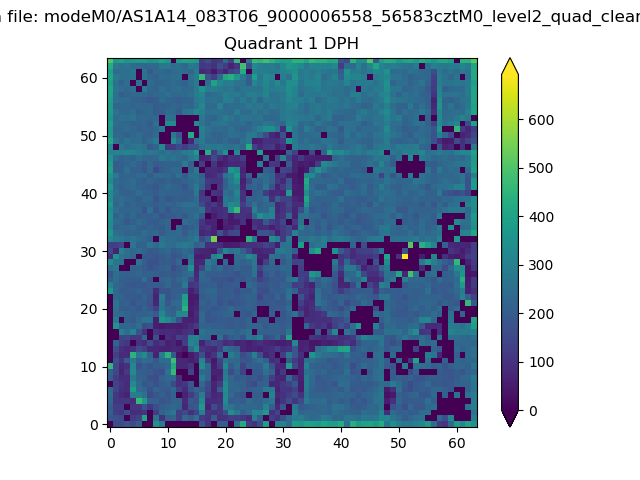 |
Quadrant B |
|---|---|---|---|
| Quadrant D | 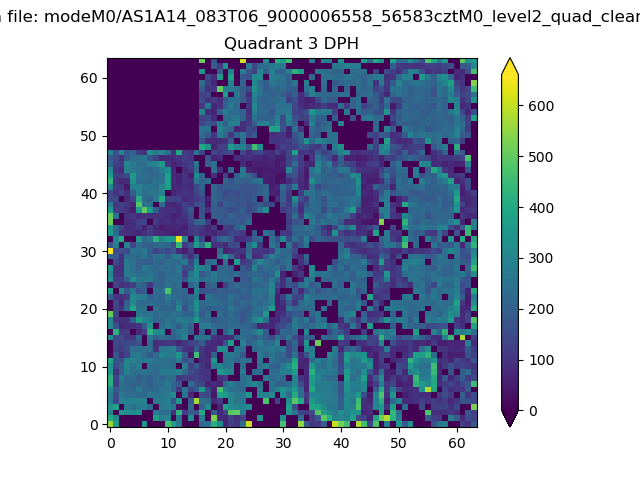 |
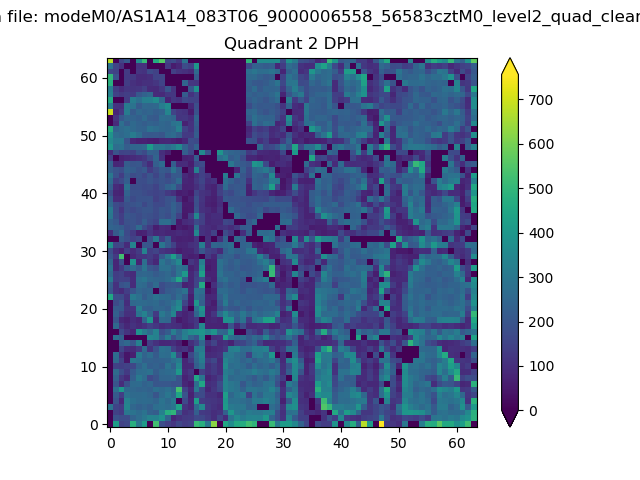 |
Quadrant C |
| Plot type | Count rate plots | Images |
|---|---|---|
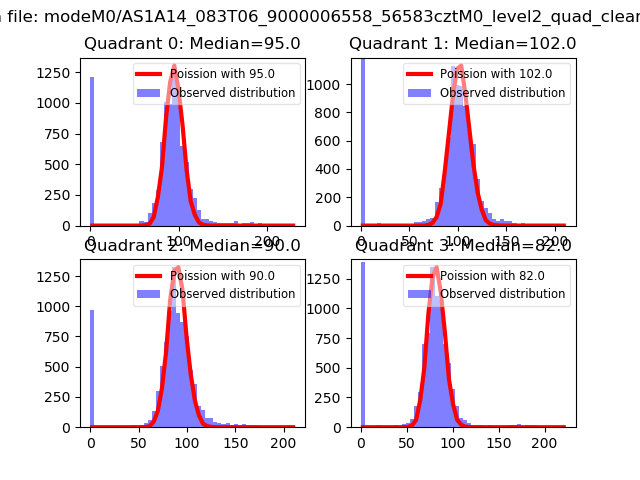
| Comparison with Poisson distribution Blue bars denote a histogram of data divided into 1 sec bins. Red curve is a Poisson curve with rate = median count rate of data. |
 |
 |
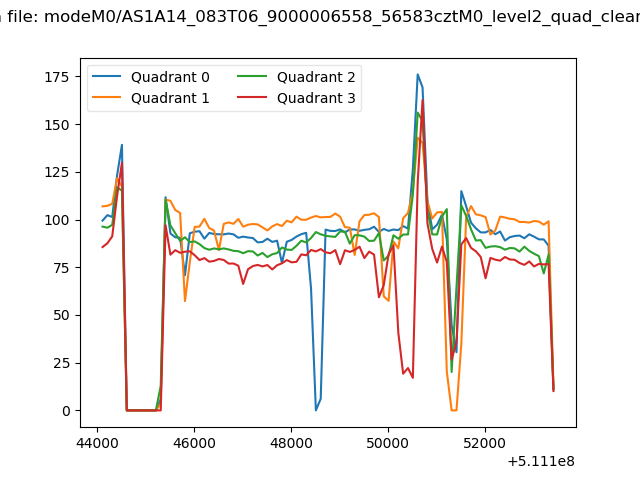
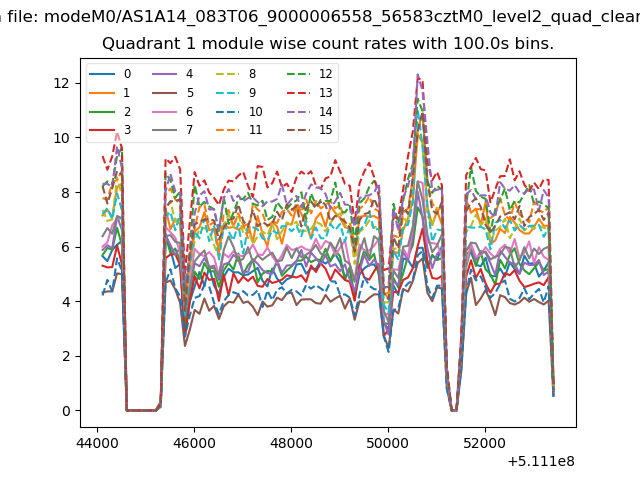
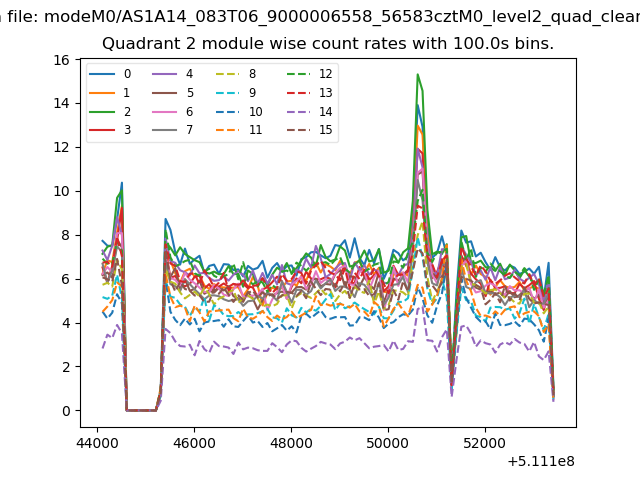
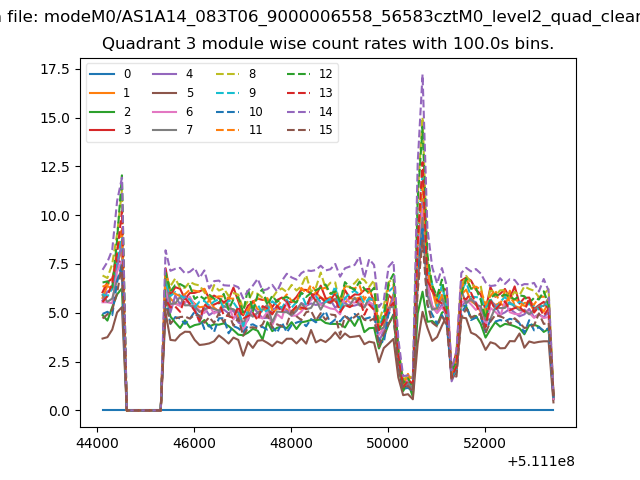
| Quadrant-wise count rates Data is divided into 100 sec bins |
 |
|
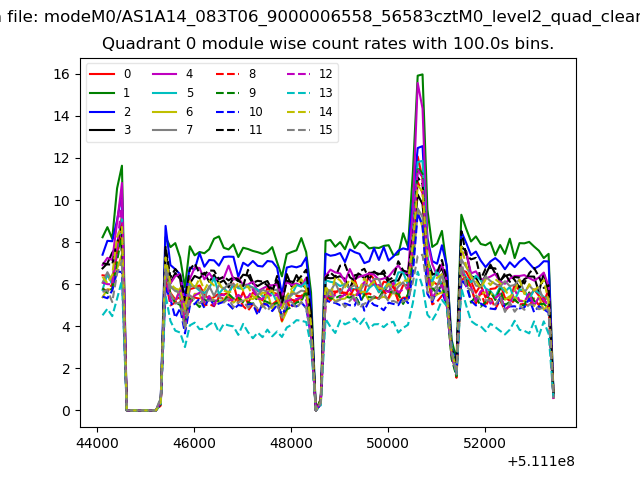
| Module-wise count rates for Quadrant A Data is divided into 100 sec bins |
 |
 |
| Module-wise count rates for Quadrant B Data is divided into 100 sec bins |
 |
 |
| Module-wise count rates for Quadrant C Data is divided into 100 sec bins |
 |
 |
| Module-wise count rates for Quadrant D Data is divided into 100 sec bins |
 |
 |
| Parameter | Plot |
|---|---|
| CZT HV Monitor | 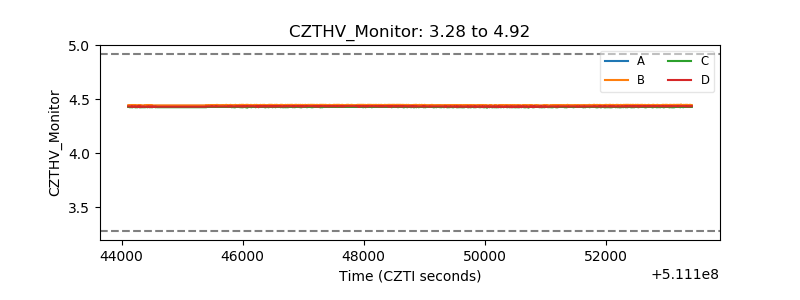 |
| D_VDD | 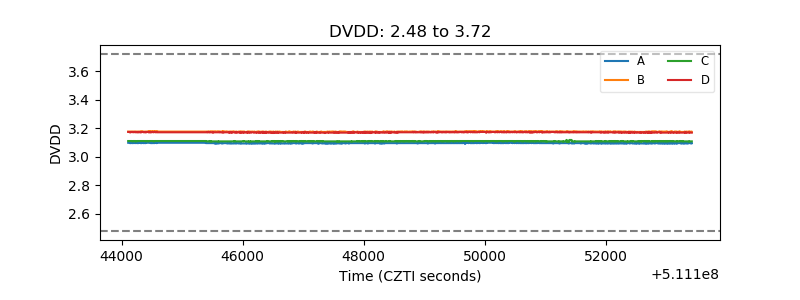 |
| Temperature 1 | 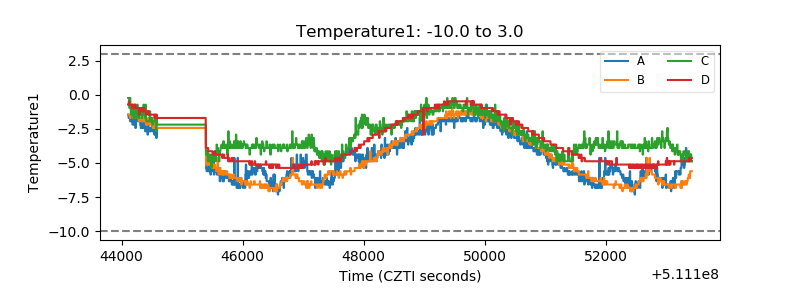 |
| Veto HV Monitor | 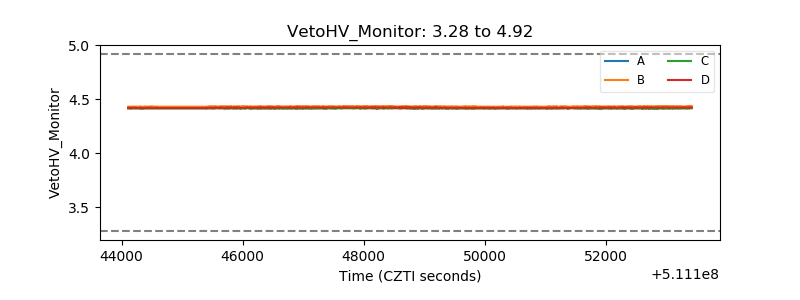 |
| Veto LLD | 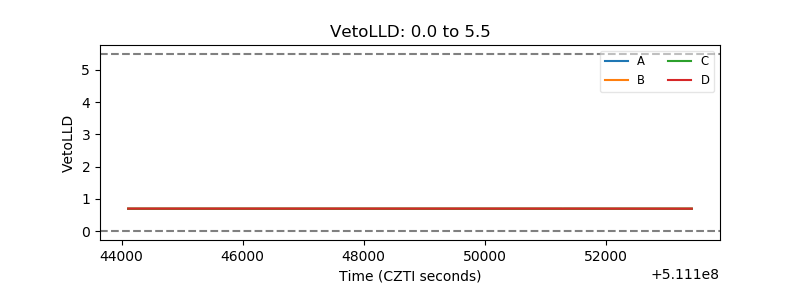 |
| Alpha Counter | 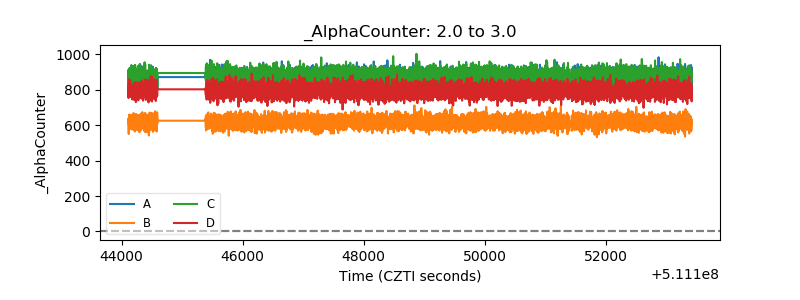 |
| _CPM_Rate | 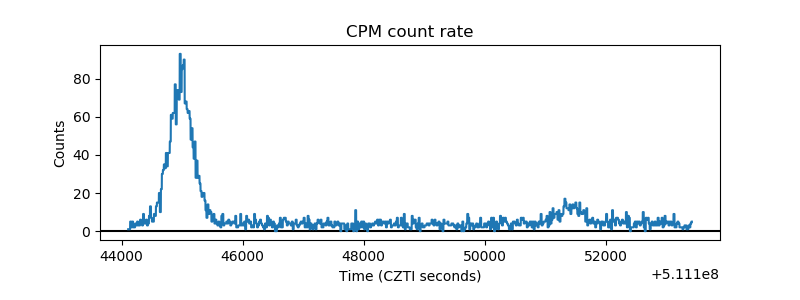 |
| CZT Counter | 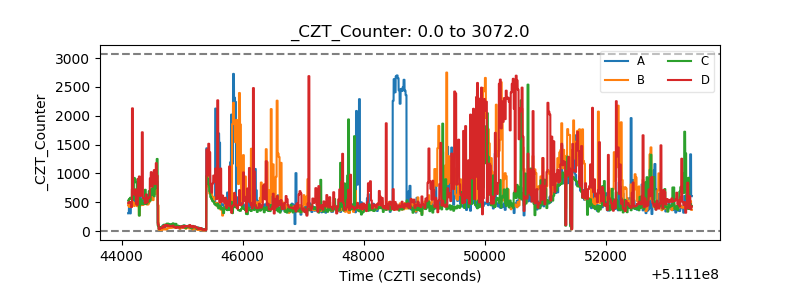 |
| +2.5 Volts monitor |  |
| +5 Volts monitor |  |
| _ROLL_ROT | 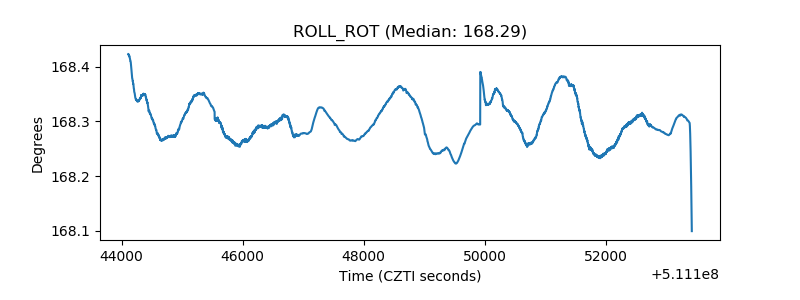 |
| _Roll_DEC | 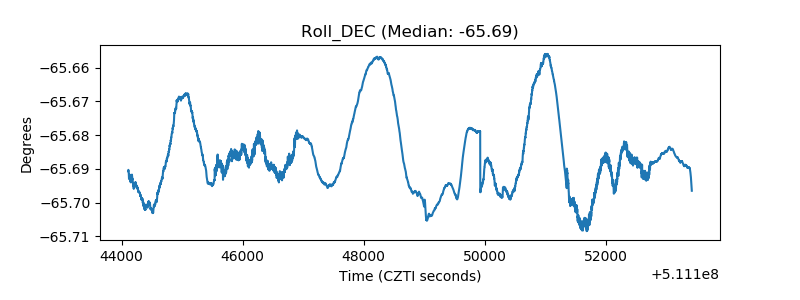 |
| _Roll_RA | 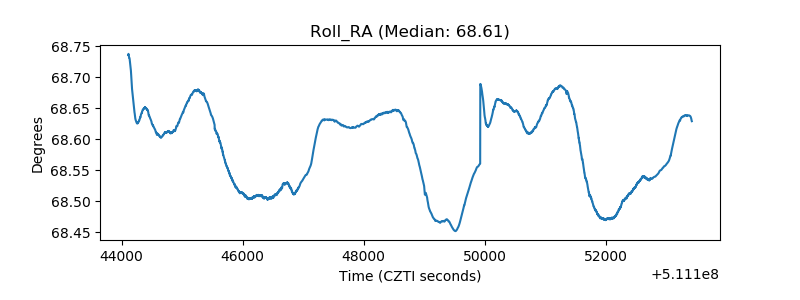 |
| Veto Counter | 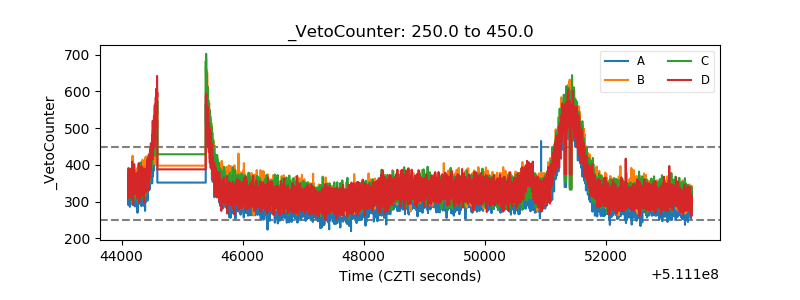 |