| Param | Original file | Final file |
|---|---|---|
| Filename | modeM0/AS1A14_083T06_9000006558_56584cztM0_level2.fits | modeM0/AS1A14_083T06_9000006558_56584cztM0_level2_quad_clean.evt |
| Size (bytes) | 729,760,320 | 101,424,960 |
| Size | 696.0 MB | 96.7 MB |
| Events in quadrant A | 9,615,155 | 524,750 |
| Events in quadrant B | 5,698,783 | 757,312 |
| Events in quadrant C | 3,912,764 | 670,462 |
| Events in quadrant D | 7,188,488 | 581,353 |
| Mode SS | |||
|---|---|---|---|
| Quadrant | BADHDUFLAG | Total packets | Discarded packets |
| A | 0 | 154 | 0 |
| B | 0 | 154 | 0 |
| C | 0 | 154 | 0 |
| D | 0 | 154 | 0 |
| Mode M0 | |||
|---|---|---|---|
| Quadrant | BADHDUFLAG | Total packets | Discarded packets |
| A | 0 | 33938 | 2 |
| B | 0 | 22219 | 0 |
| C | 0 | 17394 | 0 |
| D | 0 | 26741 | 0 |
| Quadrant | Total seconds | Saturated seconds | Saturation percentage |
|---|---|---|---|
| A | 7719 | 2206 | 28.578831% |
| B | 7719 | 397 | 5.143153% |
| C | 7719 | 142 | 1.839617% |
| D | 7720 | 827 | 10.712435% |
Noise dominated data is calculated using 1-second bins in cleaned event files. If a bin has >2000 counts, and if more than 50% of those come from <1% of pixels, then it is considered to be noise-dominated and hence unusable.
| Quadrant | # 1 sec bins | Bins with >0 counts | Bins with >2000 counts | High rate bins dominated by noise | Noise dominated (total time) | Noise dominated (detector-on time) | Marked lightcurve |
|---|---|---|---|---|---|---|---|
| A | 7719 | 7719 | 2021 | 2021 | 26.18% | 26.18% | 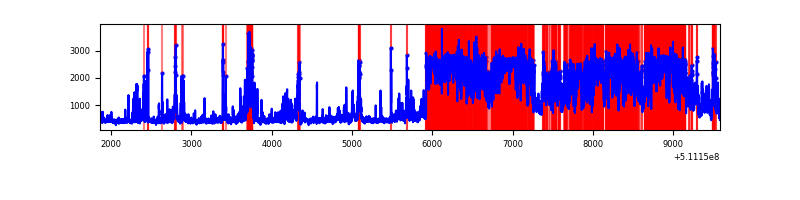 |
| B | 7719 | 7719 | 233 | 233 | 3.02% | 3.02% | 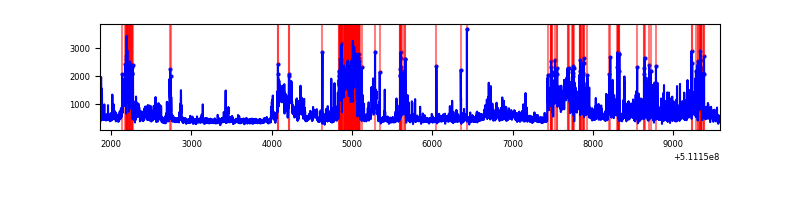 |
| C | 7719 | 7719 | 129 | 129 | 1.67% | 1.67% | 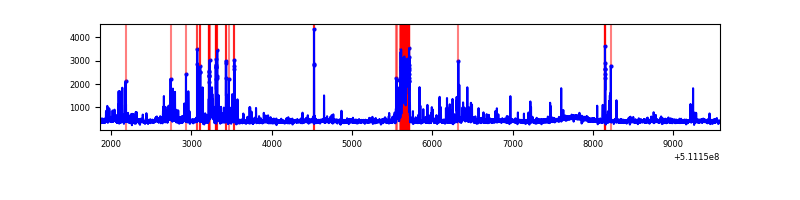 |
| D | 7720 | 7720 | 831 | 831 | 10.76% | 10.76% | 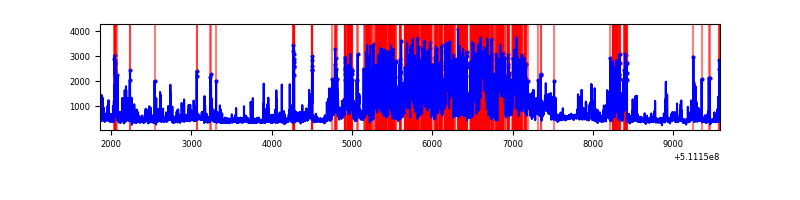 |
Top three noisy pixels from each quadrant. If the there are fewer than three noisy pixels in the level2.evt file, extra rows are filled as -1
| Pixel properties | Quadrant properties | ||||||
|---|---|---|---|---|---|---|---|
| Quadrant | DetID | PixID | Counts | Sigma | Mean | Median | Sigma |
| A | 7 | 64 | 5184763 | 28734.36 | 723 | 706 | 180.4 |
| A | 12 | 3 | 868203 | 4808.39 | 723 | 706 | 180.4 |
| A | 4 | 249 | 177385 | 979.3 | 723 | 706 | 180.4 |
| B | 5 | 185 | 2231433 | 13083.35 | 804 | 775 | 170.5 |
| B | 8 | 128 | 78428 | 455.45 | 804 | 775 | 170.5 |
| B | 4 | 21 | 39097 | 224.77 | 804 | 775 | 170.5 |
| C | 15 | 230 | 304479 | 1414.2 | 787 | 780 | 214.7 |
| C | 5 | 250 | 199911 | 927.27 | 787 | 780 | 214.7 |
| C | 14 | 254 | 172178 | 798.13 | 787 | 780 | 214.7 |
| D | 6 | 239 | 1409312 | 6732.2 | 747 | 714 | 209.2 |
| D | 8 | 240 | 797446 | 3807.87 | 747 | 714 | 209.2 |
| D | 2 | 249 | 630103 | 3008.08 | 747 | 714 | 209.2 |
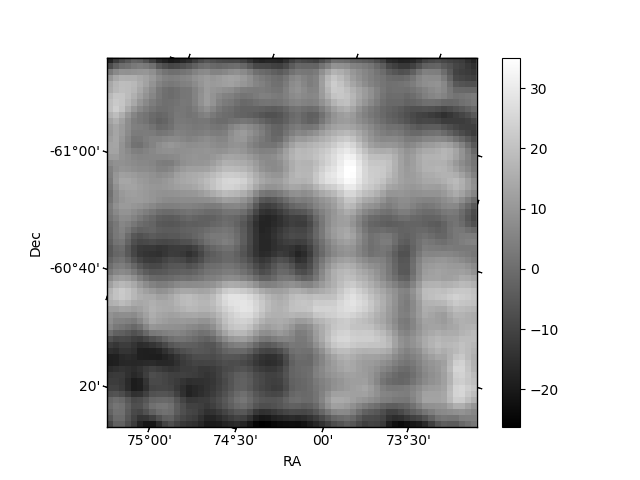
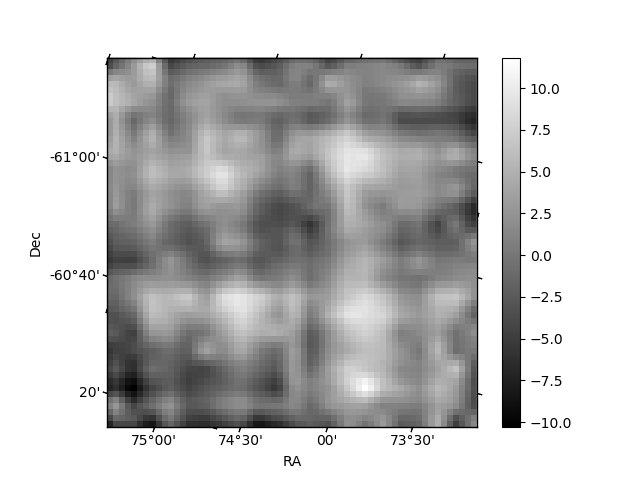
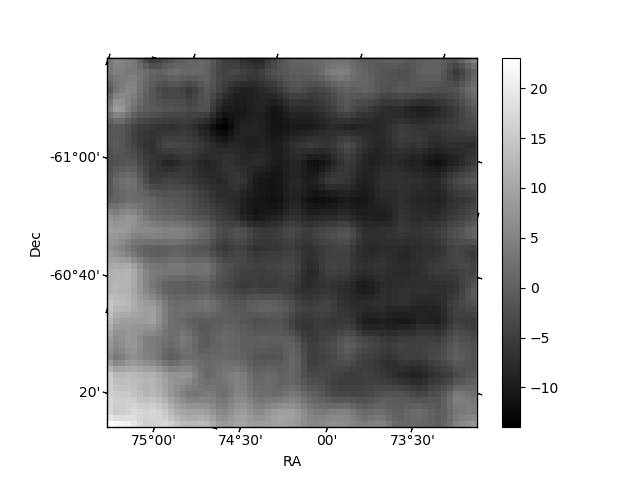
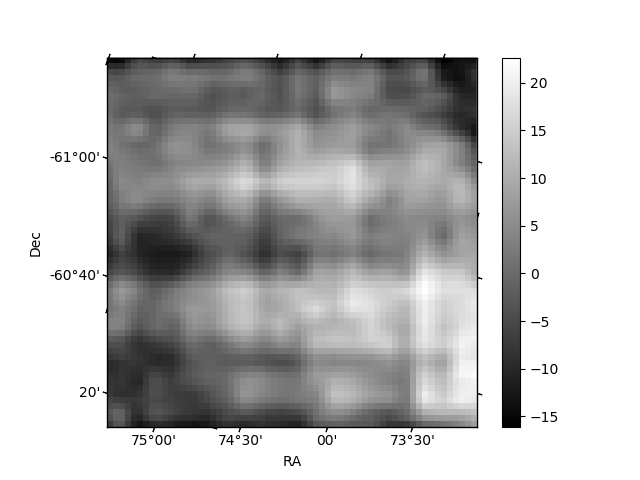
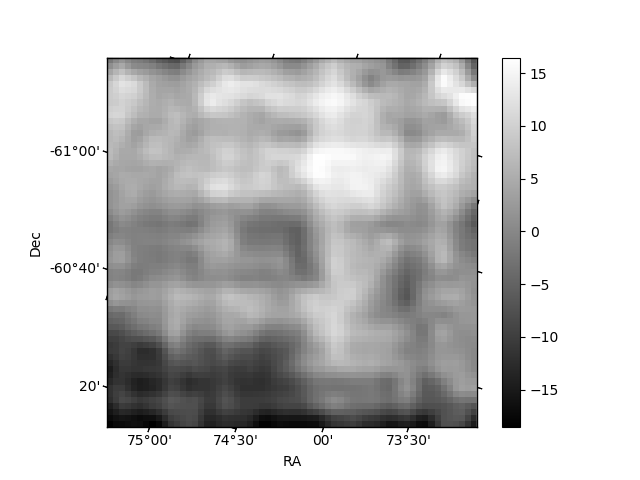
Histogram calculated using DETX and DETY for each event in the final _common_clean file
| Quadrant A | 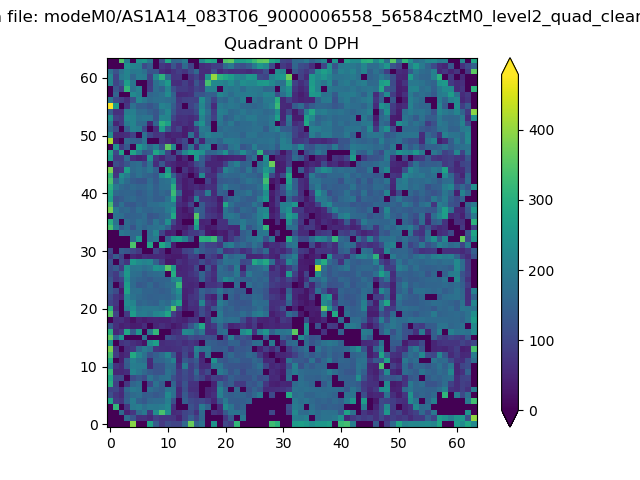 |
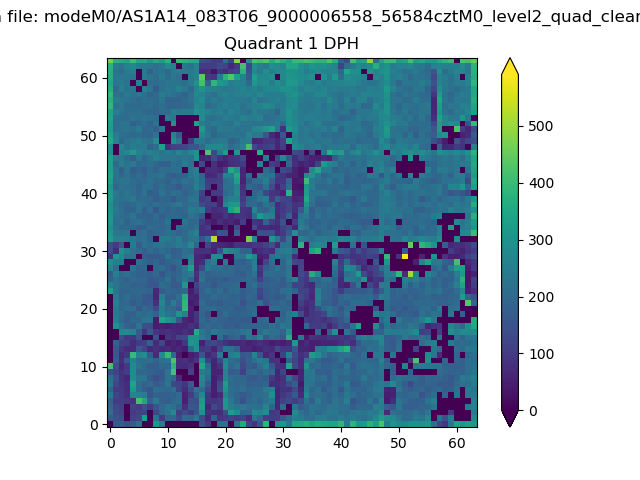 |
Quadrant B |
|---|---|---|---|
| Quadrant D | 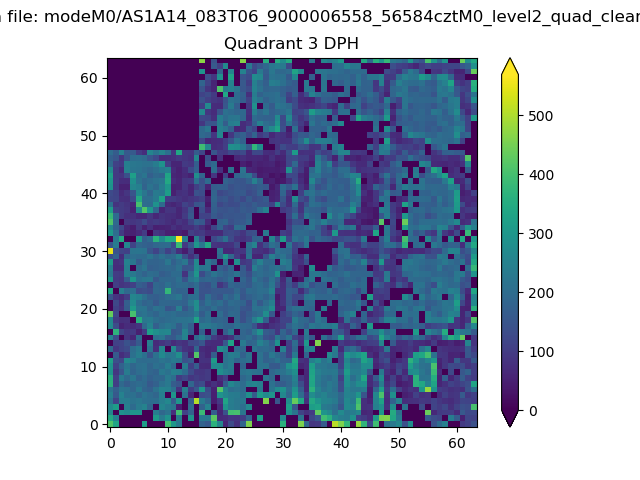 |
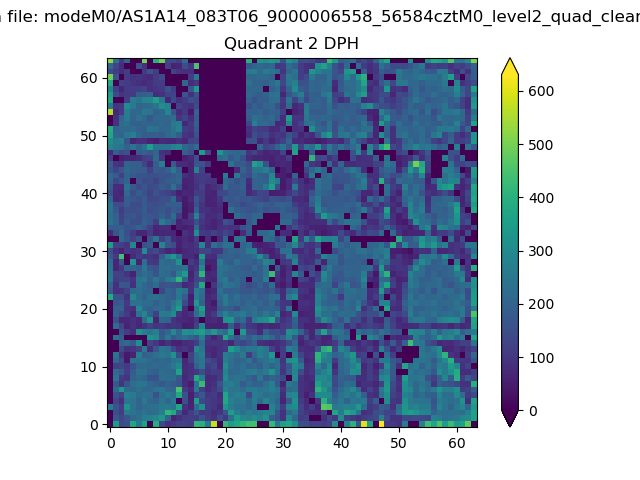 |
Quadrant C |
| Plot type | Count rate plots | Images |
|---|---|---|
| Comparison with Poisson distribution Blue bars denote a histogram of data divided into 1 sec bins. Red curve is a Poisson curve with rate = median count rate of data. |
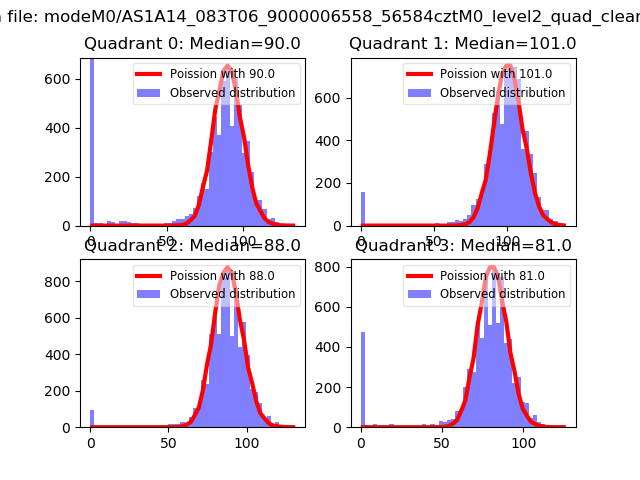 |
 |
| Quadrant-wise count rates Data is divided into 100 sec bins |
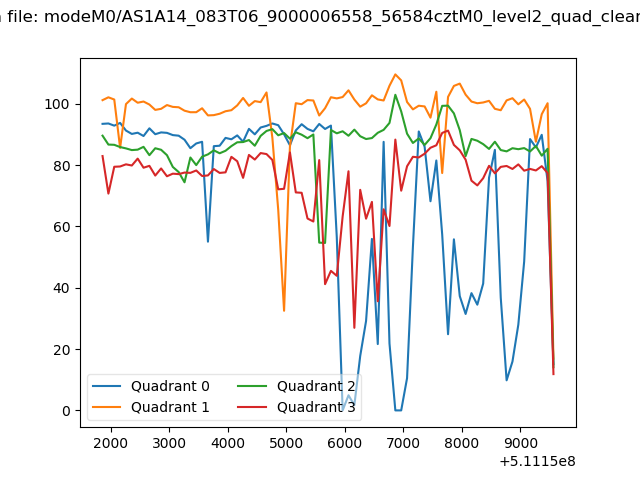 |
|
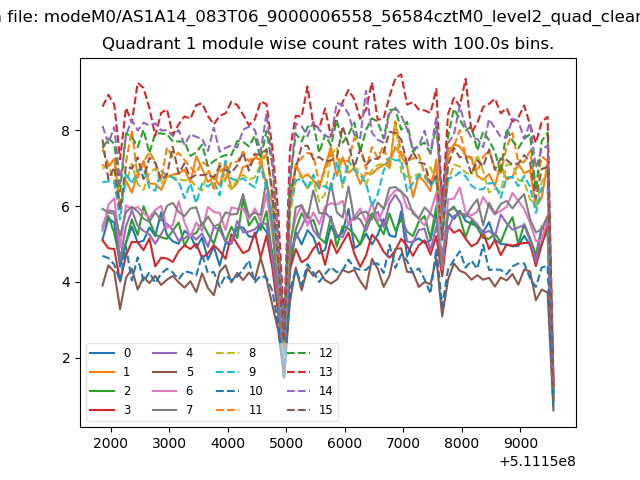
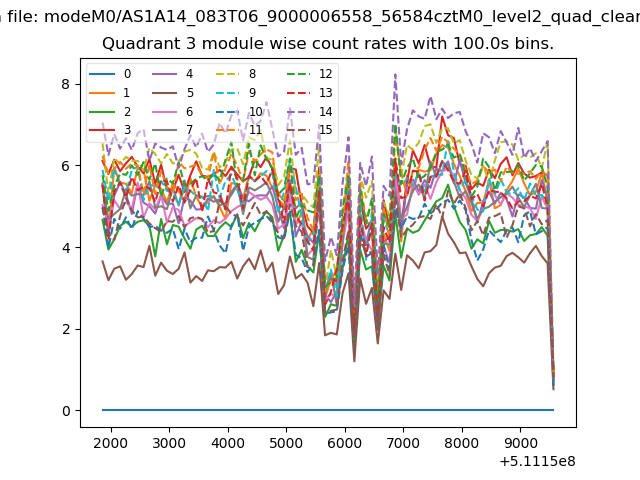
| Module-wise count rates for Quadrant A Data is divided into 100 sec bins |
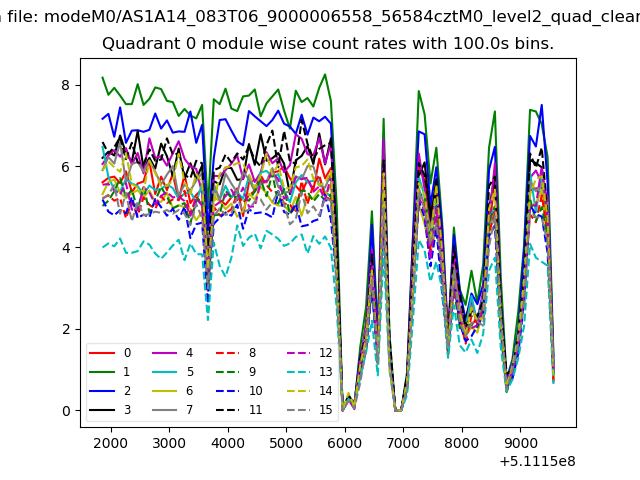 |
 |
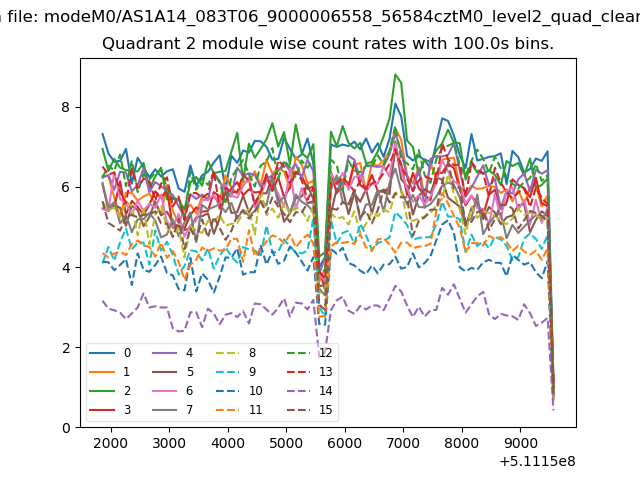
| Module-wise count rates for Quadrant B Data is divided into 100 sec bins |
 |
 |
| Module-wise count rates for Quadrant C Data is divided into 100 sec bins |
 |
 |
| Module-wise count rates for Quadrant D Data is divided into 100 sec bins |
 |
 |
| Parameter | Plot |
|---|---|
| CZT HV Monitor | 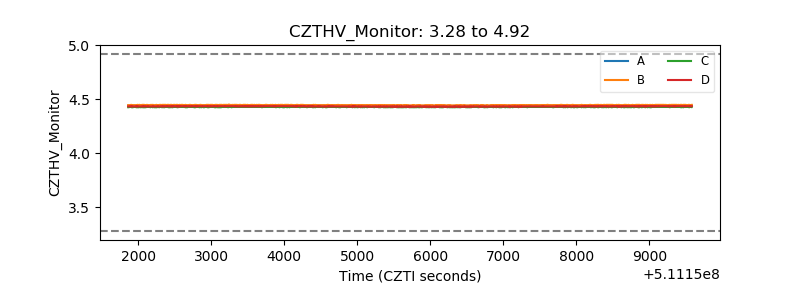 |
| D_VDD | 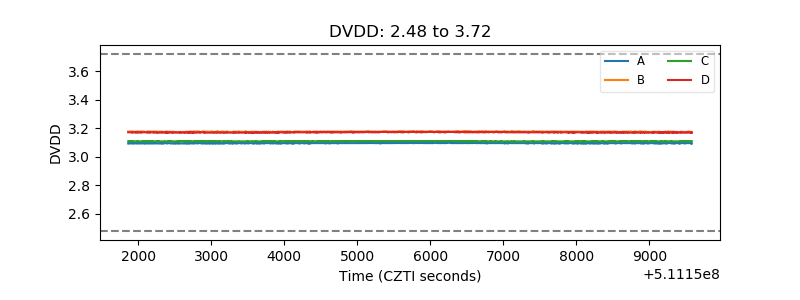 |
| Temperature 1 | 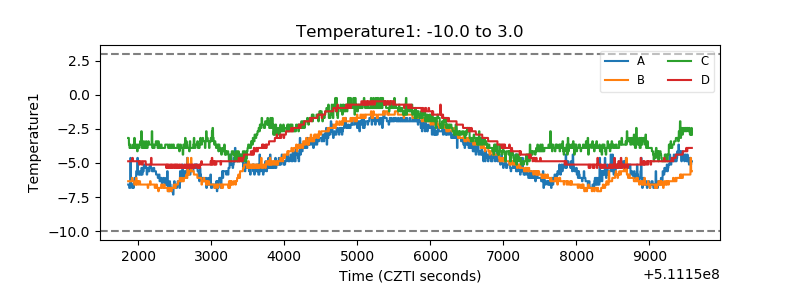 |
| Veto HV Monitor | 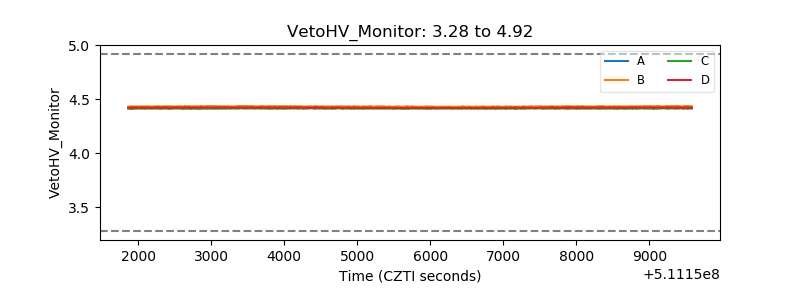 |
| Veto LLD | 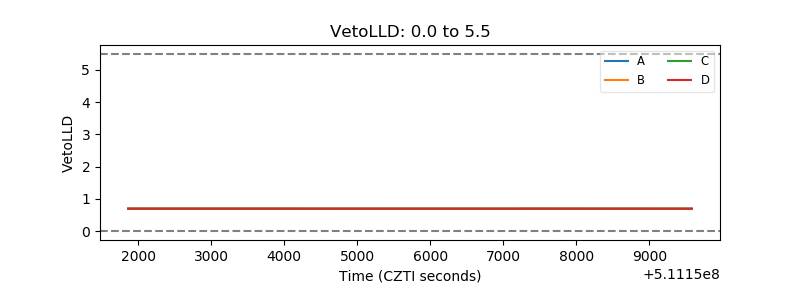 |
| Alpha Counter | 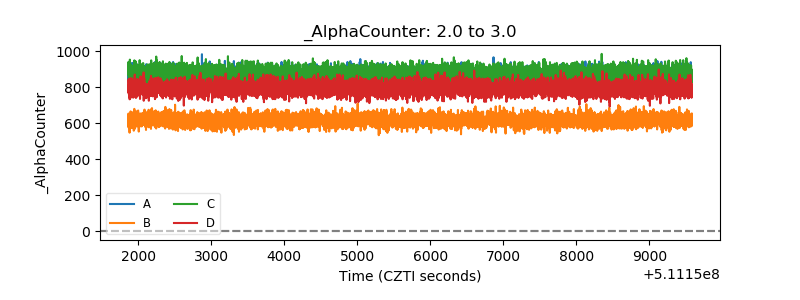 |
| _CPM_Rate | 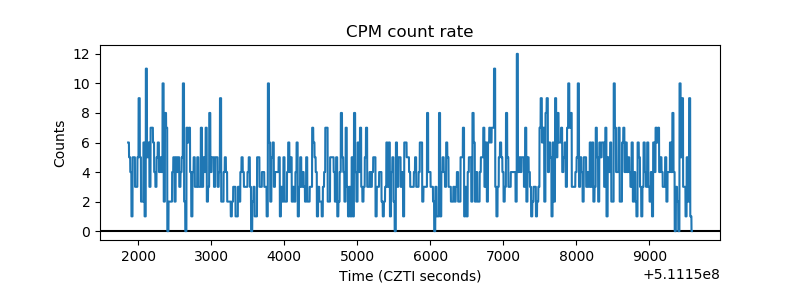 |
| CZT Counter | 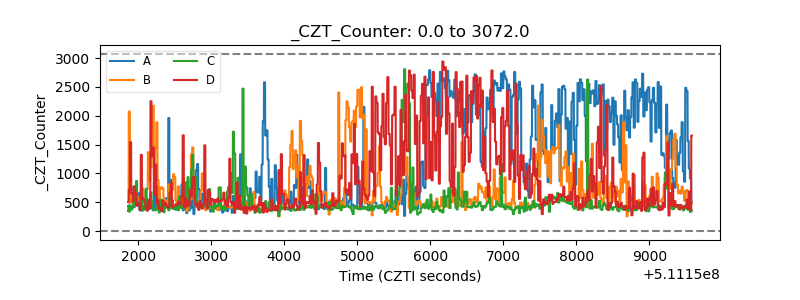 |
| +2.5 Volts monitor |  |
| +5 Volts monitor |  |
| _ROLL_ROT | 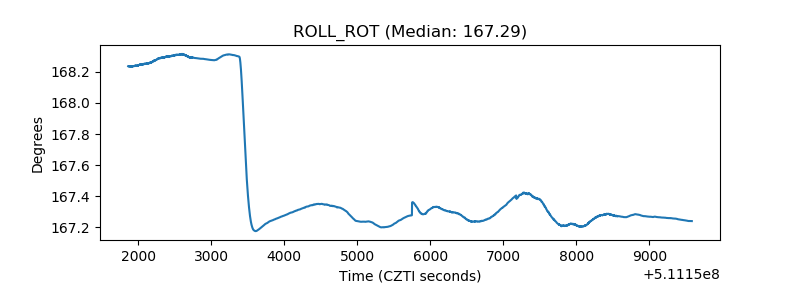 |
| _Roll_DEC | 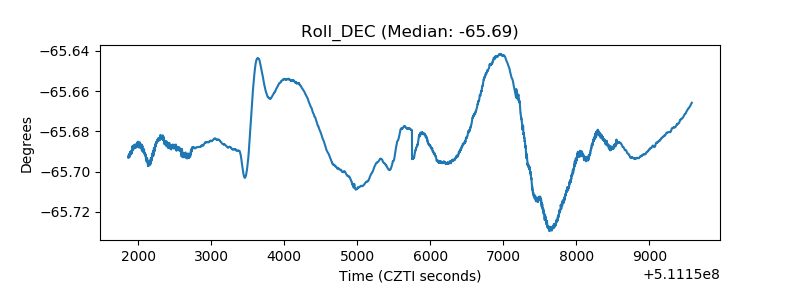 |
| _Roll_RA | 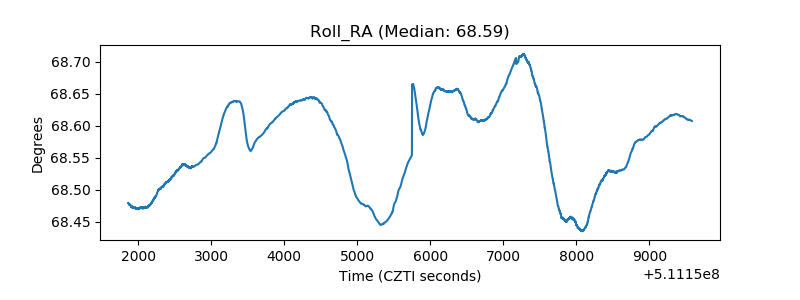 |
| Veto Counter | 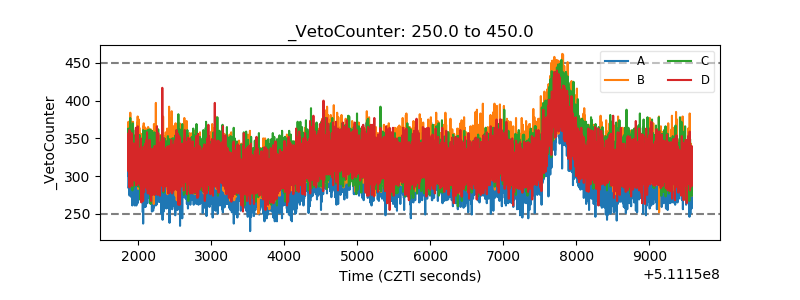 |