| Param | Original file | Final file |
|---|---|---|
| Filename | modeM0/AS1A14_083T06_9000006558_56585cztM0_level2.fits | modeM0/AS1A14_083T06_9000006558_56585cztM0_level2_quad_clean.evt |
| Size (bytes) | 706,703,040 | 92,796,480 |
| Size | 674.0 MB | 88.5 MB |
| Events in quadrant A | 12,344,587 | 363,930 |
| Events in quadrant B | 4,196,025 | 731,623 |
| Events in quadrant C | 3,387,195 | 644,307 |
| Events in quadrant D | 5,676,065 | 570,362 |
| Mode SS | |||
|---|---|---|---|
| Quadrant | BADHDUFLAG | Total packets | Discarded packets |
| A | 0 | 144 | 0 |
| B | 0 | 144 | 0 |
| C | 0 | 144 | 0 |
| D | 0 | 144 | 0 |
| Mode M0 | |||
|---|---|---|---|
| Quadrant | BADHDUFLAG | Total packets | Discarded packets |
| A | 0 | 41629 | 0 |
| B | 0 | 17239 | 0 |
| C | 0 | 15474 | 0 |
| D | 0 | 21861 | 0 |
| Quadrant | Total seconds | Saturated seconds | Saturation percentage |
|---|---|---|---|
| A | 7167 | 3564 | 49.727920% |
| B | 7168 | 78 | 1.088170% |
| C | 7168 | 58 | 0.809152% |
| D | 7168 | 551 | 7.686942% |
Noise dominated data is calculated using 1-second bins in cleaned event files. If a bin has >2000 counts, and if more than 50% of those come from <1% of pixels, then it is considered to be noise-dominated and hence unusable.
| Quadrant | # 1 sec bins | Bins with >0 counts | Bins with >2000 counts | High rate bins dominated by noise | Noise dominated (total time) | Noise dominated (detector-on time) | Marked lightcurve |
|---|---|---|---|---|---|---|---|
| A | 7167 | 7167 | 3211 | 3211 | 44.80% | 44.80% | 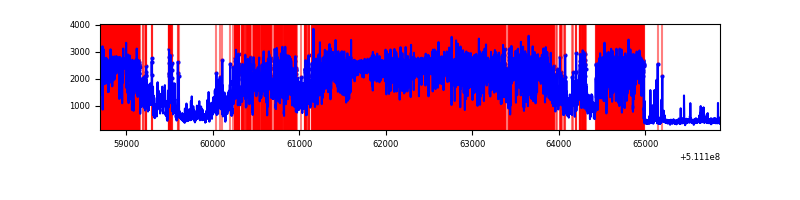 |
| B | 7168 | 7168 | 30 | 30 | 0.42% | 0.42% | 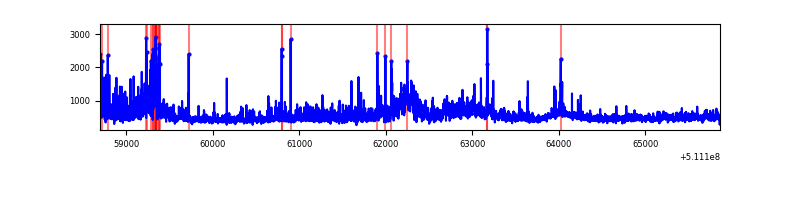 |
| C | 7168 | 7168 | 47 | 47 | 0.66% | 0.66% | 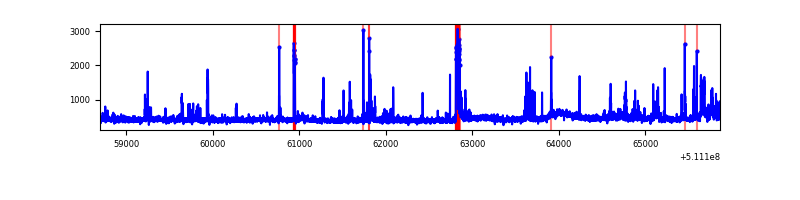 |
| D | 7168 | 7168 | 531 | 531 | 7.41% | 7.41% | 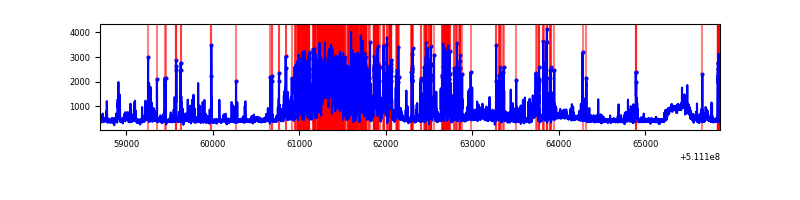 |
Top three noisy pixels from each quadrant. If the there are fewer than three noisy pixels in the level2.evt file, extra rows are filled as -1
| Pixel properties | Quadrant properties | ||||||
|---|---|---|---|---|---|---|---|
| Quadrant | DetID | PixID | Counts | Sigma | Mean | Median | Sigma |
| A | 7 | 64 | 9354970 | 60974.0 | 618 | 602 | 153.4 |
| A | 0 | 8 | 232524 | 1511.72 | 618 | 602 | 153.4 |
| A | 4 | 249 | 132275 | 858.27 | 618 | 602 | 153.4 |
| B | 4 | 21 | 597558 | 3686.43 | 757 | 729 | 161.9 |
| B | 5 | 185 | 491423 | 3030.87 | 757 | 729 | 161.9 |
| B | 10 | 247 | 21021 | 125.34 | 757 | 729 | 161.9 |
| C | 5 | 250 | 139566 | 684.49 | 743 | 735 | 202.8 |
| C | 12 | 252 | 126737 | 621.24 | 743 | 735 | 202.8 |
| C | 15 | 230 | 106749 | 522.69 | 743 | 735 | 202.8 |
| D | 6 | 239 | 998887 | 4948.23 | 716 | 685 | 201.7 |
| D | 2 | 31 | 520245 | 2575.53 | 716 | 685 | 201.7 |
| D | 2 | 249 | 517311 | 2560.99 | 716 | 685 | 201.7 |
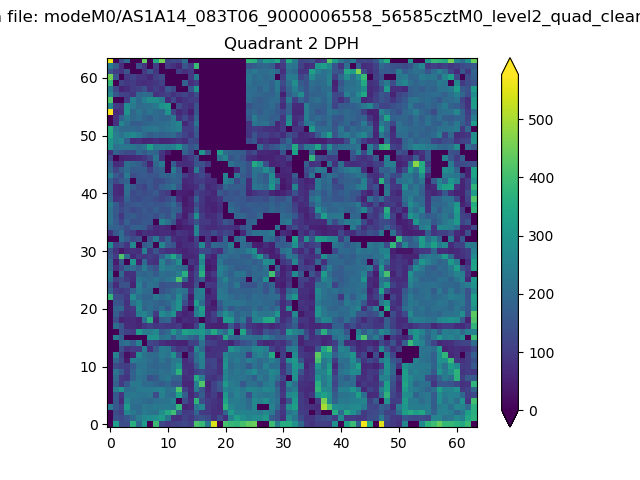
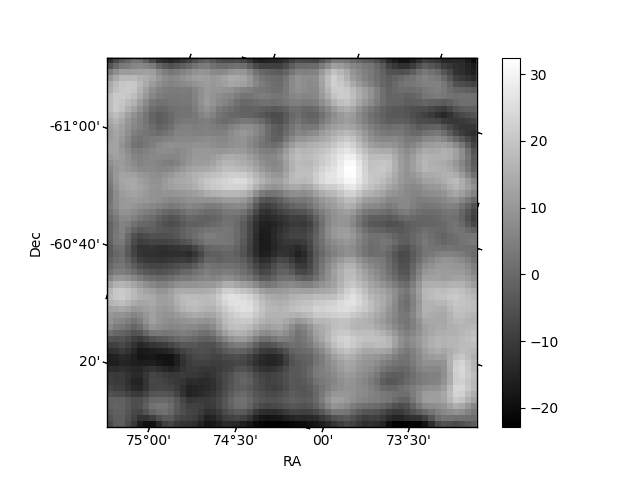
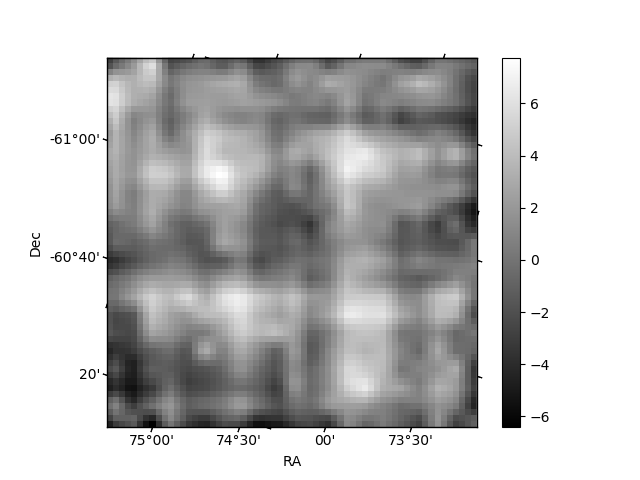
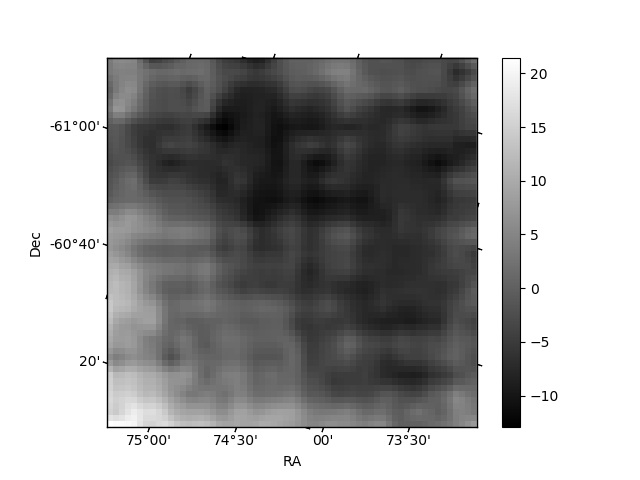
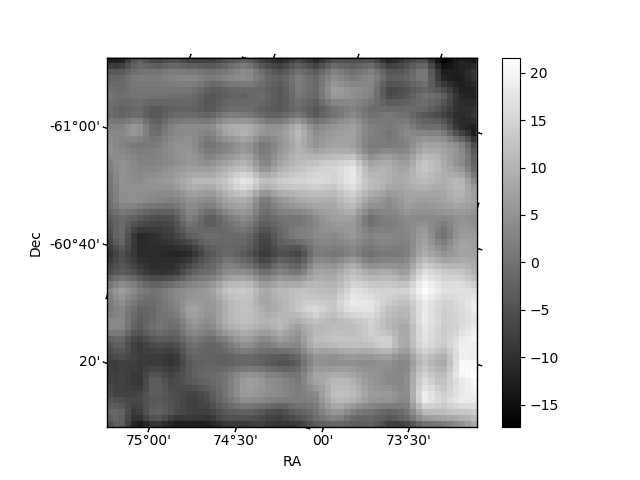
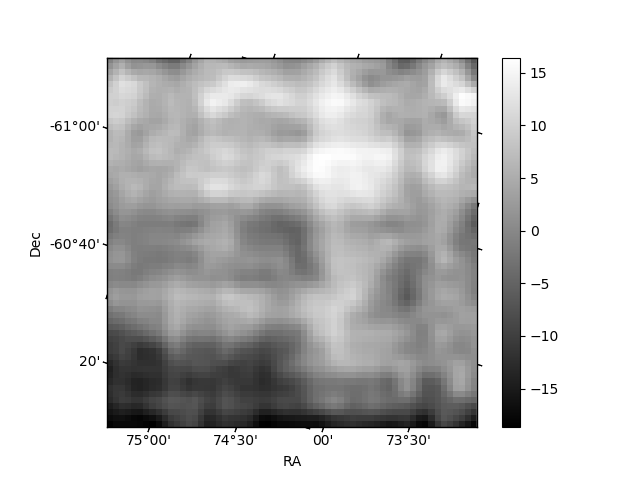
Histogram calculated using DETX and DETY for each event in the final _common_clean file
| Quadrant A | 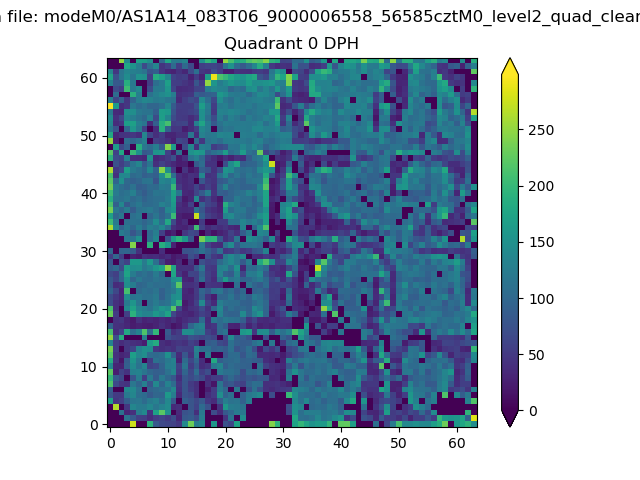 |
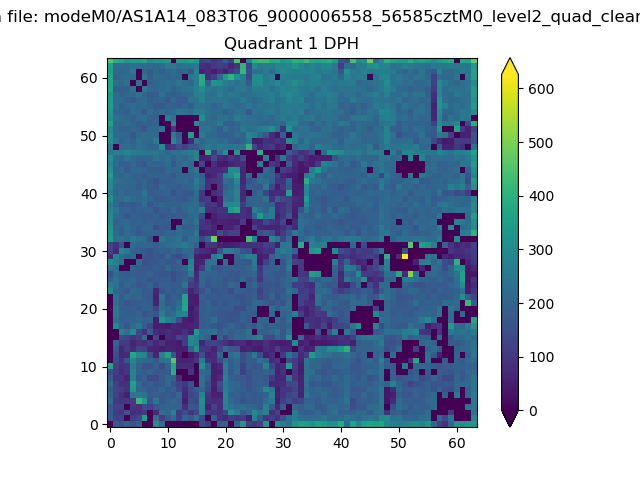 |
Quadrant B |
|---|---|---|---|
| Quadrant D | 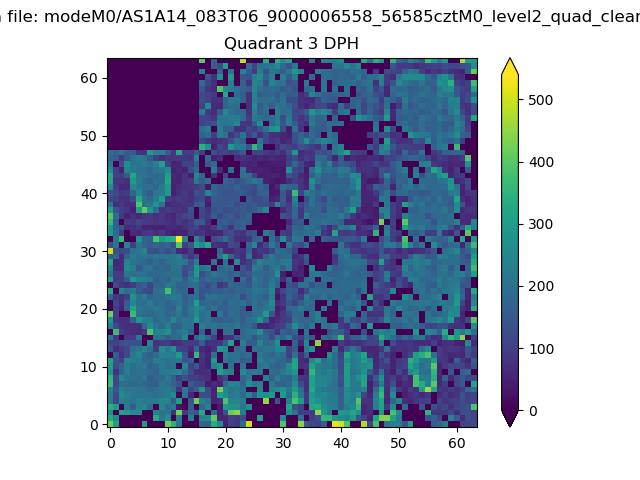 |
 |
Quadrant C |
| Plot type | Count rate plots | Images |
|---|---|---|
| Comparison with Poisson distribution Blue bars denote a histogram of data divided into 1 sec bins. Red curve is a Poisson curve with rate = median count rate of data. |
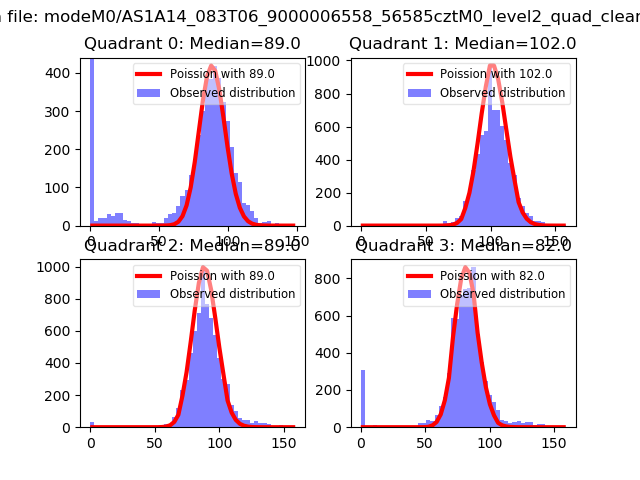 |
 |
| Quadrant-wise count rates Data is divided into 100 sec bins |
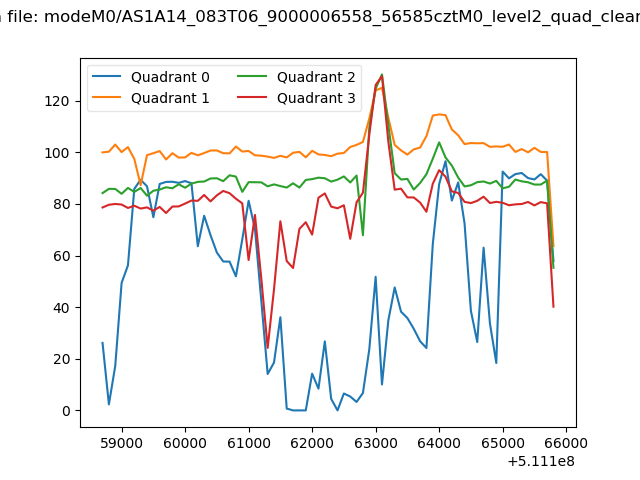 |
|
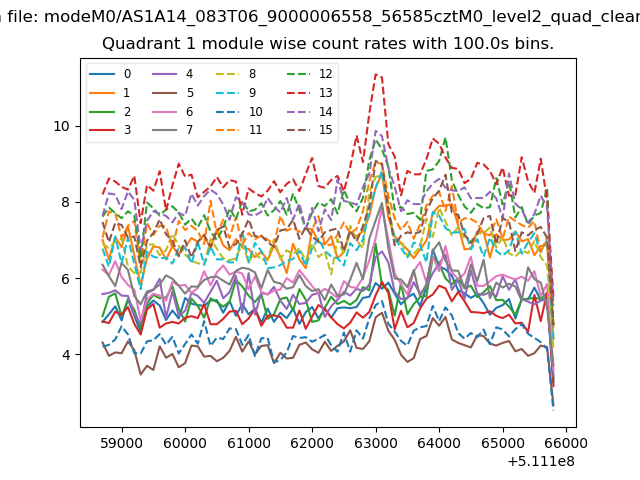
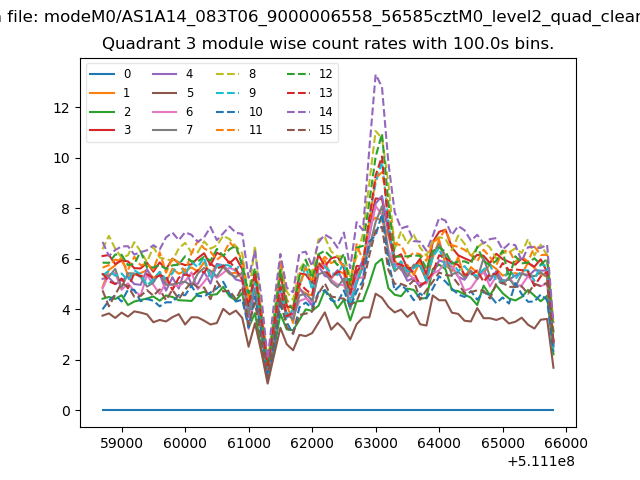
| Module-wise count rates for Quadrant A Data is divided into 100 sec bins |
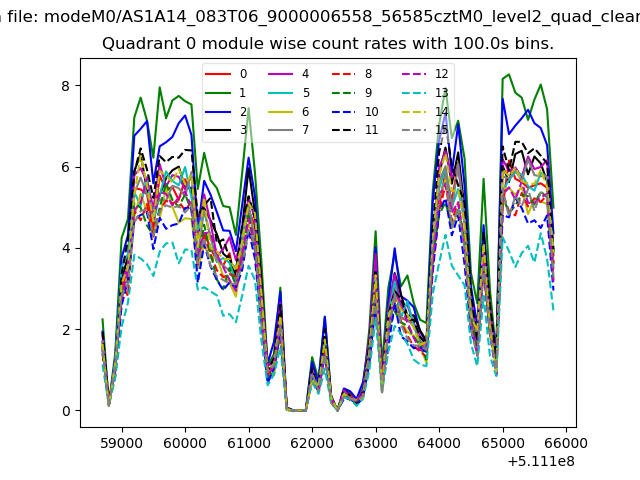 |
 |
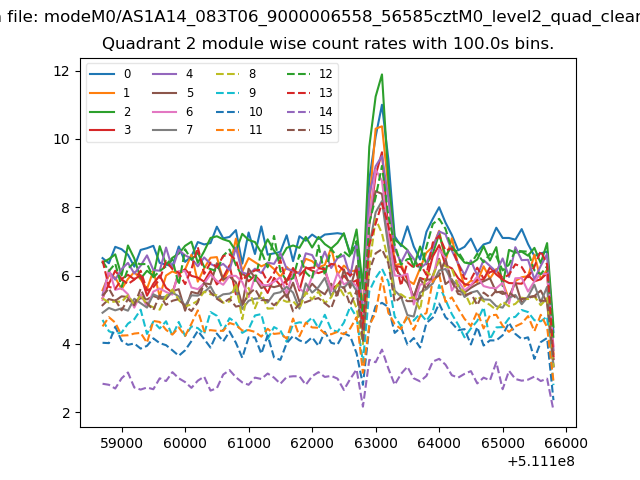
| Module-wise count rates for Quadrant B Data is divided into 100 sec bins |
 |
 |
| Module-wise count rates for Quadrant C Data is divided into 100 sec bins |
 |
 |
| Module-wise count rates for Quadrant D Data is divided into 100 sec bins |
 |
 |
| Parameter | Plot |
|---|---|
| CZT HV Monitor | 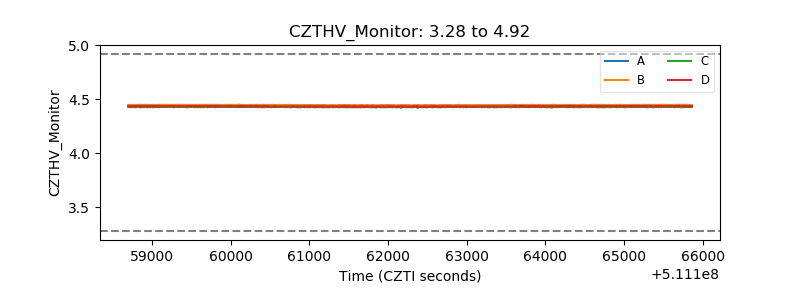 |
| D_VDD | 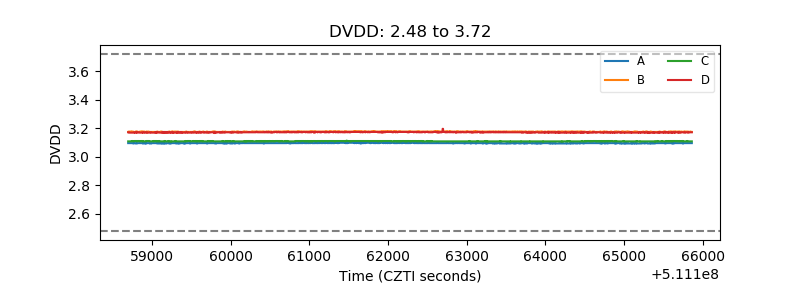 |
| Temperature 1 | 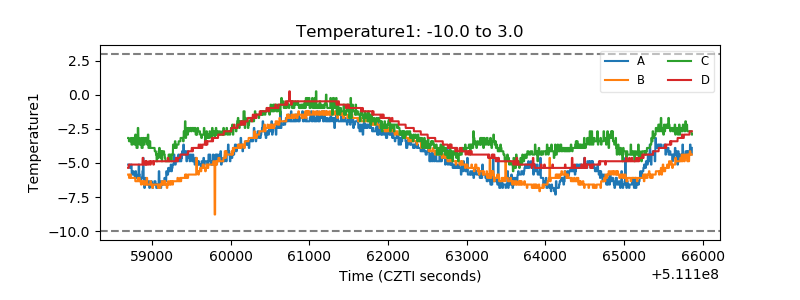 |
| Veto HV Monitor | 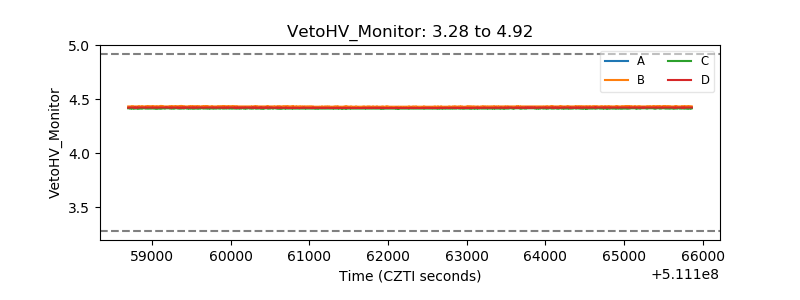 |
| Veto LLD | 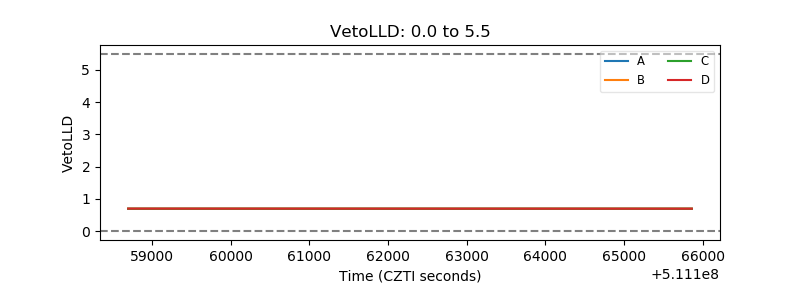 |
| Alpha Counter | 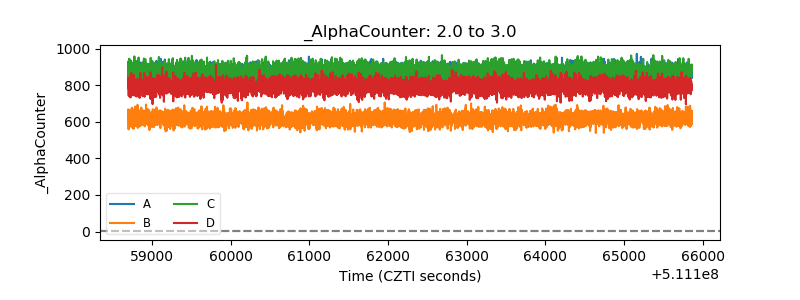 |
| _CPM_Rate | 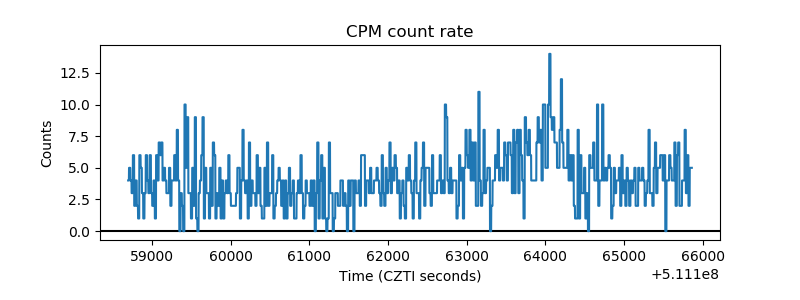 |
| CZT Counter | 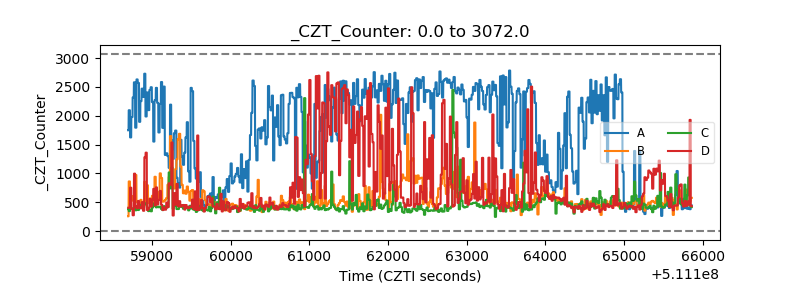 |
| +2.5 Volts monitor |  |
| +5 Volts monitor |  |
| _ROLL_ROT | 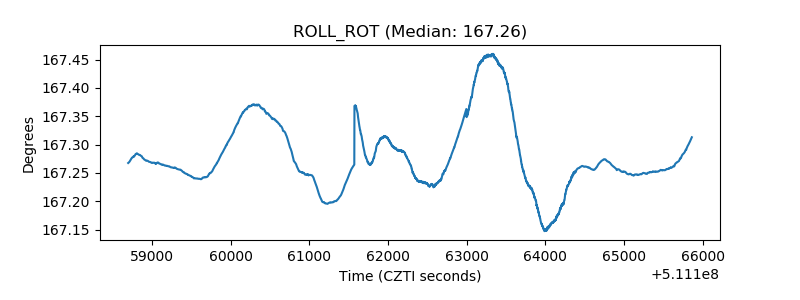 |
| _Roll_DEC | 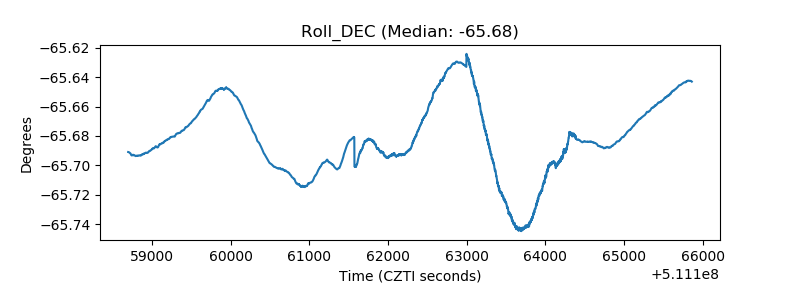 |
| _Roll_RA | 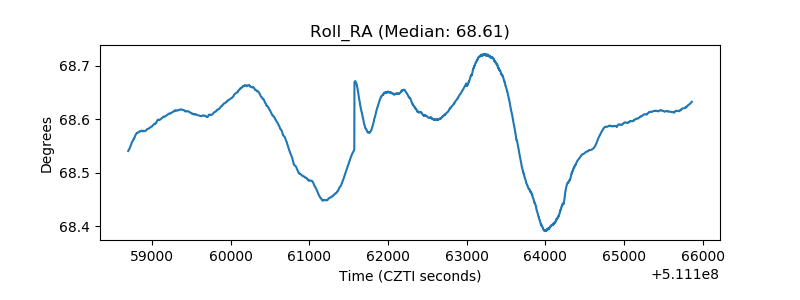 |
| Veto Counter | 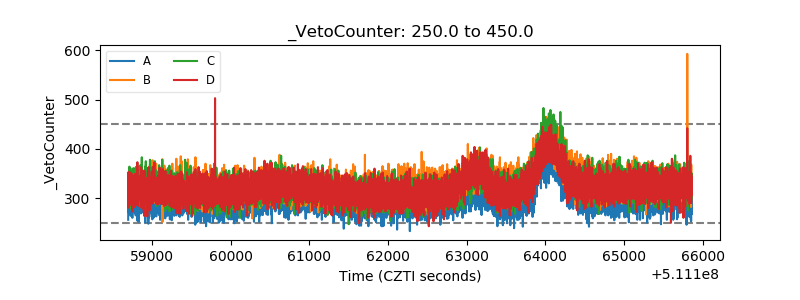 |