| Param | Original file | Final file |
|---|---|---|
| Filename | modeM0/AS1A14_083T06_9000006558_56588cztM0_level2.fits | modeM0/AS1A14_083T06_9000006558_56588cztM0_level2_quad_clean.evt |
| Size (bytes) | 1,828,221,120 | 254,782,080 |
| Size | 1.7 GB | 243.0 MB |
| Events in quadrant A | 26,494,167 | 1,296,656 |
| Events in quadrant B | 10,577,060 | 1,947,629 |
| Events in quadrant C | 13,670,495 | 1,565,609 |
| Events in quadrant D | 15,416,932 | 1,551,103 |
| Mode SS | |||
|---|---|---|---|
| Quadrant | BADHDUFLAG | Total packets | Discarded packets |
| A | 0 | 396 | 0 |
| B | 0 | 396 | 0 |
| C | 0 | 396 | 0 |
| D | 0 | 396 | 0 |
| Mode M9 | |||
|---|---|---|---|
| Quadrant | BADHDUFLAG | Total packets | Discarded packets |
| A | 0 | 10 | 0 |
| B | 0 | 10 | 0 |
| C | 0 | 10 | 0 |
| D | 0 | 10 | 0 |
| Mode M0 | |||
|---|---|---|---|
| Quadrant | BADHDUFLAG | Total packets | Discarded packets |
| A | 0 | 92309 | 4 |
| B | 0 | 44396 | 2 |
| C | 0 | 54966 | 2 |
| D | 0 | 59341 | 2 |
| Quadrant | Total seconds | Saturated seconds | Saturation percentage |
|---|---|---|---|
| A | 19637 | 5711 | 29.082854% |
| B | 19637 | 475 | 2.418903% |
| C | 19637 | 1921 | 9.782553% |
| D | 19638 | 1315 | 6.696201% |
Noise dominated data is calculated using 1-second bins in cleaned event files. If a bin has >2000 counts, and if more than 50% of those come from <1% of pixels, then it is considered to be noise-dominated and hence unusable.
| Quadrant | # 1 sec bins | Bins with >0 counts | Bins with >2000 counts | High rate bins dominated by noise | Noise dominated (total time) | Noise dominated (detector-on time) | Marked lightcurve |
|---|---|---|---|---|---|---|---|
| A | 20516 | 19636 | 4778 | 4778 | 23.29% | 24.33% | 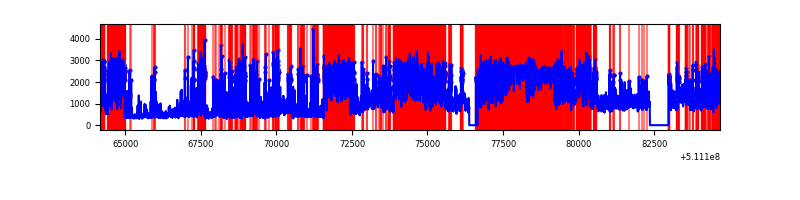 |
| B | 20517 | 19637 | 47 | 47 | 0.23% | 0.24% | 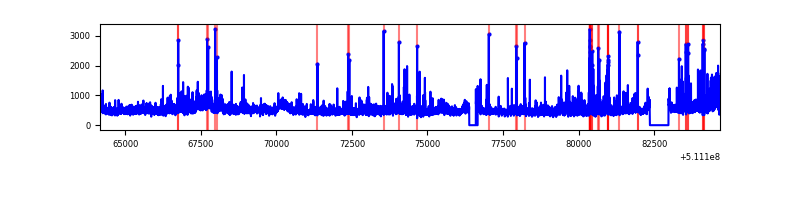 |
| C | 20517 | 19639 | 1466 | 1466 | 7.15% | 7.46% | 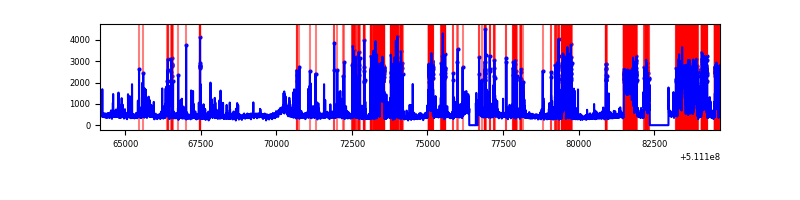 |
| D | 20518 | 19639 | 1156 | 1156 | 5.63% | 5.89% | 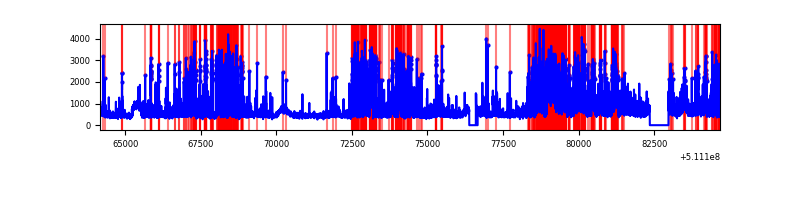 |
Top three noisy pixels from each quadrant. If the there are fewer than three noisy pixels in the level2.evt file, extra rows are filled as -1
| Pixel properties | Quadrant properties | ||||||
|---|---|---|---|---|---|---|---|
| Quadrant | DetID | PixID | Counts | Sigma | Mean | Median | Sigma |
| A | 7 | 64 | 15288859 | 33181.07 | 1880 | 1832 | 460.7 |
| A | 4 | 249 | 2018527 | 4377.31 | 1880 | 1832 | 460.7 |
| A | 4 | 159 | 633649 | 1371.38 | 1880 | 1832 | 460.7 |
| B | 5 | 185 | 994524 | 2222.3 | 2107 | 2024 | 446.6 |
| B | 4 | 21 | 767988 | 1715.06 | 2107 | 2024 | 446.6 |
| B | 4 | 206 | 102753 | 225.54 | 2107 | 2024 | 446.6 |
| C | 15 | 230 | 2727849 | 5074.46 | 1983 | 1966 | 537.2 |
| C | 13 | 3 | 1584098 | 2945.27 | 1983 | 1966 | 537.2 |
| C | 5 | 250 | 1030486 | 1914.68 | 1983 | 1966 | 537.2 |
| D | 6 | 239 | 1888812 | 3296.63 | 2031 | 1937 | 572.4 |
| D | 10 | 199 | 1416282 | 2471.05 | 2031 | 1937 | 572.4 |
| D | 2 | 249 | 1368341 | 2387.29 | 2031 | 1937 | 572.4 |
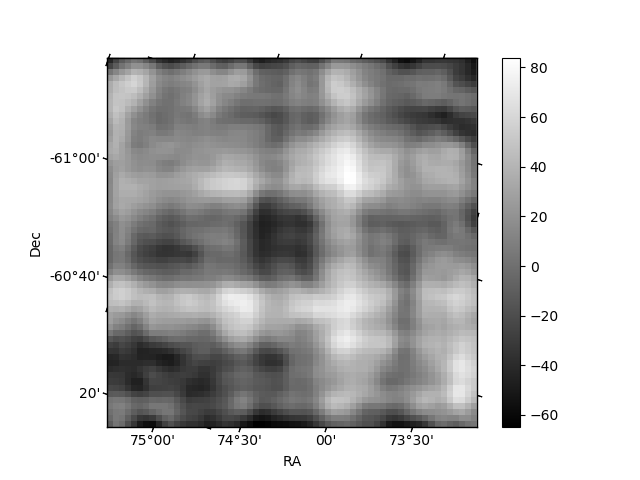
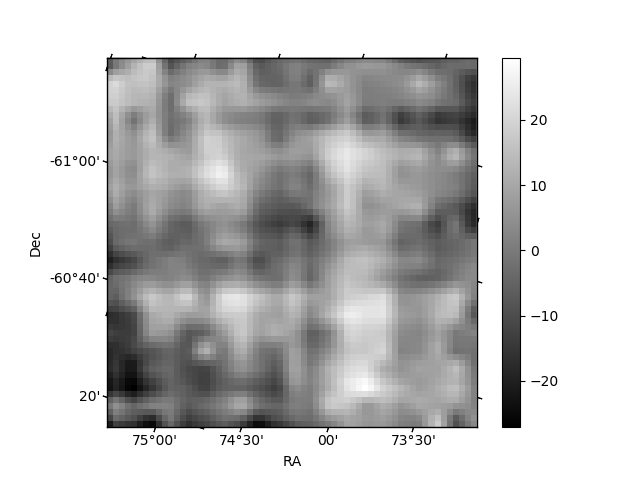
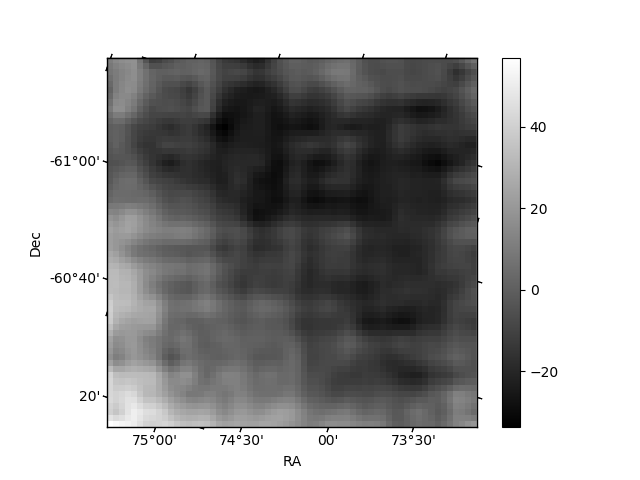
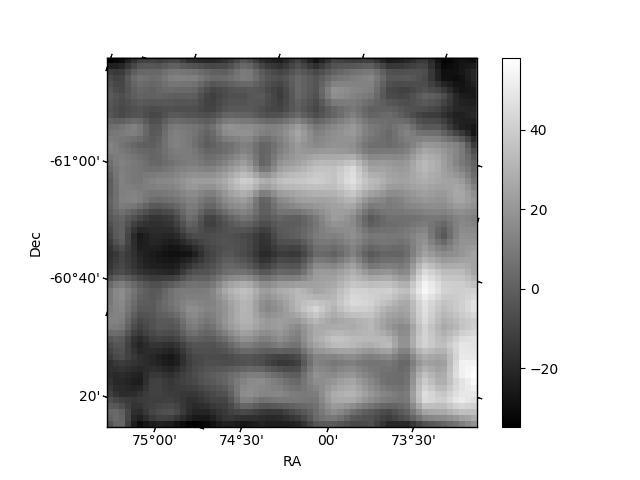
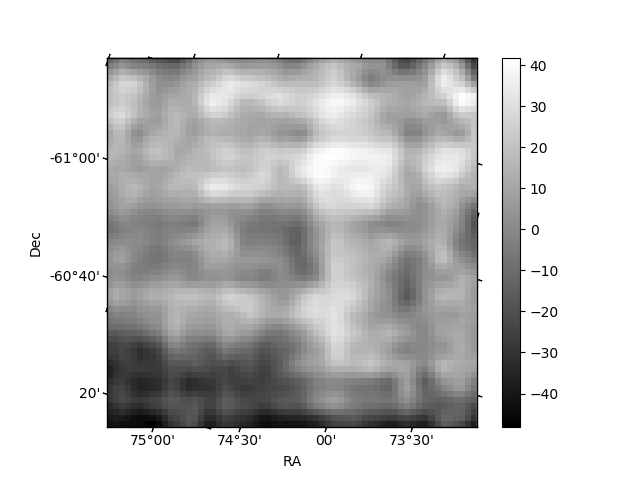
Histogram calculated using DETX and DETY for each event in the final _common_clean file
| Quadrant A | 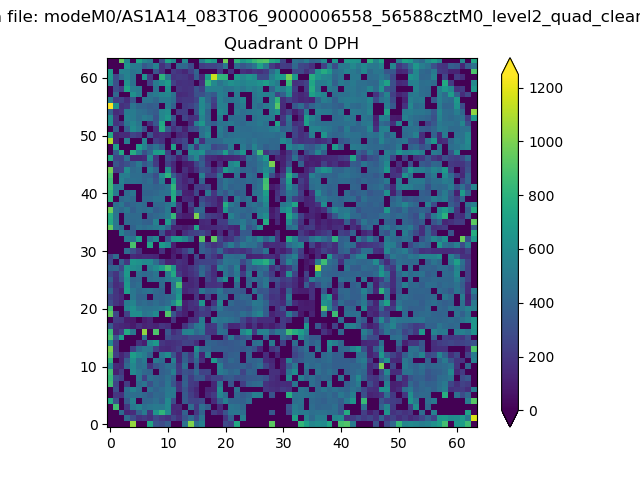 |
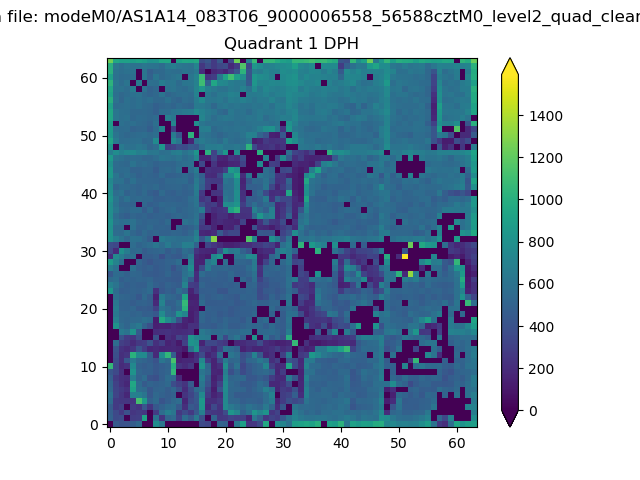 |
Quadrant B |
|---|---|---|---|
| Quadrant D | 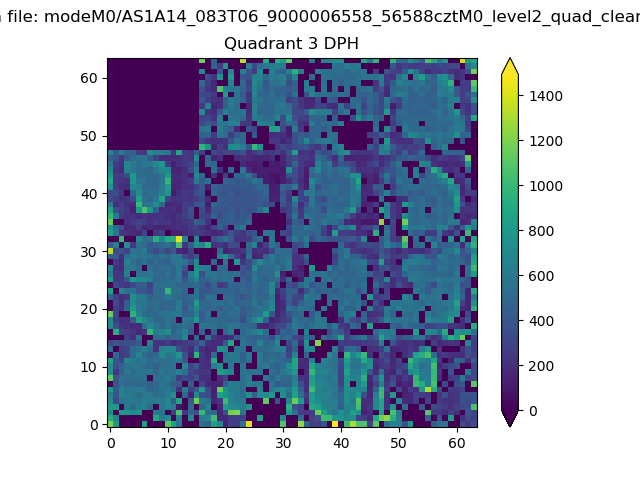 |
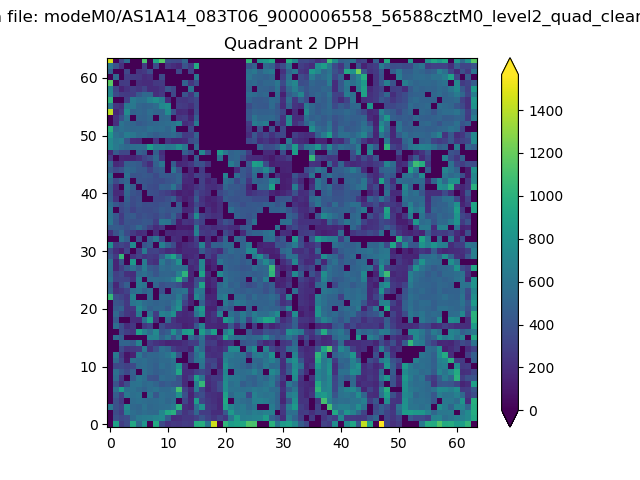 |
Quadrant C |
| Plot type | Count rate plots | Images |
|---|---|---|
| Comparison with Poisson distribution Blue bars denote a histogram of data divided into 1 sec bins. Red curve is a Poisson curve with rate = median count rate of data. |
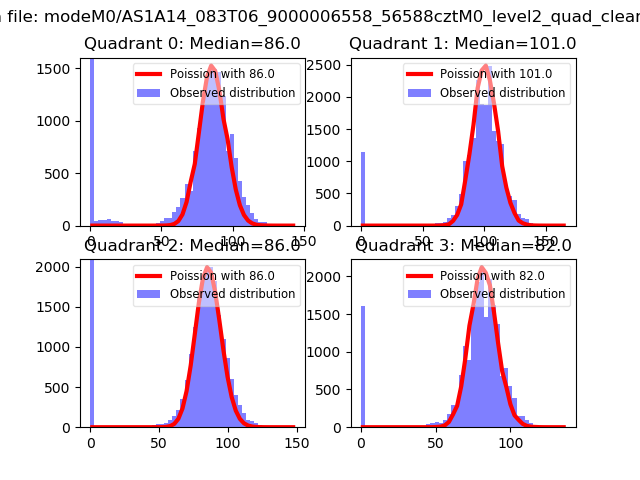 |
 |
| Quadrant-wise count rates Data is divided into 100 sec bins |
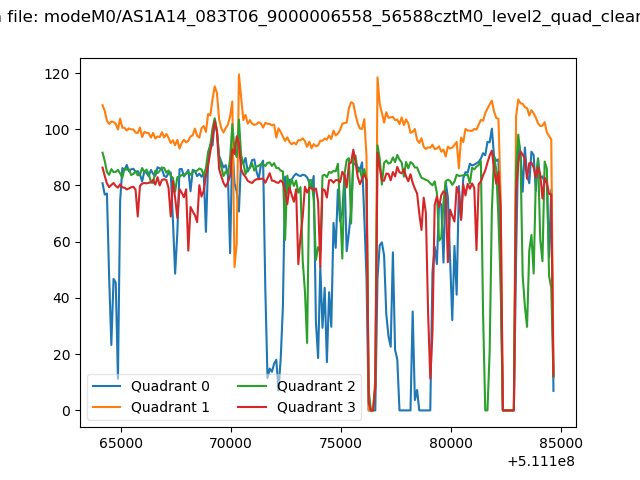 |
|
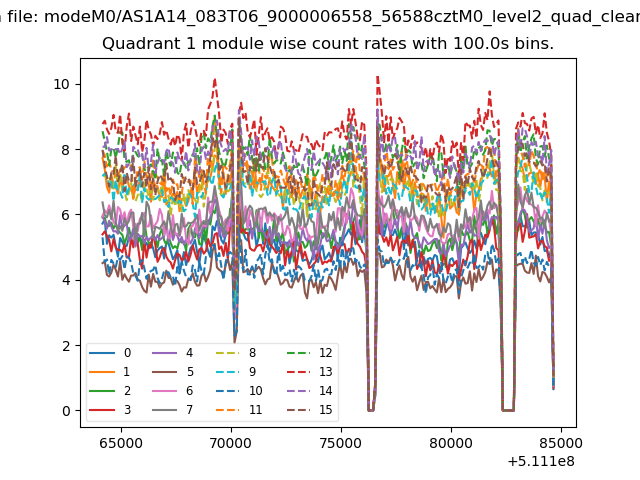
| Module-wise count rates for Quadrant A Data is divided into 100 sec bins |
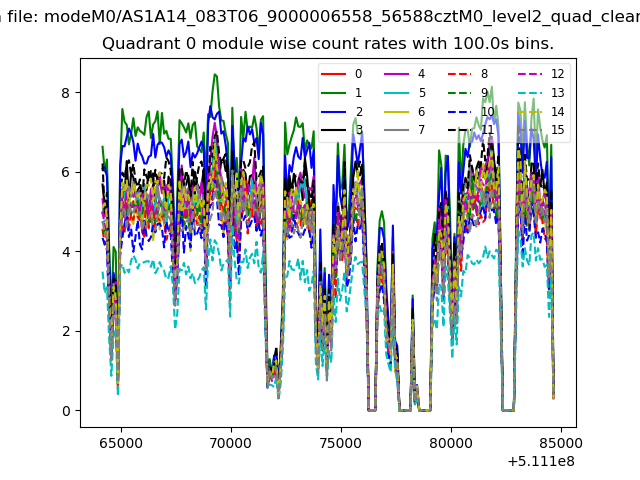 |
 |
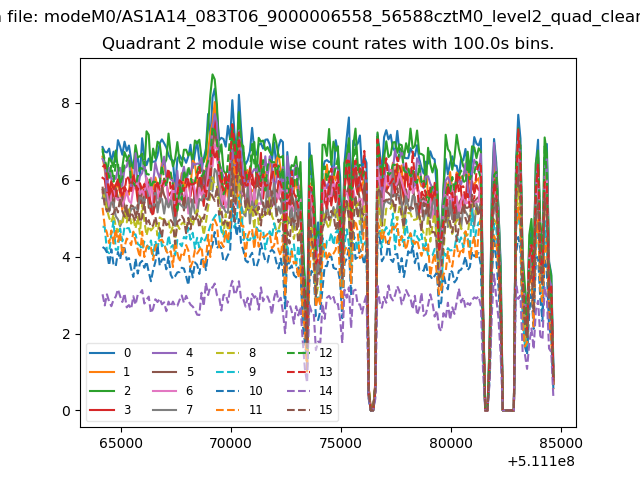
| Module-wise count rates for Quadrant B Data is divided into 100 sec bins |
 |
 |
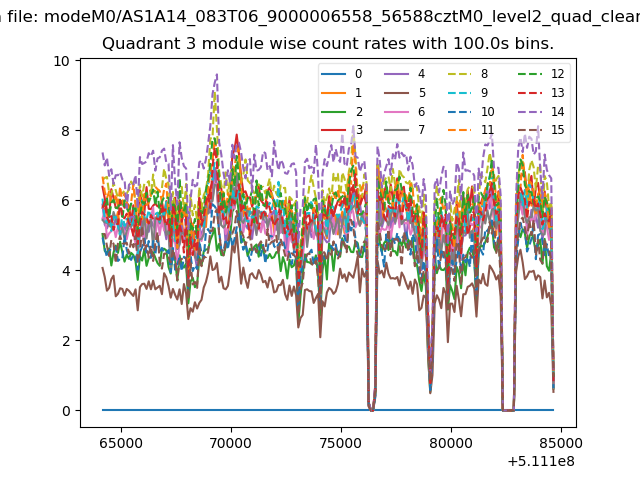
| Module-wise count rates for Quadrant C Data is divided into 100 sec bins |
 |
 |
| Module-wise count rates for Quadrant D Data is divided into 100 sec bins |
 |
 |
| Parameter | Plot |
|---|---|
| CZT HV Monitor | 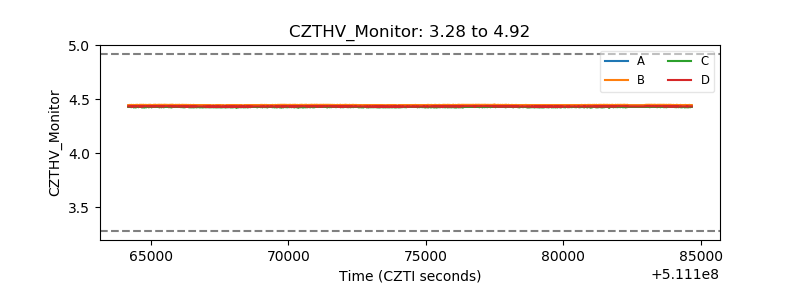 |
| D_VDD | 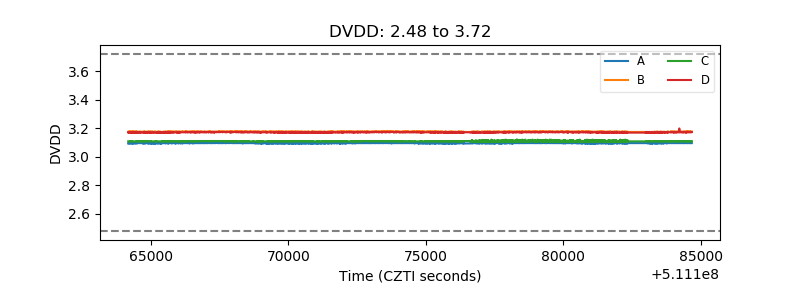 |
| Temperature 1 | 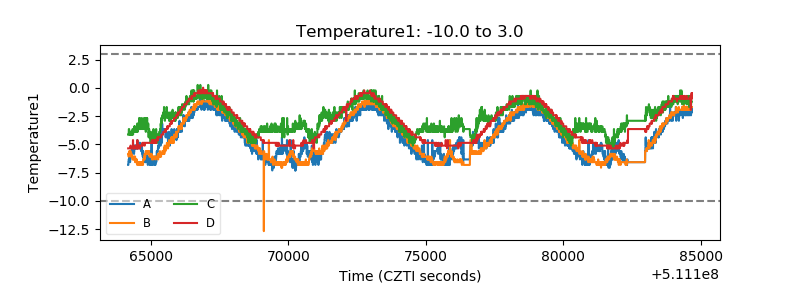 |
| Veto HV Monitor | 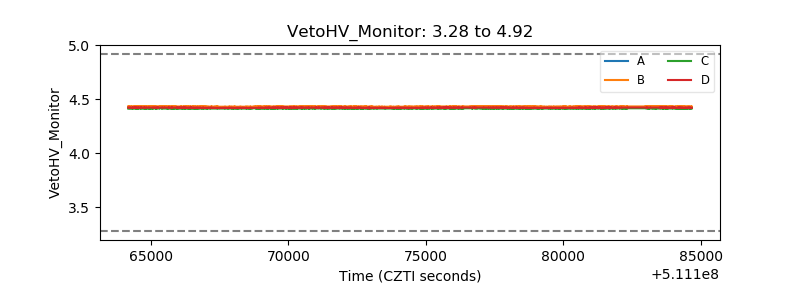 |
| Veto LLD | 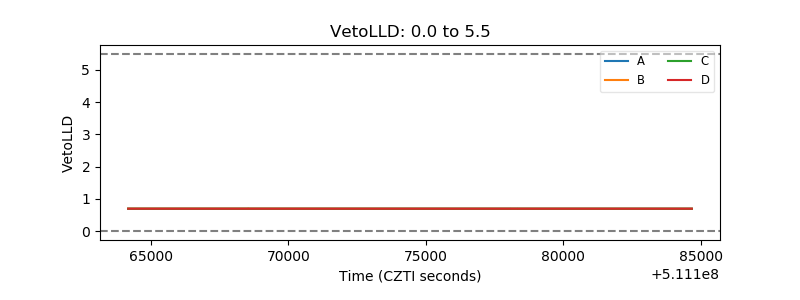 |
| Alpha Counter | 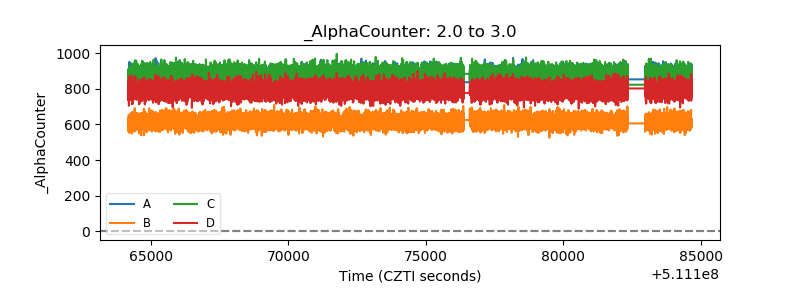 |
| _CPM_Rate | 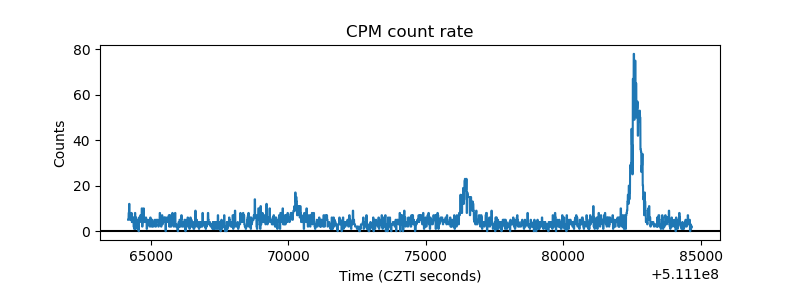 |
| CZT Counter | 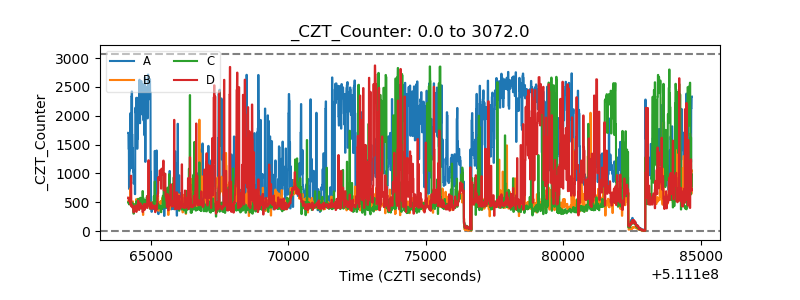 |
| +2.5 Volts monitor |  |
| +5 Volts monitor |  |
| _ROLL_ROT | 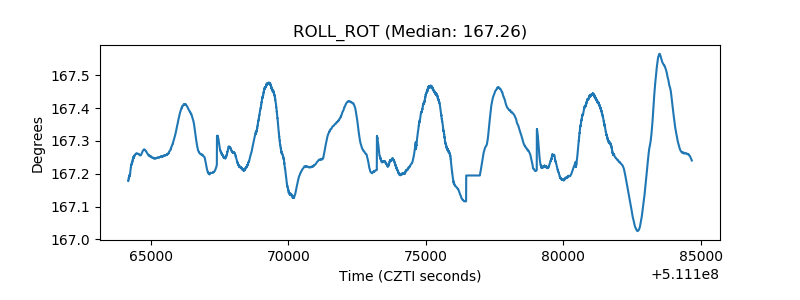 |
| _Roll_DEC | 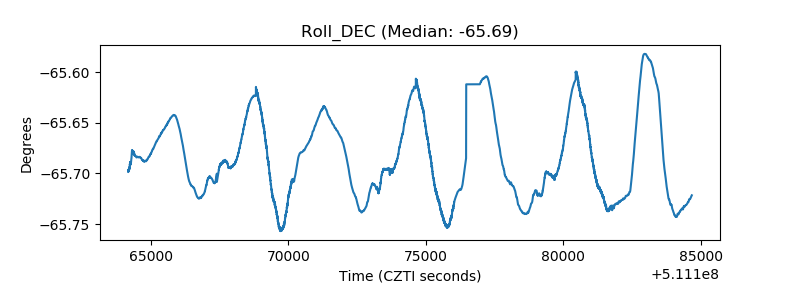 |
| _Roll_RA | 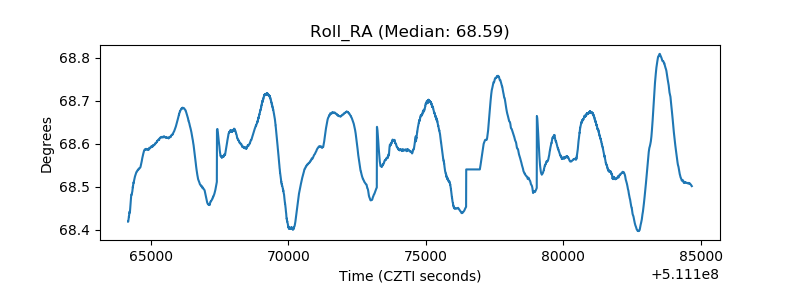 |
| Veto Counter | 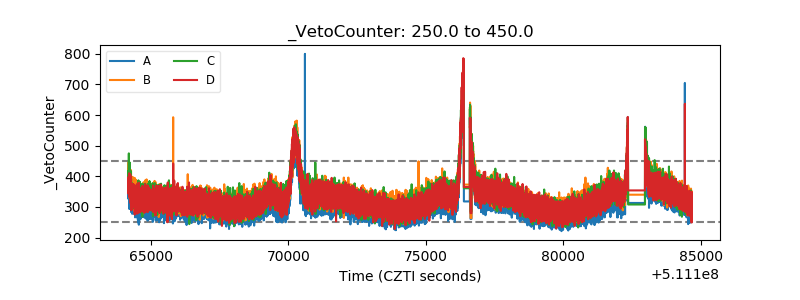 |