| Param | Original file | Final file |
|---|---|---|
| Filename | modeM0/AS1A14_083T06_9000006558_56589cztM0_level2.fits | modeM0/AS1A14_083T06_9000006558_56589cztM0_level2_quad_clean.evt |
| Size (bytes) | 649,235,520 | 91,045,440 |
| Size | 619.2 MB | 86.8 MB |
| Events in quadrant A | 9,153,570 | 503,237 |
| Events in quadrant B | 3,982,496 | 678,504 |
| Events in quadrant C | 4,610,892 | 567,036 |
| Events in quadrant D | 5,767,387 | 541,249 |
| Mode SS | |||
|---|---|---|---|
| Quadrant | BADHDUFLAG | Total packets | Discarded packets |
| A | 0 | 136 | 0 |
| B | 0 | 136 | 0 |
| C | 0 | 136 | 0 |
| D | 0 | 136 | 0 |
| Mode M9 | |||
|---|---|---|---|
| Quadrant | BADHDUFLAG | Total packets | Discarded packets |
| A | 0 | 7 | 0 |
| B | 0 | 7 | 0 |
| C | 0 | 7 | 0 |
| D | 0 | 7 | 0 |
| Mode M0 | |||
|---|---|---|---|
| Quadrant | BADHDUFLAG | Total packets | Discarded packets |
| A | 0 | 32028 | 1 |
| B | 0 | 16300 | 1 |
| C | 0 | 18590 | 1 |
| D | 0 | 21686 | 1 |
| Quadrant | Total seconds | Saturated seconds | Saturation percentage |
|---|---|---|---|
| A | 6691 | 1613 | 24.107009% |
| B | 6691 | 114 | 1.703781% |
| C | 6690 | 535 | 7.997010% |
| D | 6690 | 497 | 7.428999% |
Noise dominated data is calculated using 1-second bins in cleaned event files. If a bin has >2000 counts, and if more than 50% of those come from <1% of pixels, then it is considered to be noise-dominated and hence unusable.
| Quadrant | # 1 sec bins | Bins with >0 counts | Bins with >2000 counts | High rate bins dominated by noise | Noise dominated (total time) | Noise dominated (detector-on time) | Marked lightcurve |
|---|---|---|---|---|---|---|---|
| A | 7456 | 6691 | 1407 | 1407 | 18.87% | 21.03% | 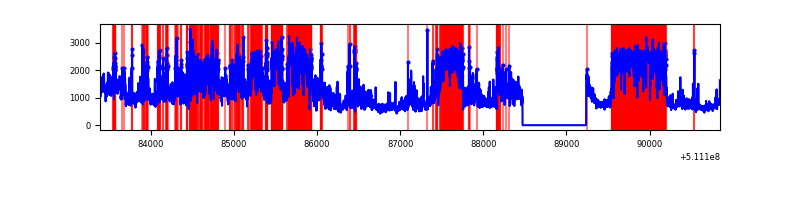 |
| B | 7456 | 6691 | 43 | 43 | 0.58% | 0.64% | 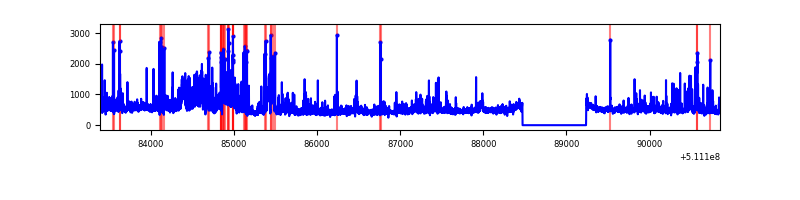 |
| C | 7455 | 6690 | 503 | 503 | 6.75% | 7.52% | 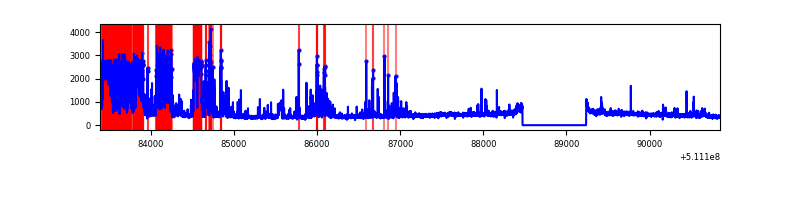 |
| D | 7455 | 6690 | 472 | 472 | 6.33% | 7.06% | 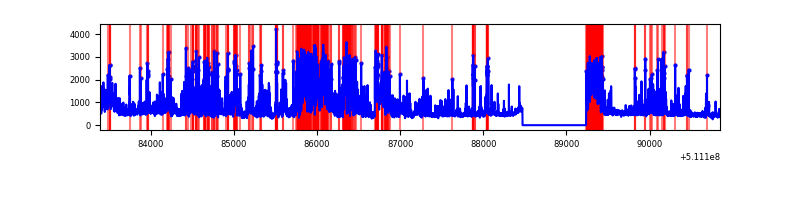 |
Top three noisy pixels from each quadrant. If the there are fewer than three noisy pixels in the level2.evt file, extra rows are filled as -1
| Pixel properties | Quadrant properties | ||||||
|---|---|---|---|---|---|---|---|
| Quadrant | DetID | PixID | Counts | Sigma | Mean | Median | Sigma |
| A | 7 | 64 | 6037546 | 36640.56 | 663 | 646 | 164.8 |
| A | 13 | 248 | 219217 | 1326.6 | 663 | 646 | 164.8 |
| A | 4 | 95 | 136273 | 823.18 | 663 | 646 | 164.8 |
| B | 5 | 185 | 765347 | 4949.19 | 713 | 686 | 154.5 |
| B | 4 | 21 | 132074 | 850.4 | 713 | 686 | 154.5 |
| B | 0 | 153 | 75279 | 482.8 | 713 | 686 | 154.5 |
| C | 15 | 230 | 1625661 | 8834.65 | 673 | 667 | 183.9 |
| C | 13 | 3 | 221739 | 1201.91 | 673 | 667 | 183.9 |
| C | 12 | 252 | 59164 | 318.03 | 673 | 667 | 183.9 |
| D | 8 | 240 | 614167 | 3165.81 | 683 | 652 | 193.8 |
| D | 6 | 239 | 611066 | 3149.81 | 683 | 652 | 193.8 |
| D | 14 | 52 | 597537 | 3080.0 | 683 | 652 | 193.8 |
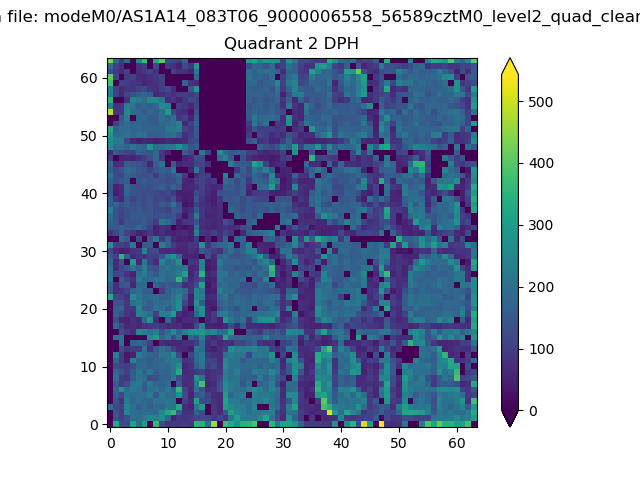
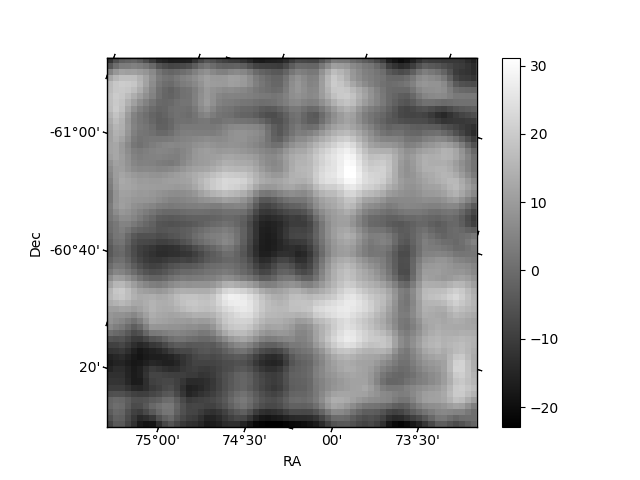
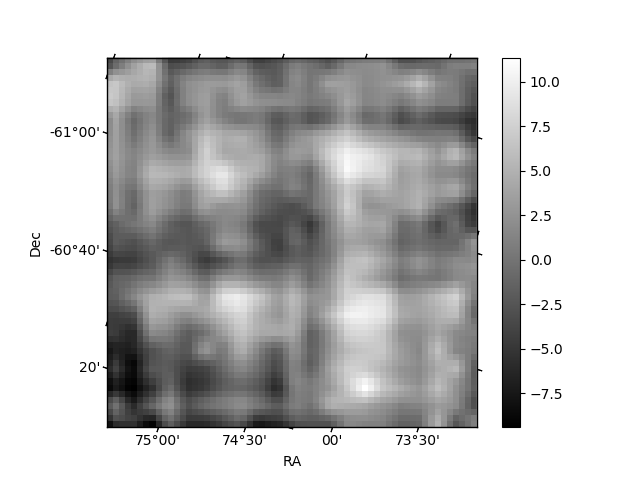
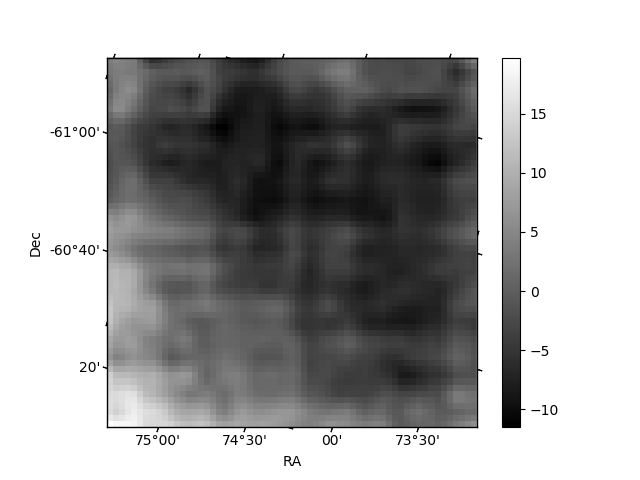
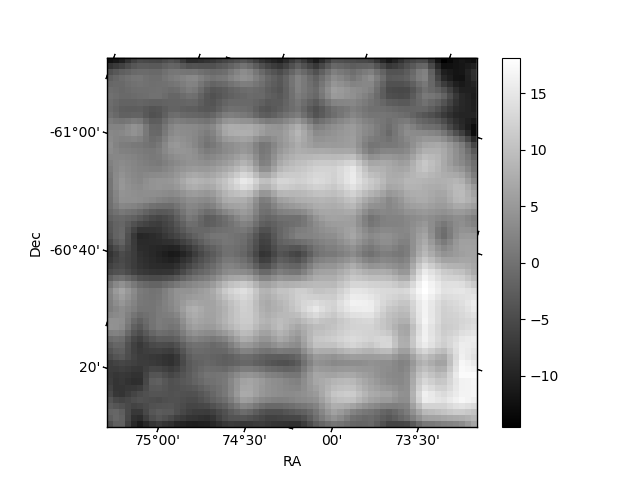
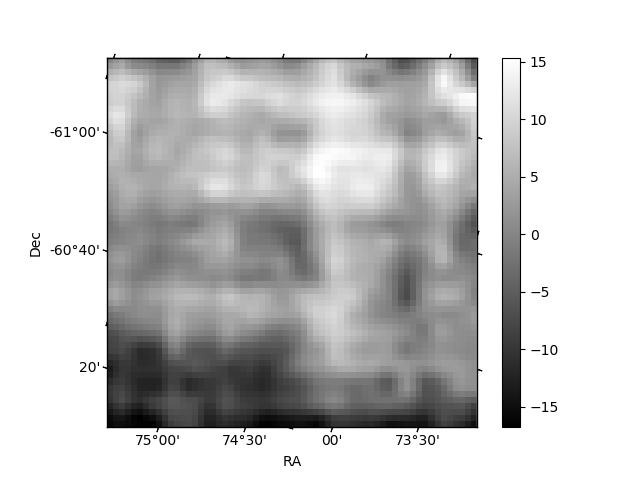
Histogram calculated using DETX and DETY for each event in the final _common_clean file
| Quadrant A | 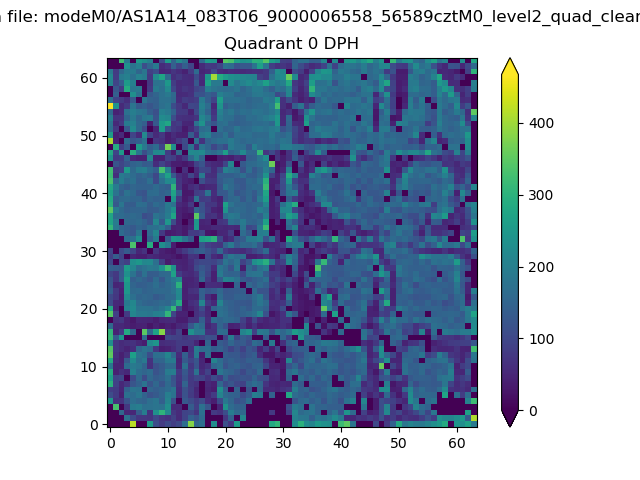 |
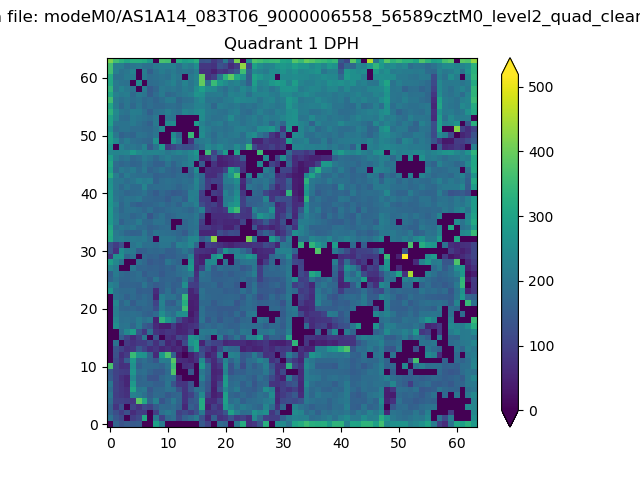 |
Quadrant B |
|---|---|---|---|
| Quadrant D | 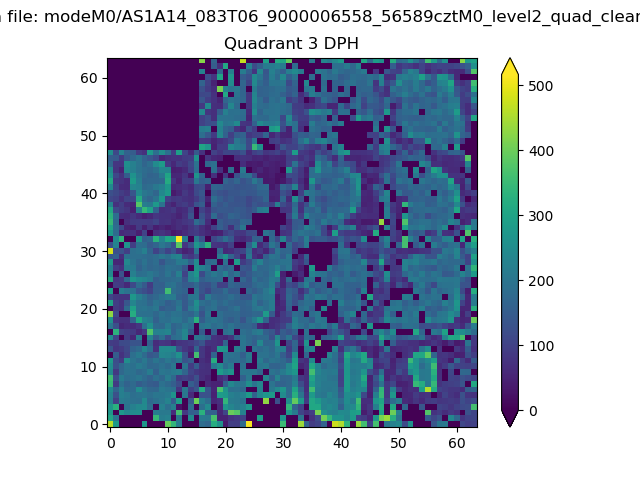 |
 |
Quadrant C |
| Plot type | Count rate plots | Images |
|---|---|---|
| Comparison with Poisson distribution Blue bars denote a histogram of data divided into 1 sec bins. Red curve is a Poisson curve with rate = median count rate of data. |
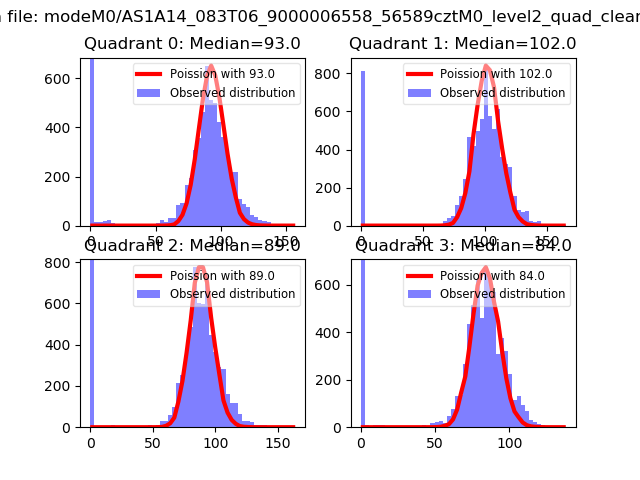 |
 |
| Quadrant-wise count rates Data is divided into 100 sec bins |
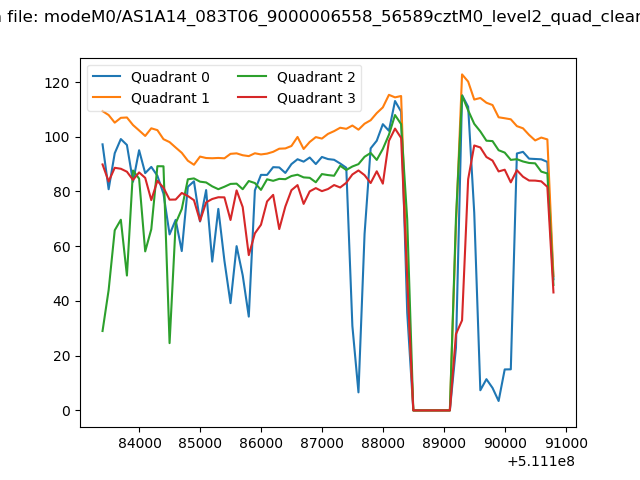 |
|
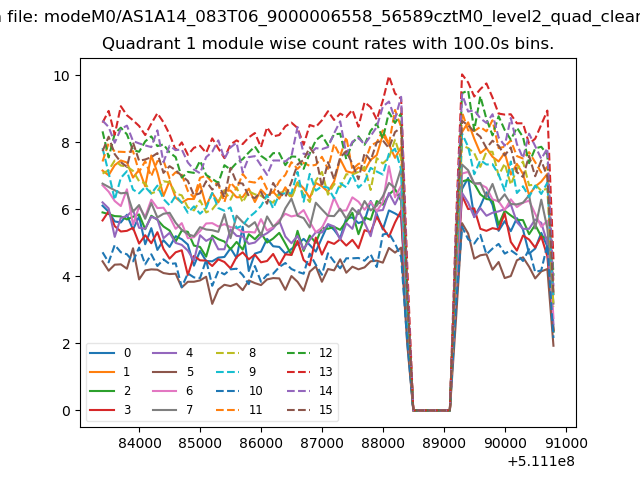
| Module-wise count rates for Quadrant A Data is divided into 100 sec bins |
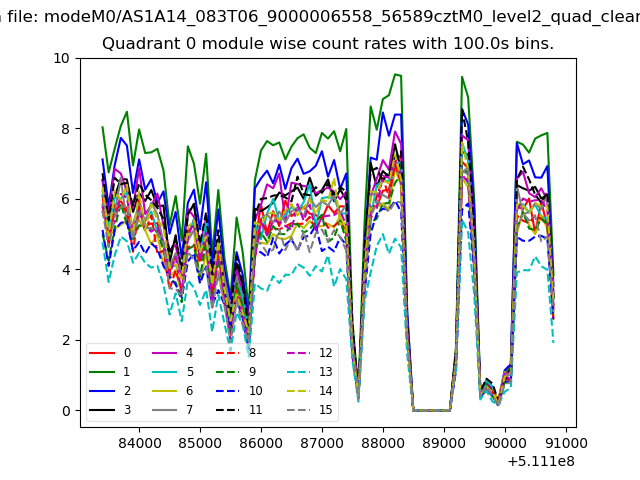 |
 |
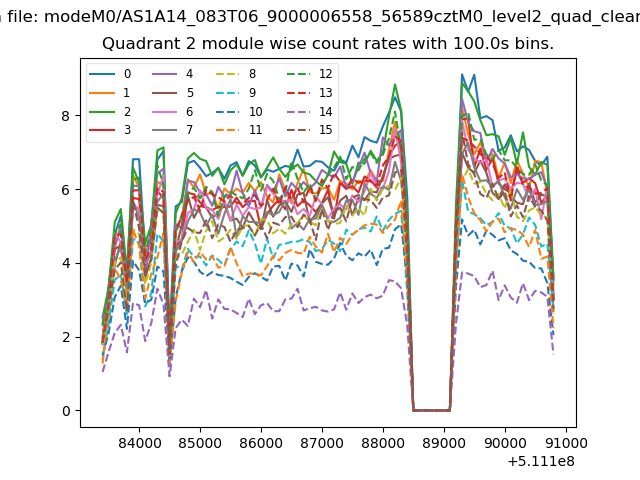
| Module-wise count rates for Quadrant B Data is divided into 100 sec bins |
 |
 |
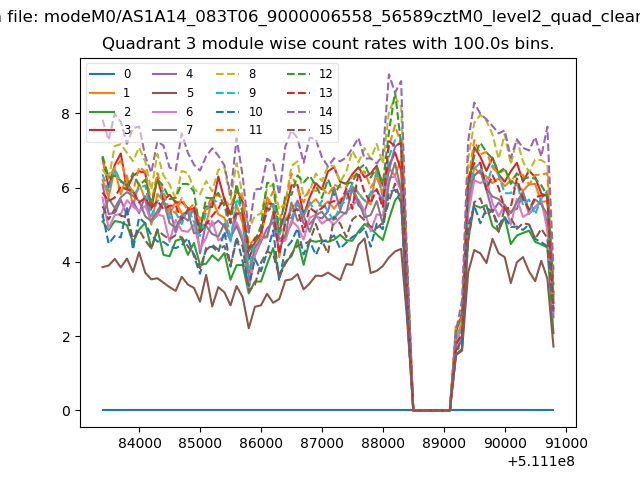
| Module-wise count rates for Quadrant C Data is divided into 100 sec bins |
 |
 |
| Module-wise count rates for Quadrant D Data is divided into 100 sec bins |
 |
 |
| Parameter | Plot |
|---|---|
| CZT HV Monitor | 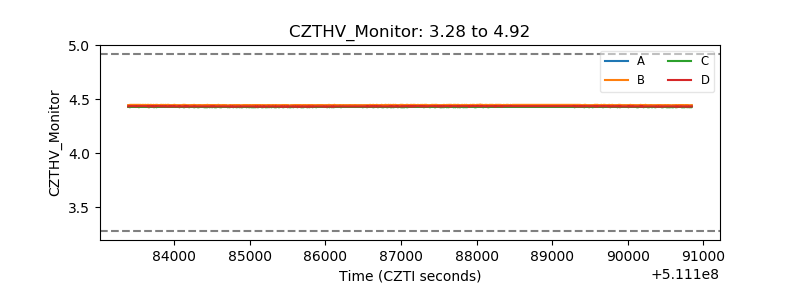 |
| D_VDD | 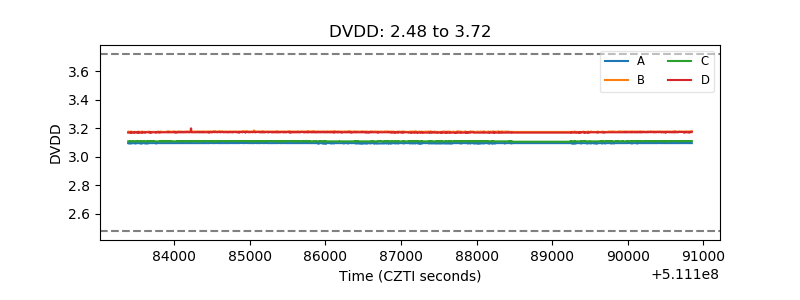 |
| Temperature 1 | 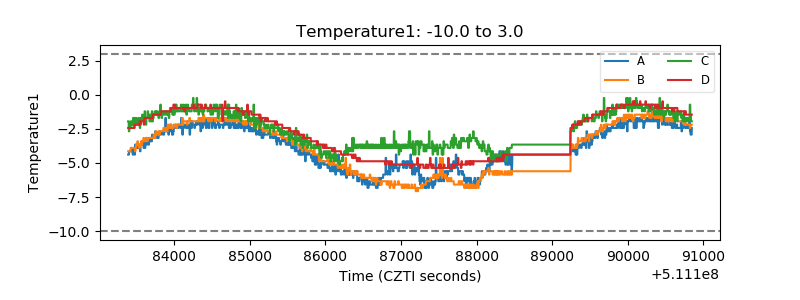 |
| Veto HV Monitor |  |
| Veto LLD | 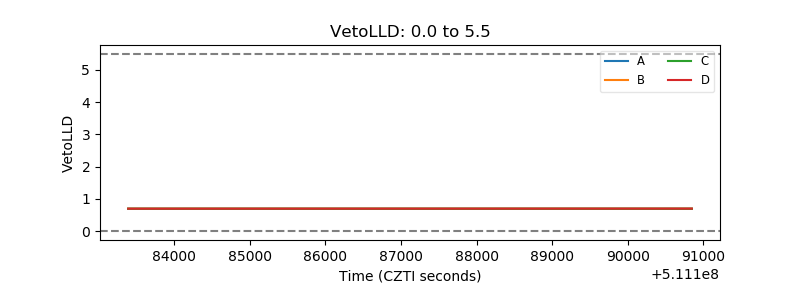 |
| Alpha Counter | 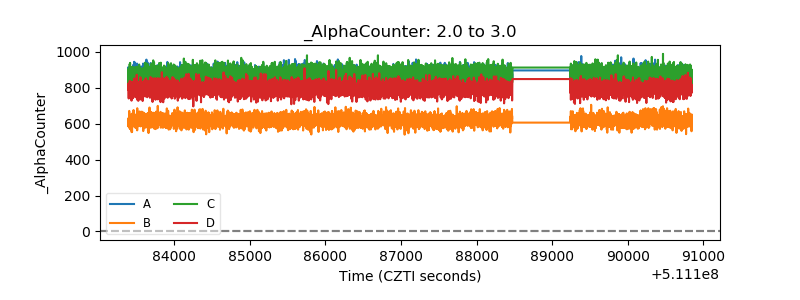 |
| _CPM_Rate | 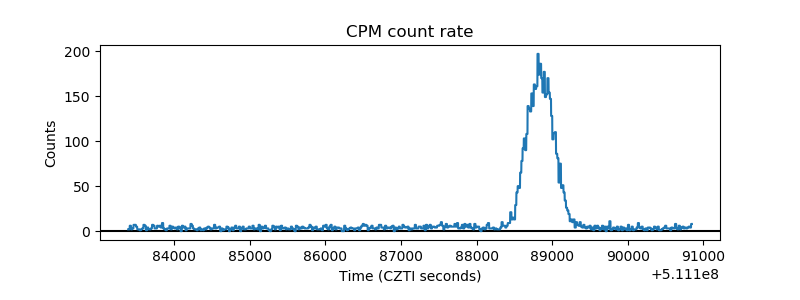 |
| CZT Counter | 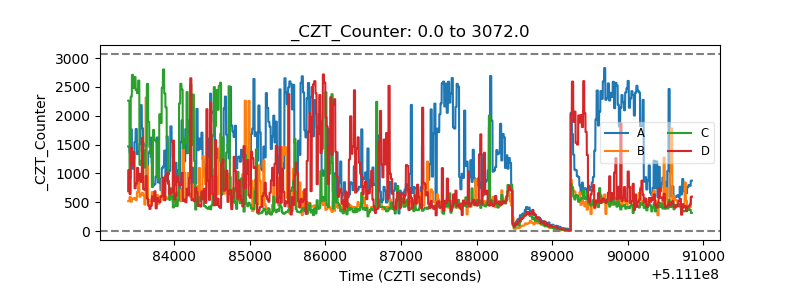 |
| +2.5 Volts monitor |  |
| +5 Volts monitor |  |
| _ROLL_ROT | 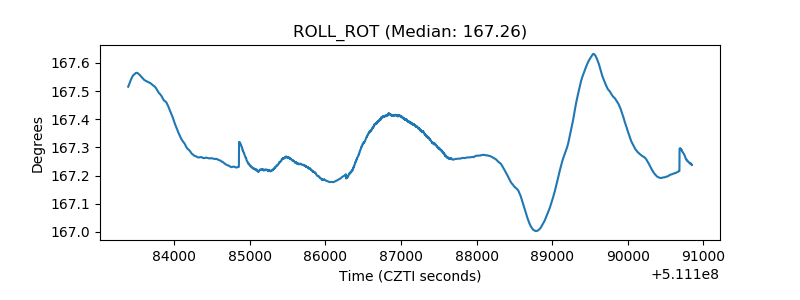 |
| _Roll_DEC | 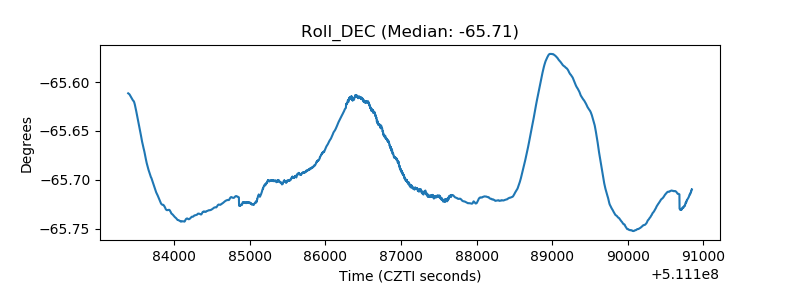 |
| _Roll_RA | 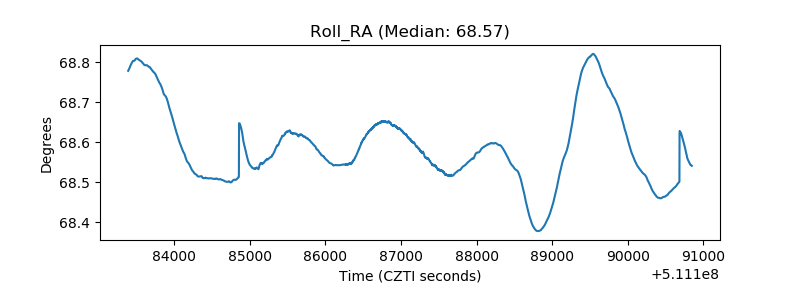 |
| Veto Counter | 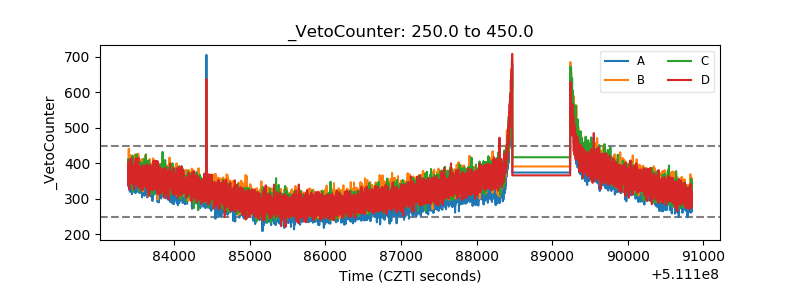 |