| Param | Original file | Final file |
|---|---|---|
| Filename | modeM0/AS1A14_083T06_9000006558_56591cztM0_level2.fits | modeM0/AS1A14_083T06_9000006558_56591cztM0_level2_quad_clean.evt |
| Size (bytes) | 478,186,560 | 88,842,240 |
| Size | 456.0 MB | 84.7 MB |
| Events in quadrant A | 7,013,043 | 532,132 |
| Events in quadrant B | 2,938,462 | 637,760 |
| Events in quadrant C | 2,734,600 | 578,543 |
| Events in quadrant D | 4,546,206 | 520,334 |
| Mode SS | |||
|---|---|---|---|
| Quadrant | BADHDUFLAG | Total packets | Discarded packets |
| A | 0 | 122 | 0 |
| B | 0 | 122 | 0 |
| C | 0 | 122 | 0 |
| D | 0 | 122 | 0 |
| Mode M9 | |||
|---|---|---|---|
| Quadrant | BADHDUFLAG | Total packets | Discarded packets |
| A | 0 | 9 | 0 |
| B | 0 | 9 | 0 |
| C | 0 | 9 | 0 |
| D | 0 | 9 | 0 |
| Mode M0 | |||
|---|---|---|---|
| Quadrant | BADHDUFLAG | Total packets | Discarded packets |
| A | 0 | 25205 | 1 |
| B | 0 | 13068 | 1 |
| C | 0 | 12853 | 1 |
| D | 0 | 17801 | 1 |
| Quadrant | Total seconds | Saturated seconds | Saturation percentage |
|---|---|---|---|
| A | 6034 | 907 | 15.031488% |
| B | 6033 | 60 | 0.994530% |
| C | 6033 | 53 | 0.878502% |
| D | 6034 | 422 | 6.993702% |
Noise dominated data is calculated using 1-second bins in cleaned event files. If a bin has >2000 counts, and if more than 50% of those come from <1% of pixels, then it is considered to be noise-dominated and hence unusable.
| Quadrant | # 1 sec bins | Bins with >0 counts | Bins with >2000 counts | High rate bins dominated by noise | Noise dominated (total time) | Noise dominated (detector-on time) | Marked lightcurve |
|---|---|---|---|---|---|---|---|
| A | 6984 | 6034 | 727 | 727 | 10.41% | 12.05% | 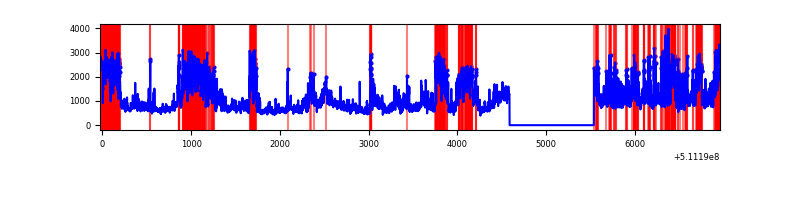 |
| B | 6983 | 6033 | 5 | 5 | 0.07% | 0.08% | 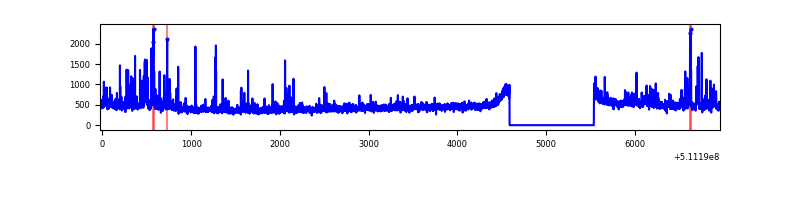 |
| C | 6983 | 6033 | 17 | 17 | 0.24% | 0.28% | 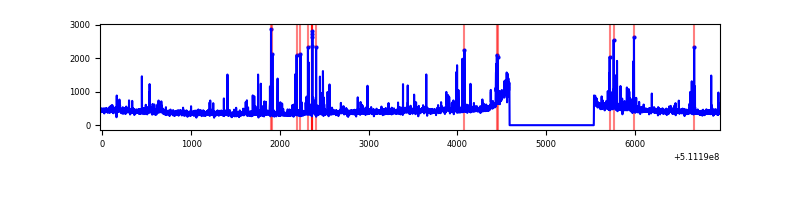 |
| D | 6984 | 6034 | 391 | 391 | 5.60% | 6.48% | 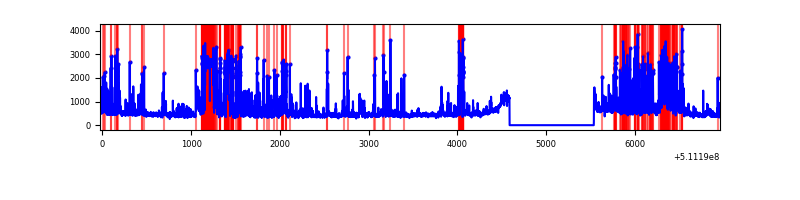 |
Top three noisy pixels from each quadrant. If the there are fewer than three noisy pixels in the level2.evt file, extra rows are filled as -1
| Pixel properties | Quadrant properties | ||||||
|---|---|---|---|---|---|---|---|
| Quadrant | DetID | PixID | Counts | Sigma | Mean | Median | Sigma |
| A | 7 | 64 | 2999967 | 19157.65 | 625 | 608 | 156.6 |
| A | 4 | 95 | 752591 | 4803.1 | 625 | 608 | 156.6 |
| A | 13 | 248 | 340131 | 2168.62 | 625 | 608 | 156.6 |
| B | 5 | 185 | 117608 | 834.75 | 648 | 626 | 140.1 |
| B | 4 | 21 | 102402 | 726.25 | 648 | 626 | 140.1 |
| B | 4 | 206 | 80332 | 568.76 | 648 | 626 | 140.1 |
| C | 12 | 252 | 85335 | 479.56 | 632 | 624 | 176.6 |
| C | 6 | 223 | 65783 | 368.87 | 632 | 624 | 176.6 |
| C | 13 | 3 | 60116 | 336.79 | 632 | 624 | 176.6 |
| D | 2 | 31 | 624370 | 3489.83 | 621 | 594 | 178.7 |
| D | 6 | 239 | 539680 | 3016.02 | 621 | 594 | 178.7 |
| D | 2 | 249 | 288591 | 1611.25 | 621 | 594 | 178.7 |
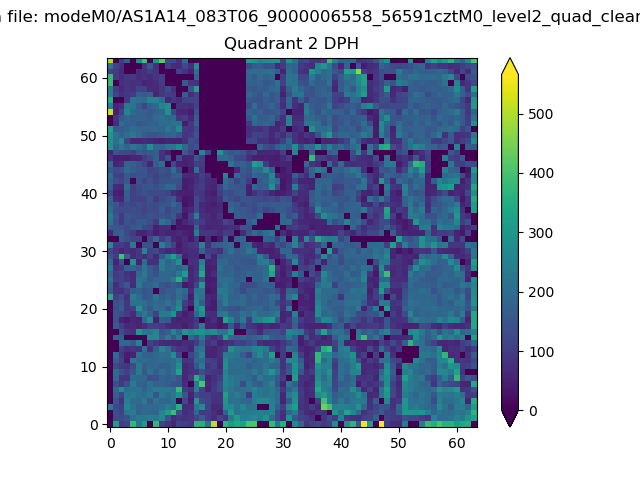
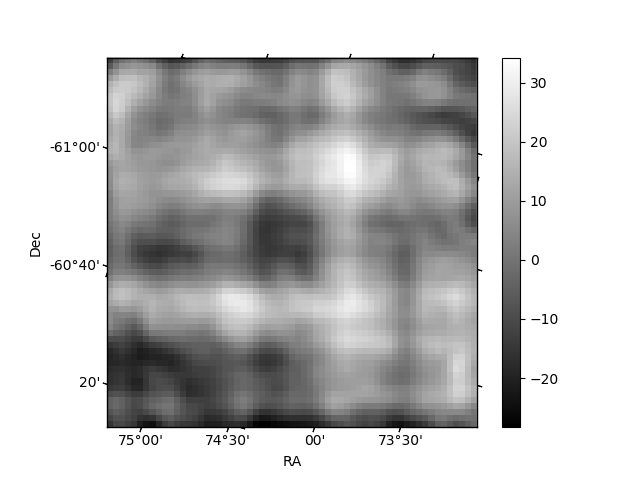
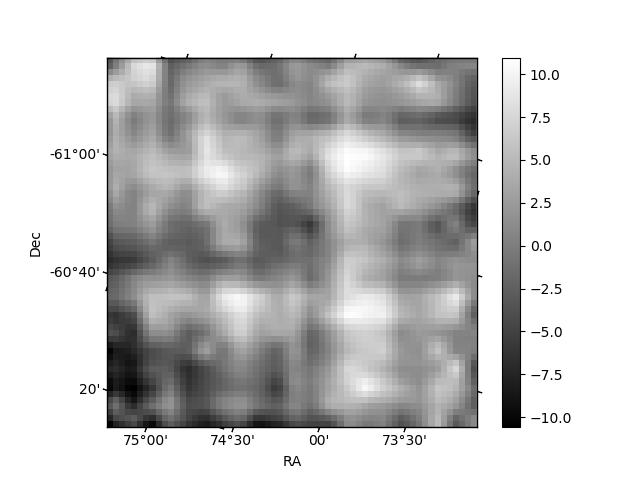
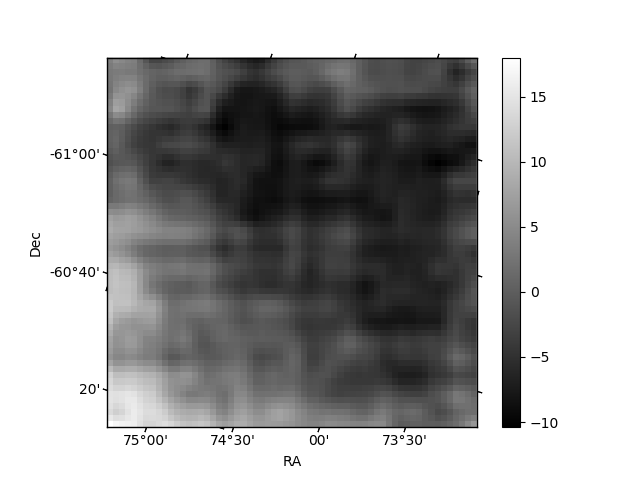
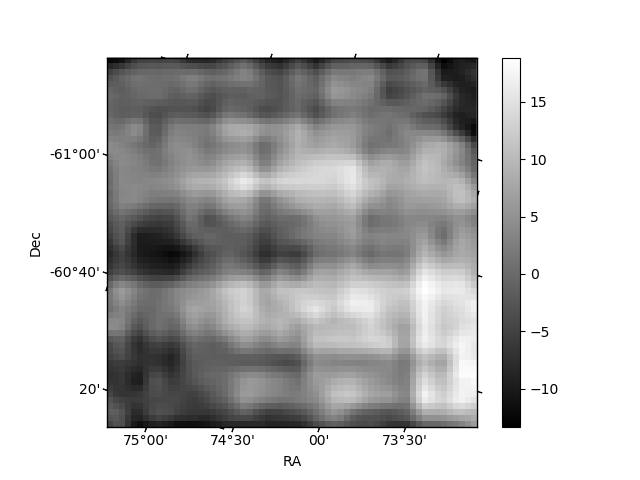
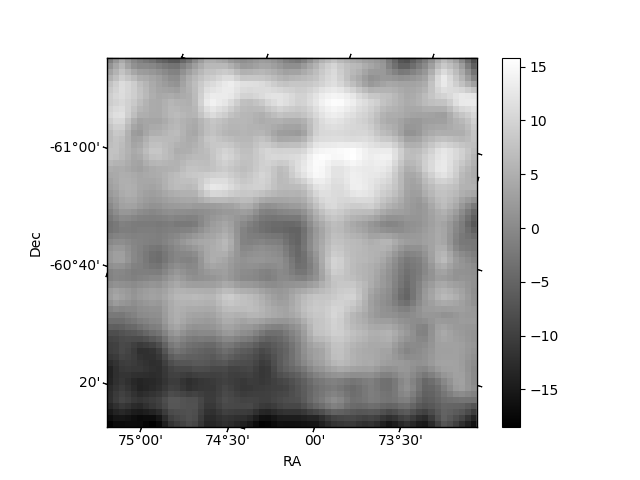
Histogram calculated using DETX and DETY for each event in the final _common_clean file
| Quadrant A | 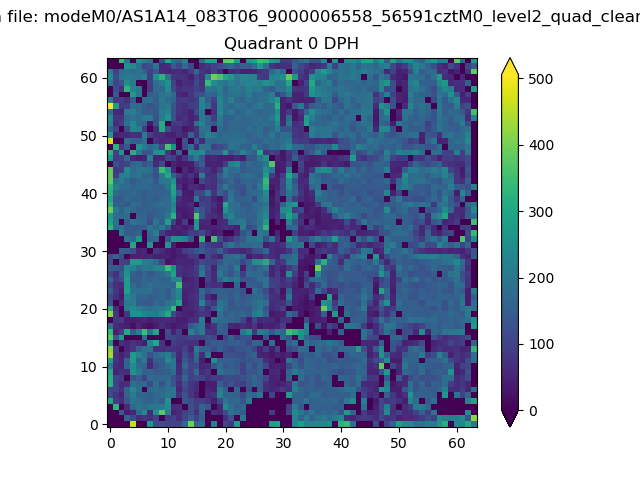 |
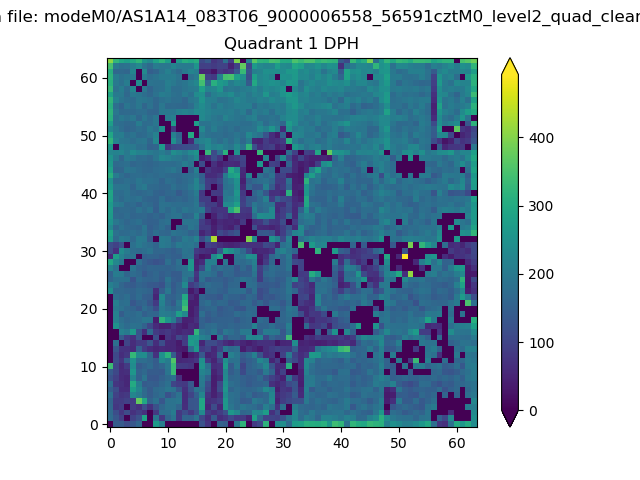 |
Quadrant B |
|---|---|---|---|
| Quadrant D | 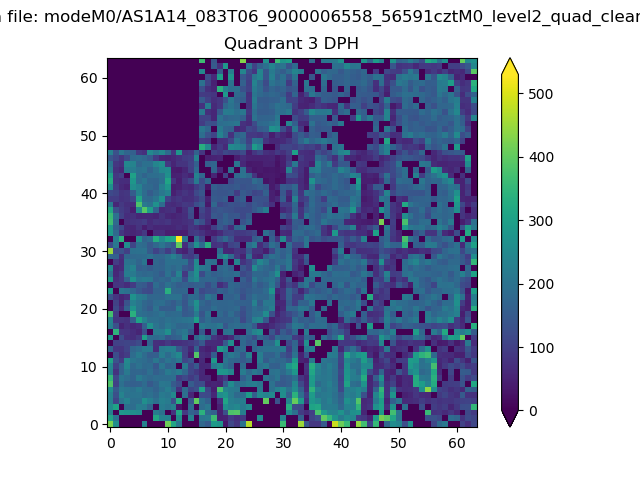 |
 |
Quadrant C |
| Plot type | Count rate plots | Images |
|---|---|---|
| Comparison with Poisson distribution Blue bars denote a histogram of data divided into 1 sec bins. Red curve is a Poisson curve with rate = median count rate of data. |
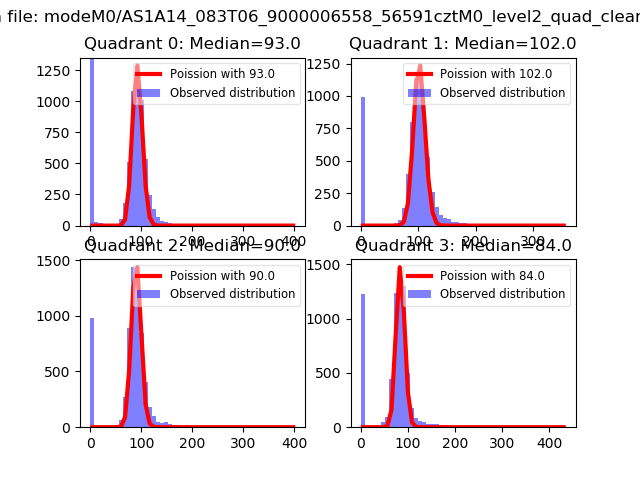 |
 |
| Quadrant-wise count rates Data is divided into 100 sec bins |
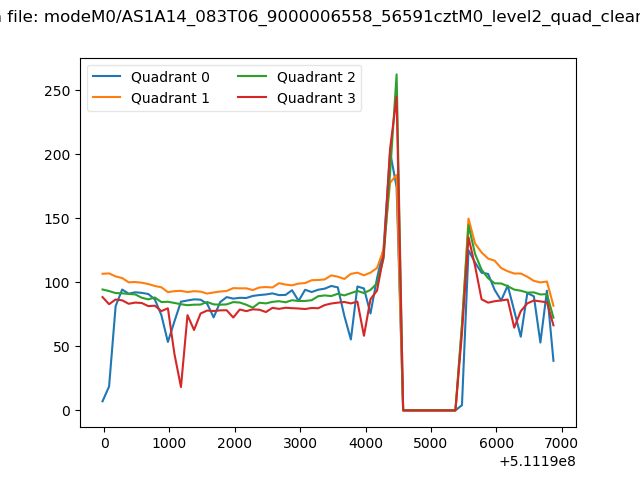 |
|
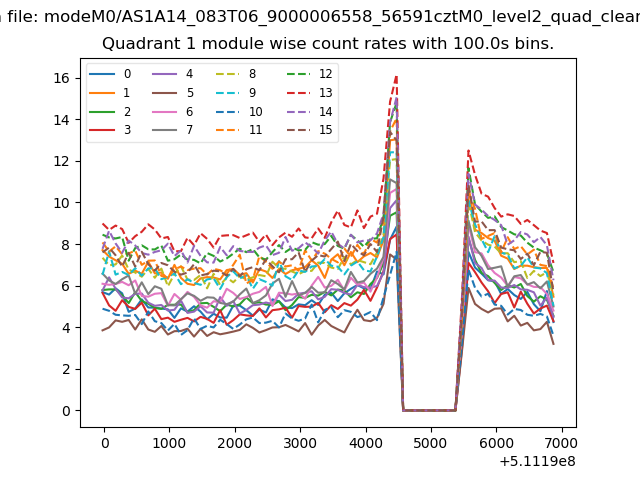
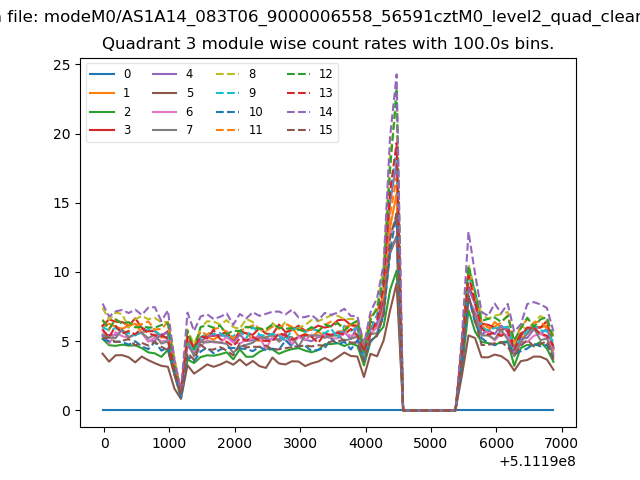
| Module-wise count rates for Quadrant A Data is divided into 100 sec bins |
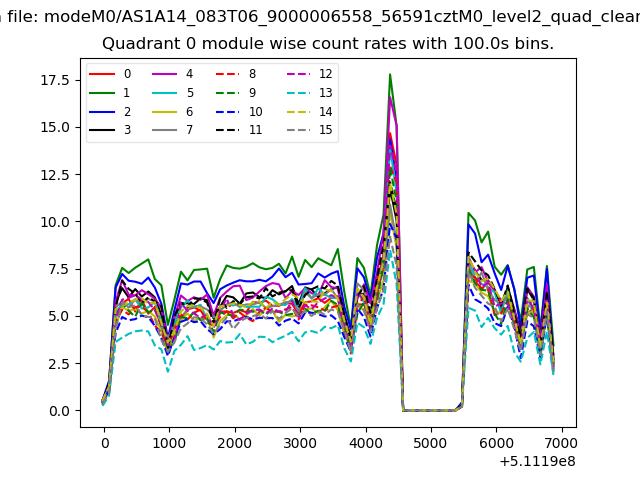 |
 |
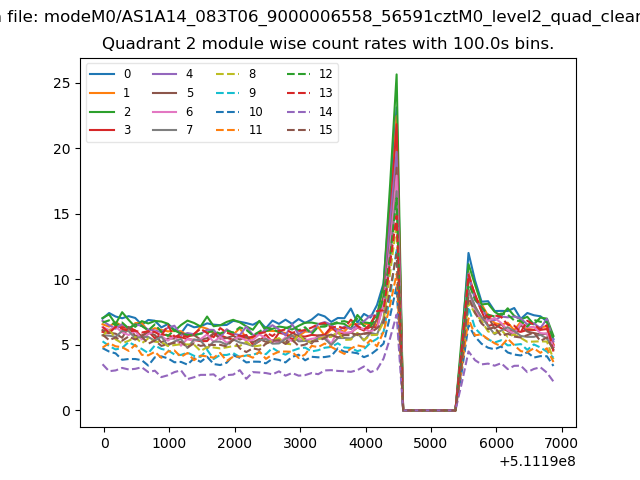
| Module-wise count rates for Quadrant B Data is divided into 100 sec bins |
 |
 |
| Module-wise count rates for Quadrant C Data is divided into 100 sec bins |
 |
 |
| Module-wise count rates for Quadrant D Data is divided into 100 sec bins |
 |
 |
| Parameter | Plot |
|---|---|
| CZT HV Monitor | 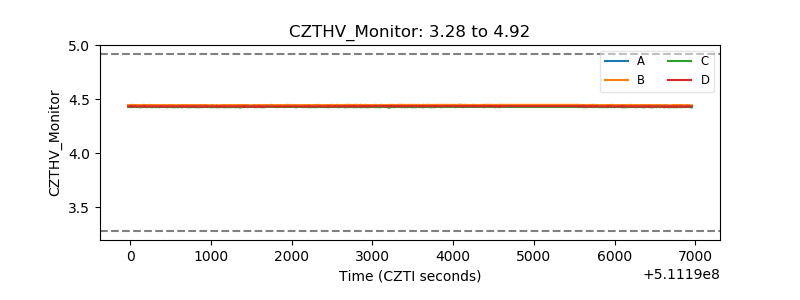 |
| D_VDD | 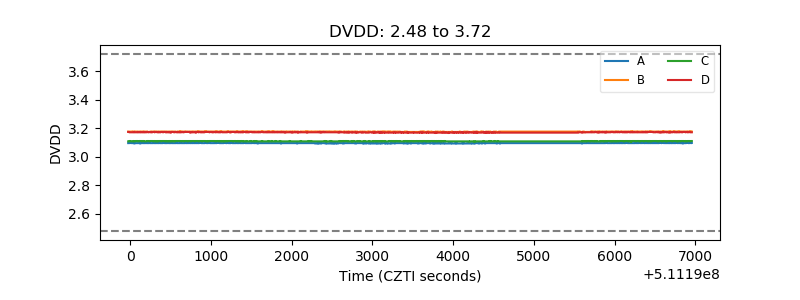 |
| Temperature 1 | 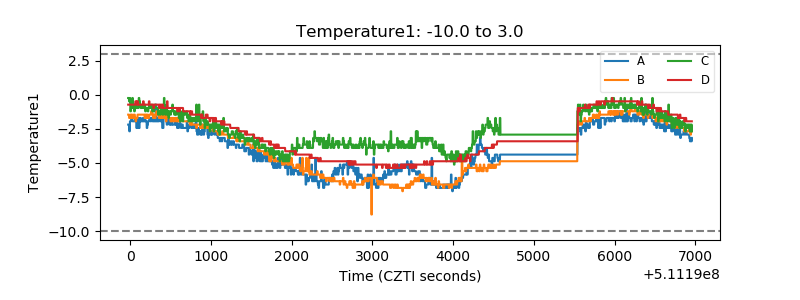 |
| Veto HV Monitor | 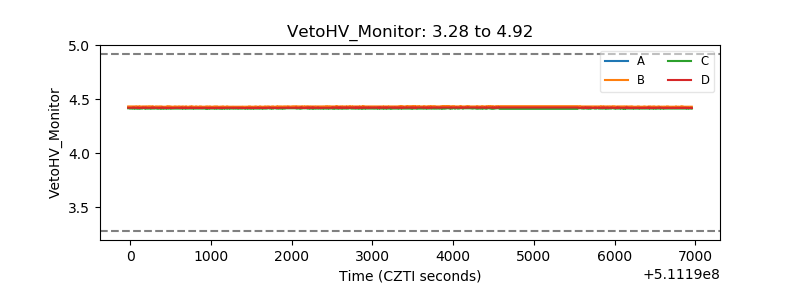 |
| Veto LLD | 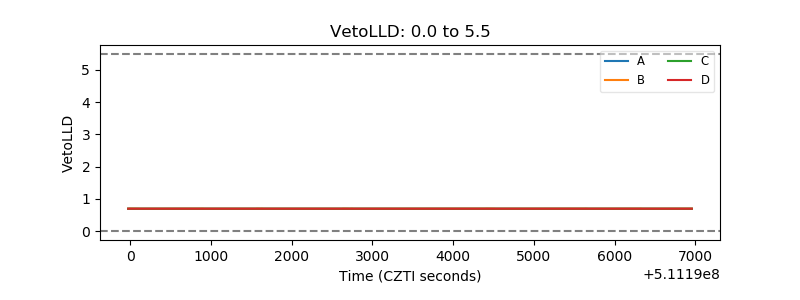 |
| Alpha Counter | 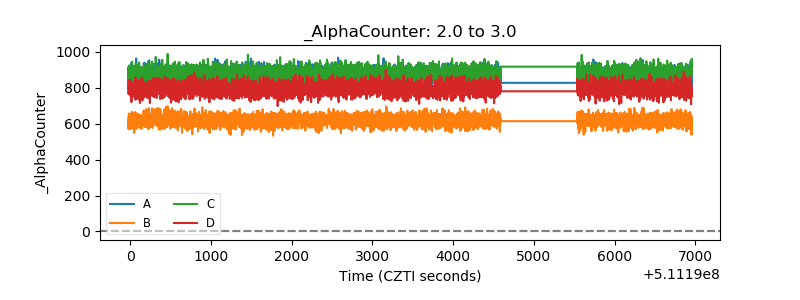 |
| _CPM_Rate | 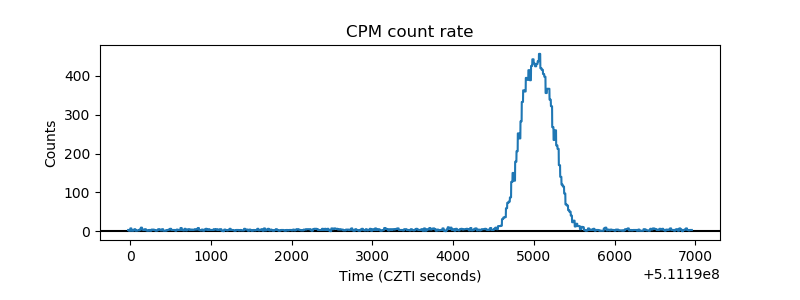 |
| CZT Counter | 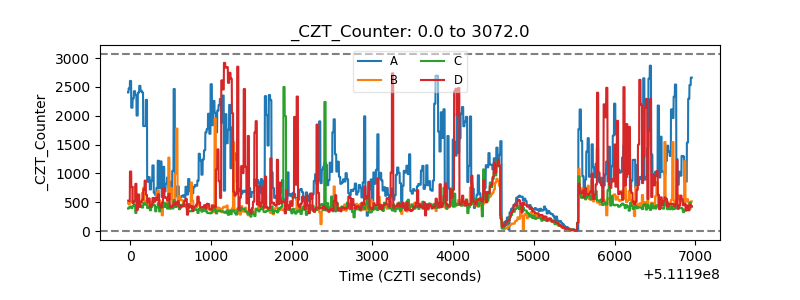 |
| +2.5 Volts monitor |  |
| +5 Volts monitor |  |
| _ROLL_ROT | 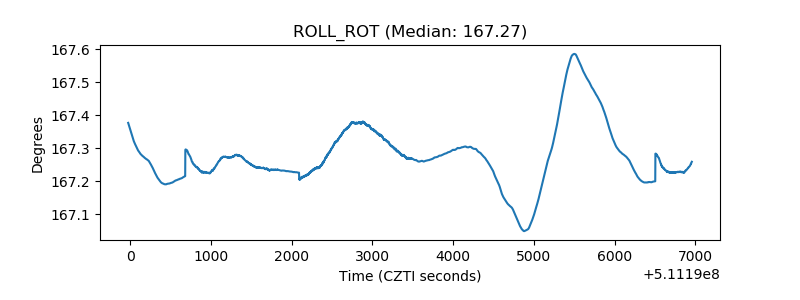 |
| _Roll_DEC | 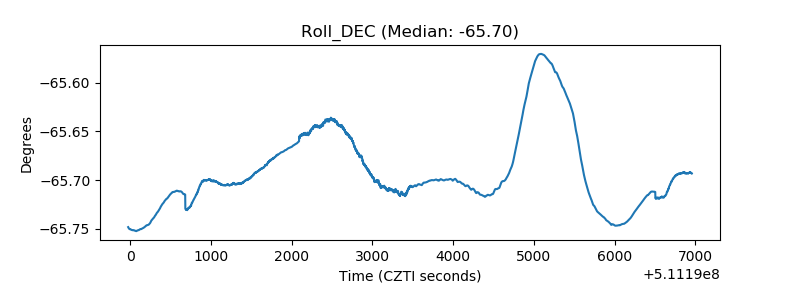 |
| _Roll_RA | 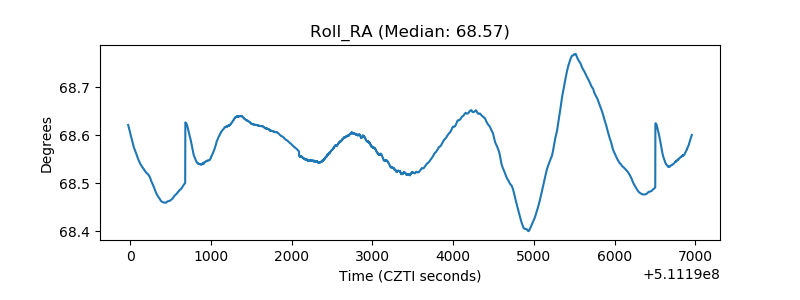 |
| Veto Counter | 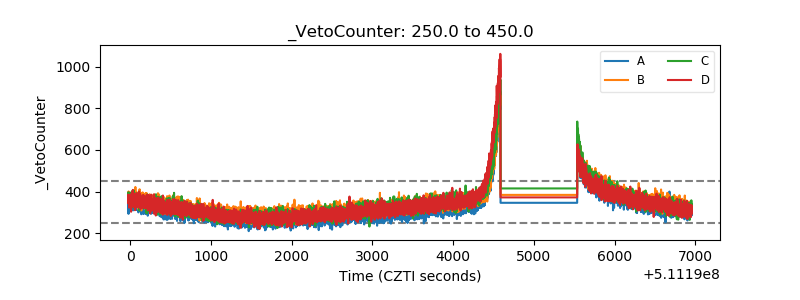 |