| Param | Original file | Final file |
|---|---|---|
| Filename | modeM0/AS1A14_083T06_9000006558_56592cztM0_level2.fits | modeM0/AS1A14_083T06_9000006558_56592cztM0_level2_quad_clean.evt |
| Size (bytes) | 433,779,840 | 85,872,960 |
| Size | 413.7 MB | 81.9 MB |
| Events in quadrant A | 5,987,286 | 535,442 |
| Events in quadrant B | 2,813,850 | 616,039 |
| Events in quadrant C | 2,646,903 | 543,358 |
| Events in quadrant D | 4,149,221 | 491,948 |
| Mode SS | |||
|---|---|---|---|
| Quadrant | BADHDUFLAG | Total packets | Discarded packets |
| A | 0 | 120 | 0 |
| B | 0 | 120 | 0 |
| C | 0 | 120 | 0 |
| D | 0 | 120 | 0 |
| Mode M9 | |||
|---|---|---|---|
| Quadrant | BADHDUFLAG | Total packets | Discarded packets |
| A | 0 | 11 | 0 |
| B | 0 | 11 | 0 |
| C | 0 | 11 | 0 |
| D | 0 | 11 | 0 |
| Mode M0 | |||
|---|---|---|---|
| Quadrant | BADHDUFLAG | Total packets | Discarded packets |
| A | 0 | 22013 | 1 |
| B | 0 | 12682 | 1 |
| C | 0 | 12575 | 1 |
| D | 0 | 16596 | 1 |
| Quadrant | Total seconds | Saturated seconds | Saturation percentage |
|---|---|---|---|
| A | 5917 | 523 | 8.838939% |
| B | 5916 | 48 | 0.811359% |
| C | 5917 | 41 | 0.692919% |
| D | 5917 | 336 | 5.678553% |
Noise dominated data is calculated using 1-second bins in cleaned event files. If a bin has >2000 counts, and if more than 50% of those come from <1% of pixels, then it is considered to be noise-dominated and hence unusable.
| Quadrant | # 1 sec bins | Bins with >0 counts | Bins with >2000 counts | High rate bins dominated by noise | Noise dominated (total time) | Noise dominated (detector-on time) | Marked lightcurve |
|---|---|---|---|---|---|---|---|
| A | 6997 | 5917 | 470 | 470 | 6.72% | 7.94% | 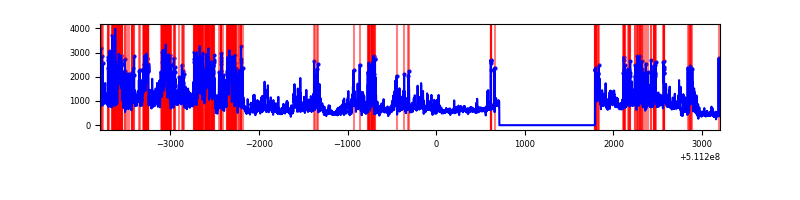 |
| B | 6996 | 5917 | 11 | 11 | 0.16% | 0.19% | 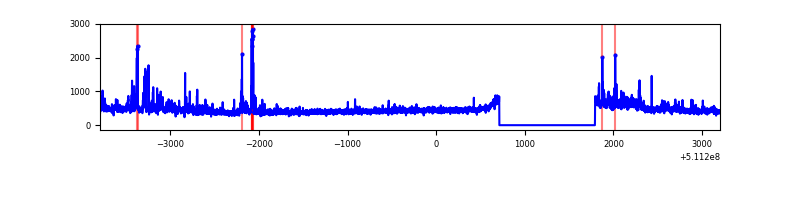 |
| C | 6997 | 5918 | 25 | 25 | 0.36% | 0.42% | 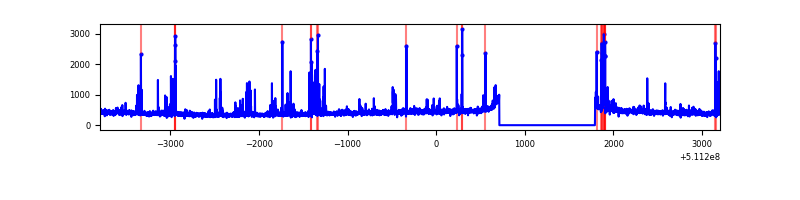 |
| D | 6997 | 5917 | 326 | 326 | 4.66% | 5.51% | 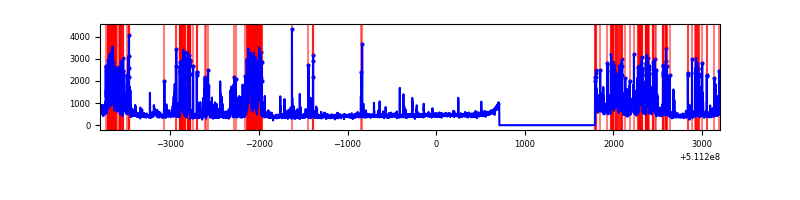 |
Top three noisy pixels from each quadrant. If the there are fewer than three noisy pixels in the level2.evt file, extra rows are filled as -1
| Pixel properties | Quadrant properties | ||||||
|---|---|---|---|---|---|---|---|
| Quadrant | DetID | PixID | Counts | Sigma | Mean | Median | Sigma |
| A | 7 | 64 | 2049730 | 13534.1 | 610 | 596 | 151.4 |
| A | 12 | 3 | 530056 | 3496.97 | 610 | 596 | 151.4 |
| A | 13 | 248 | 334940 | 2208.27 | 610 | 596 | 151.4 |
| B | 4 | 206 | 113182 | 828.52 | 628 | 605 | 135.9 |
| B | 5 | 185 | 86911 | 635.18 | 628 | 605 | 135.9 |
| B | 4 | 21 | 36862 | 266.84 | 628 | 605 | 135.9 |
| C | 14 | 254 | 112202 | 666.5 | 603 | 597 | 167.5 |
| C | 6 | 223 | 67316 | 398.44 | 603 | 597 | 167.5 |
| C | 13 | 3 | 41366 | 243.47 | 603 | 597 | 167.5 |
| D | 2 | 249 | 672219 | 3966.01 | 590 | 561 | 169.4 |
| D | 6 | 239 | 616871 | 3639.19 | 590 | 561 | 169.4 |
| D | 3 | 12 | 149818 | 881.33 | 590 | 561 | 169.4 |
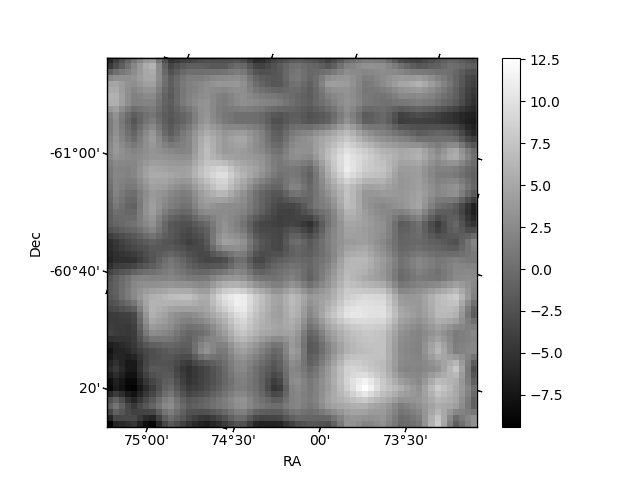
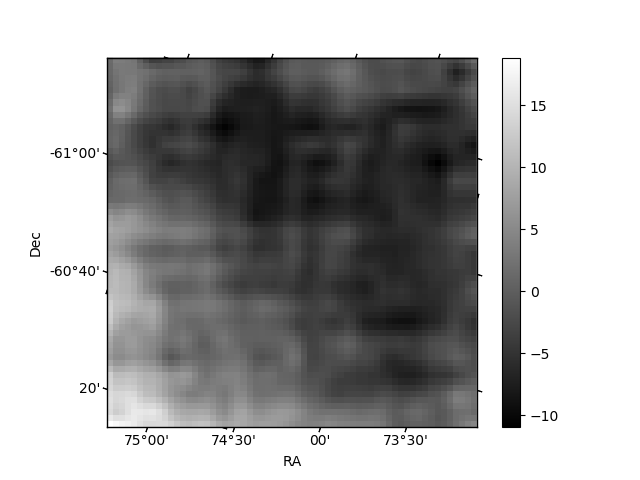
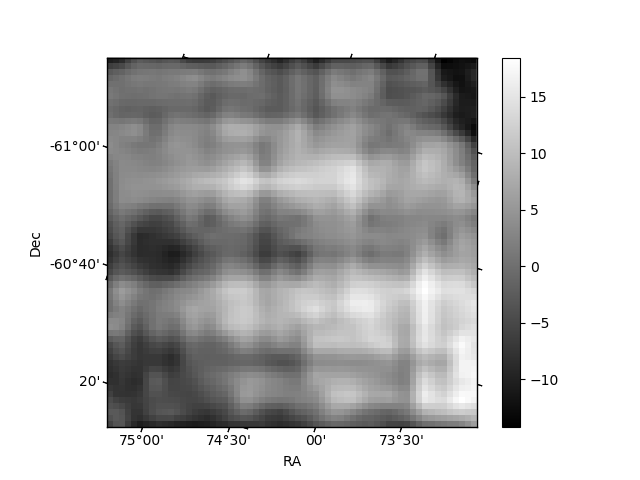
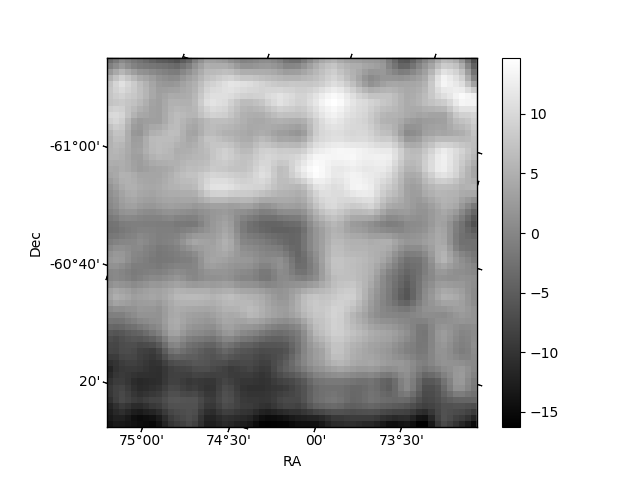
Histogram calculated using DETX and DETY for each event in the final _common_clean file
| Quadrant A | 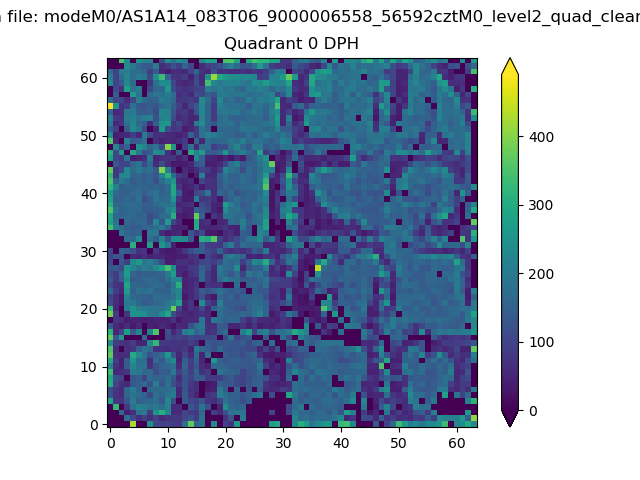 |
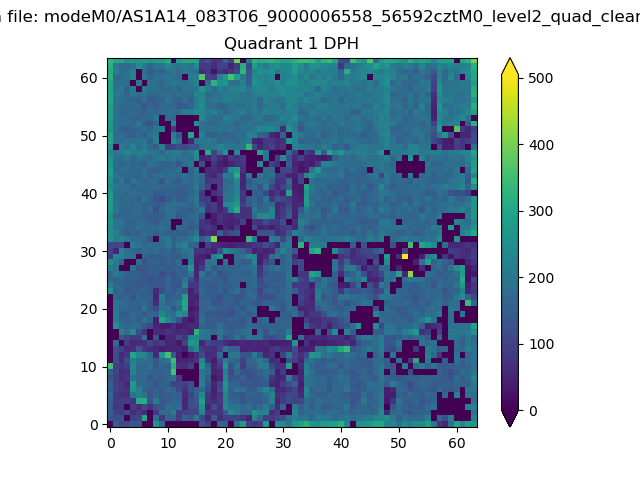 |
Quadrant B |
|---|---|---|---|
| Quadrant D | 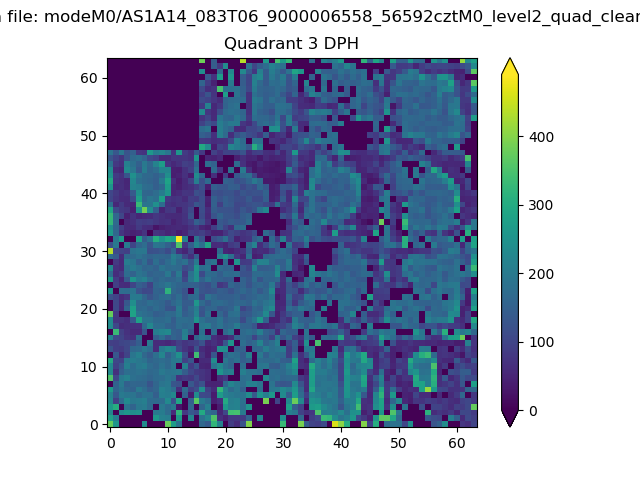 |
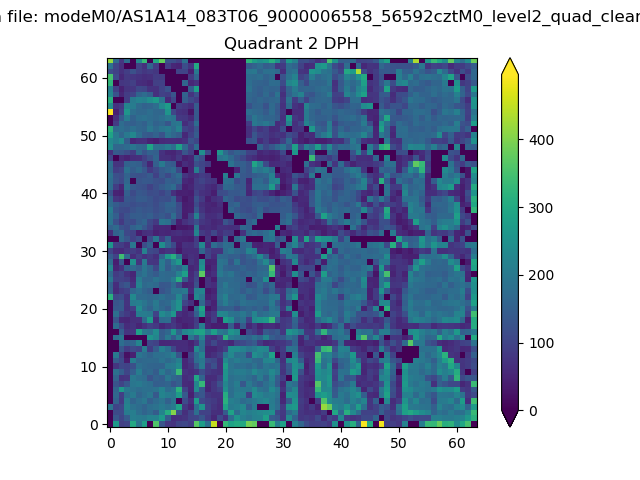 |
Quadrant C |
| Plot type | Count rate plots | Images |
|---|---|---|
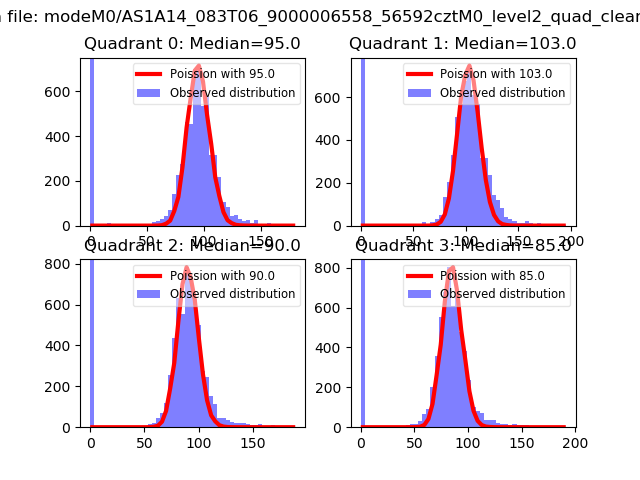
| Comparison with Poisson distribution Blue bars denote a histogram of data divided into 1 sec bins. Red curve is a Poisson curve with rate = median count rate of data. |
 |
 |
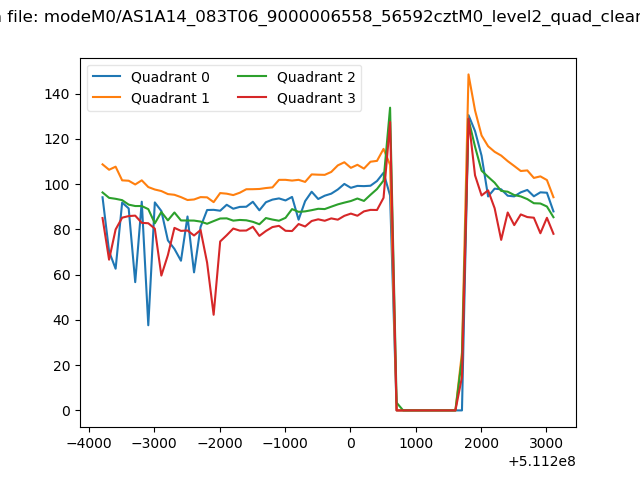
| Quadrant-wise count rates Data is divided into 100 sec bins |
 |
|
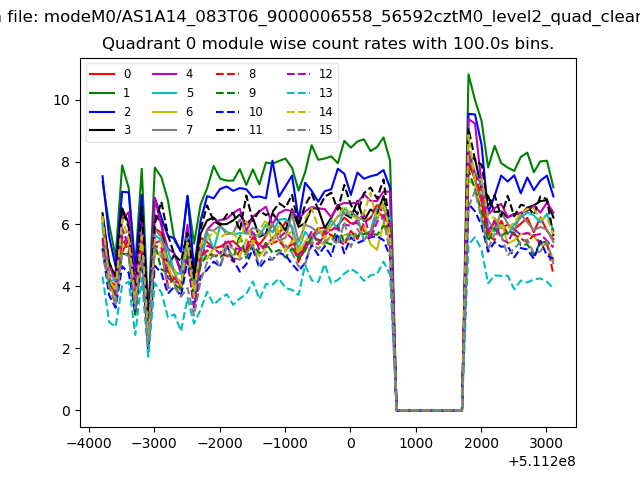
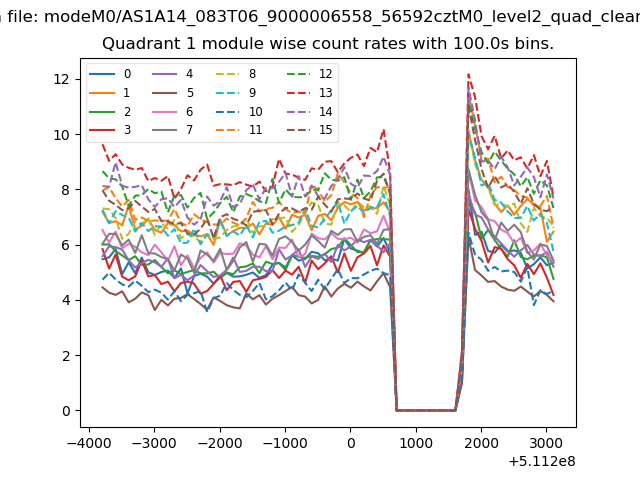
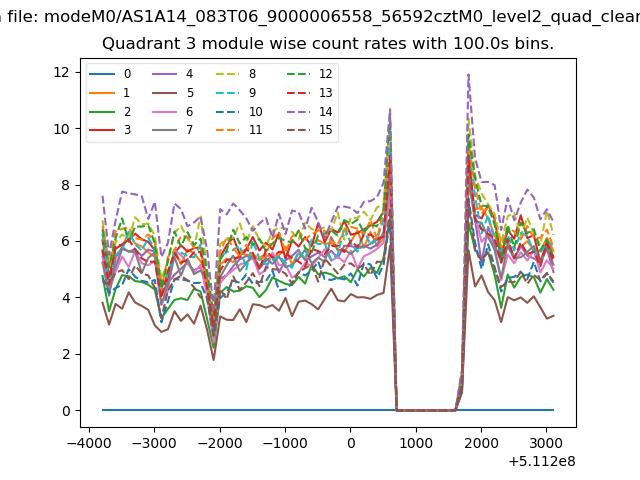
| Module-wise count rates for Quadrant A Data is divided into 100 sec bins |
 |
 |
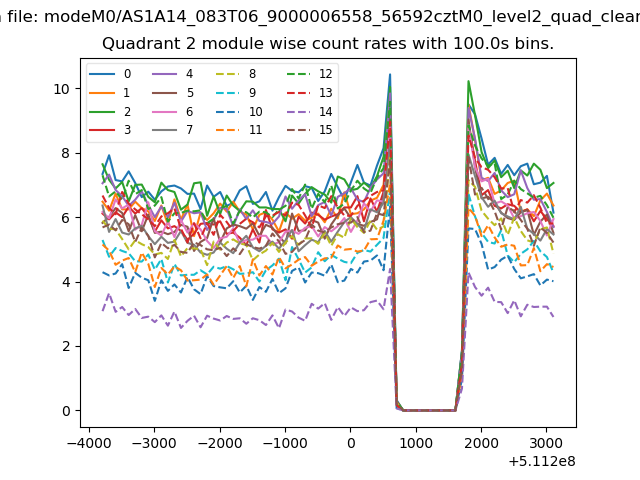
| Module-wise count rates for Quadrant B Data is divided into 100 sec bins |
 |
 |
| Module-wise count rates for Quadrant C Data is divided into 100 sec bins |
 |
 |
| Module-wise count rates for Quadrant D Data is divided into 100 sec bins |
 |
 |
| Parameter | Plot |
|---|---|
| CZT HV Monitor | 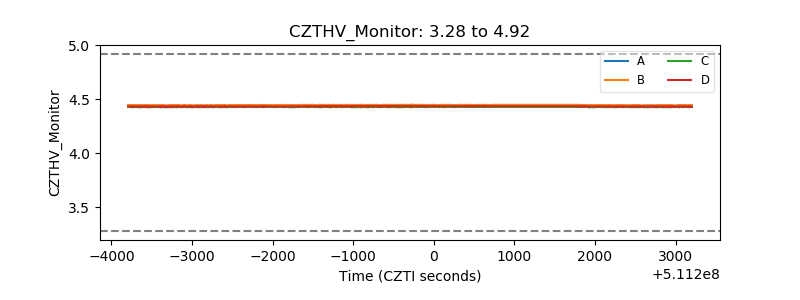 |
| D_VDD | 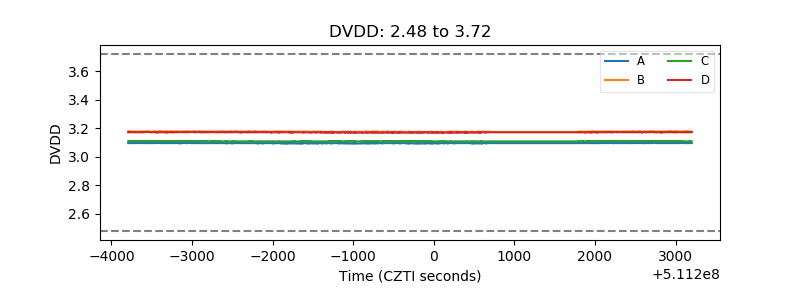 |
| Temperature 1 | 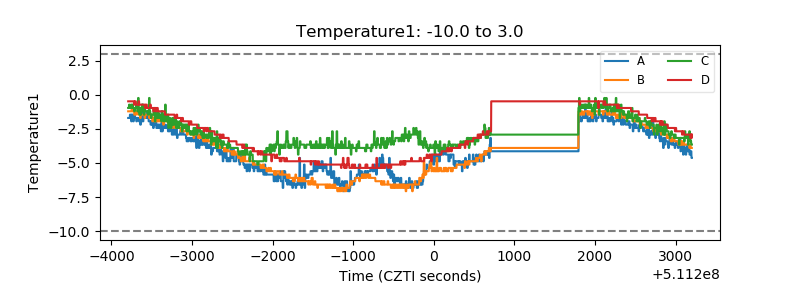 |
| Veto HV Monitor | 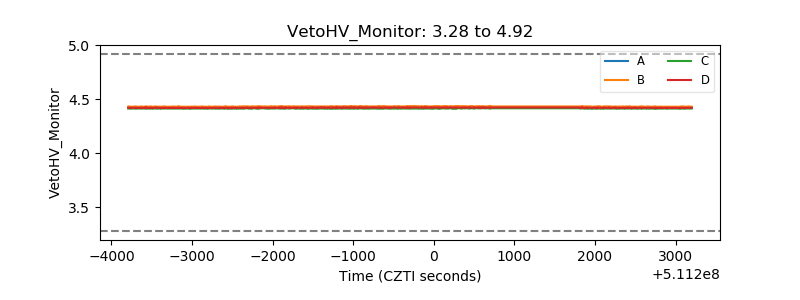 |
| Veto LLD | 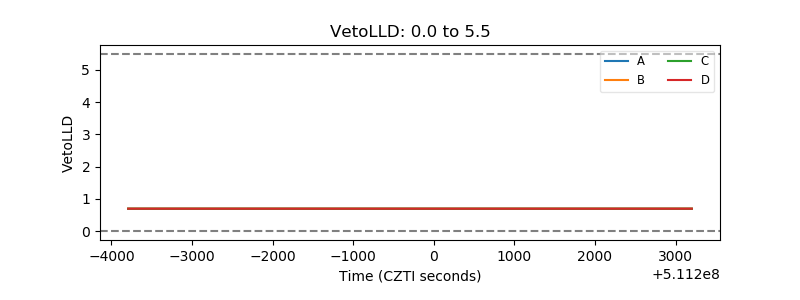 |
| Alpha Counter | 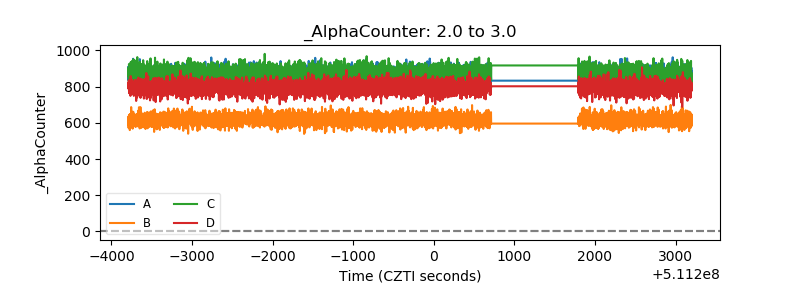 |
| _CPM_Rate | 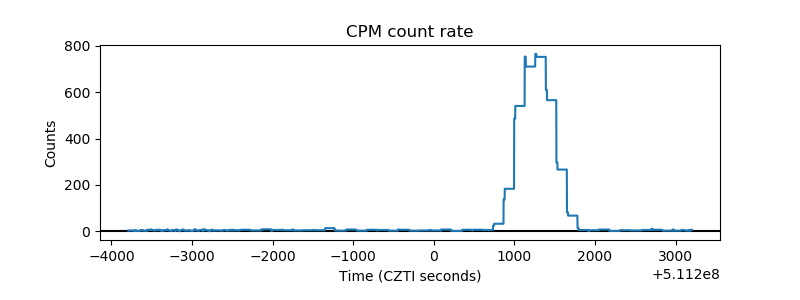 |
| CZT Counter | 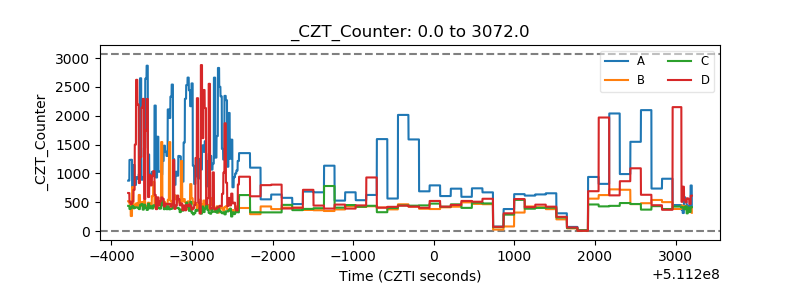 |
| +2.5 Volts monitor |  |
| +5 Volts monitor |  |
| _ROLL_ROT | 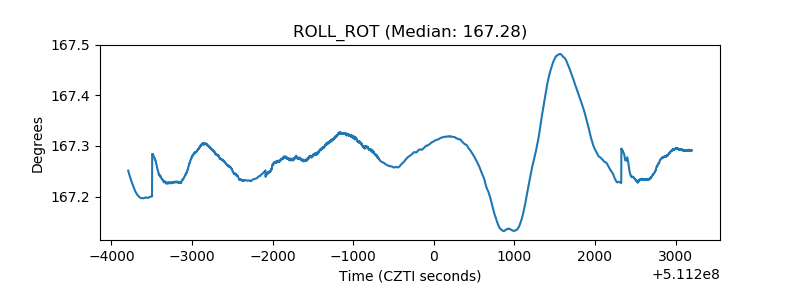 |
| _Roll_DEC | 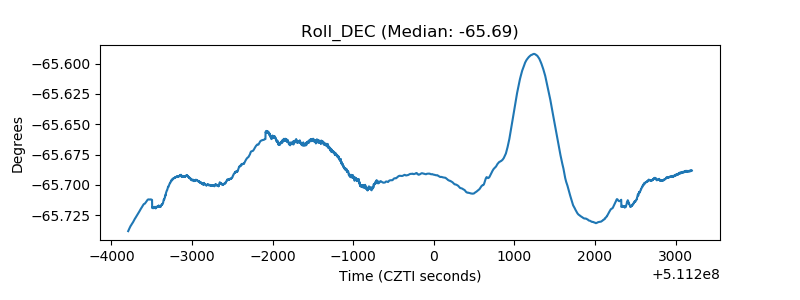 |
| _Roll_RA | 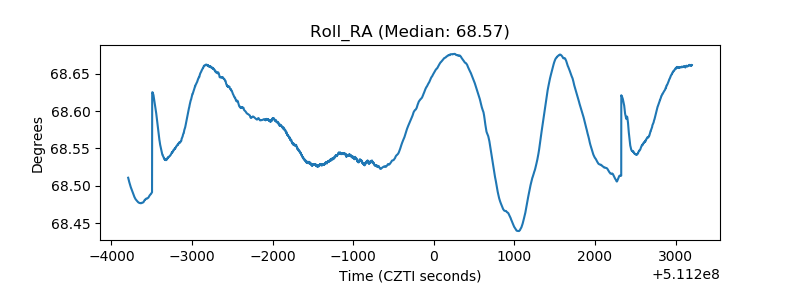 |
| Veto Counter | 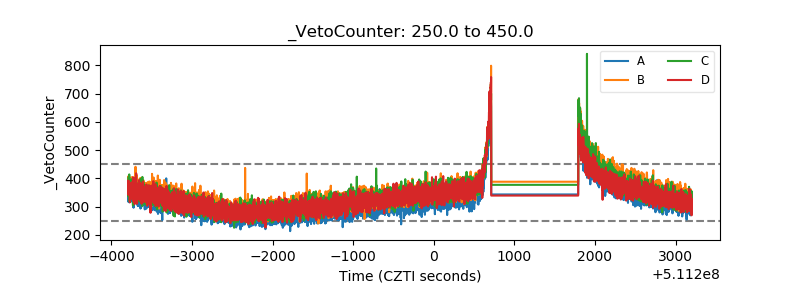 |