| Param | Original file | Final file |
|---|---|---|
| Filename | modeM0/AS1A14_083T06_9000006558_56595cztM0_level2.fits | modeM0/AS1A14_083T06_9000006558_56595cztM0_level2_quad_clean.evt |
| Size (bytes) | 357,145,920 | 72,852,480 |
| Size | 340.6 MB | 69.5 MB |
| Events in quadrant A | 4,398,714 | 612,647 |
| Events in quadrant B | 4,322,840 | 670,835 |
| Events in quadrant C | 4,111,319 | 576,532 |
| Events in quadrant D | 12,943 | 16 |
| Mode SS | |||
|---|---|---|---|
| Quadrant | BADHDUFLAG | Total packets | Discarded packets |
| A | 0 | 132 | 0 |
| B | 0 | 132 | 0 |
| C | 0 | 132 | 0 |
| D | 0 | 132 | 0 |
| Mode M9 | |||
|---|---|---|---|
| Quadrant | BADHDUFLAG | Total packets | Discarded packets |
| A | 0 | 14 | 0 |
| B | 0 | 14 | 0 |
| C | 0 | 15 | 0 |
| D | 0 | 15 | 0 |
| Mode M0 | |||
|---|---|---|---|
| Quadrant | BADHDUFLAG | Total packets | Discarded packets |
| A | 0 | 17624 | 0 |
| B | 0 | 17315 | 0 |
| C | 0 | 16879 | 0 |
| D | 0 | 44 | 0 |
| Quadrant | Total seconds | Saturated seconds | Saturation percentage |
|---|---|---|---|
| A | 6416 | 437 | 6.811097% |
| B | 6416 | 354 | 5.517456% |
| C | 6415 | 438 | 6.827747% |
| D | 7 | 7 | 100.000000% |
Noise dominated data is calculated using 1-second bins in cleaned event files. If a bin has >2000 counts, and if more than 50% of those come from <1% of pixels, then it is considered to be noise-dominated and hence unusable.
| Quadrant | # 1 sec bins | Bins with >0 counts | Bins with >2000 counts | High rate bins dominated by noise | Noise dominated (total time) | Noise dominated (detector-on time) | Marked lightcurve |
|---|---|---|---|---|---|---|---|
| A | 7581 | 6417 | 405 | 405 | 5.34% | 6.31% | 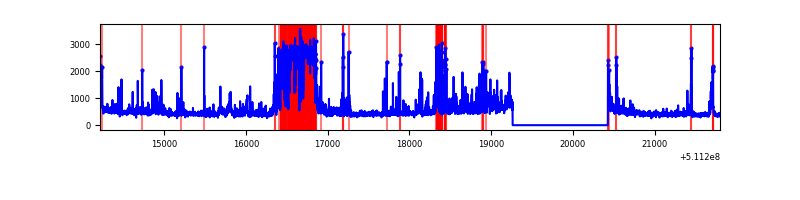 |
| B | 7581 | 6417 | 271 | 271 | 3.57% | 4.22% | 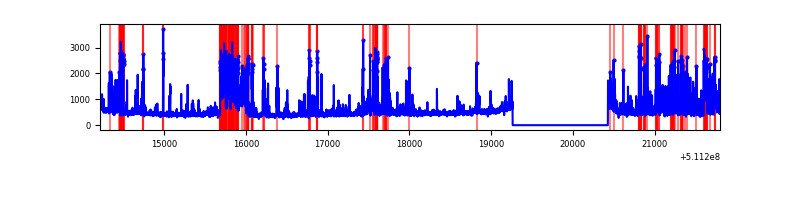 |
| C | 7580 | 6416 | 132 | 132 | 1.74% | 2.06% | 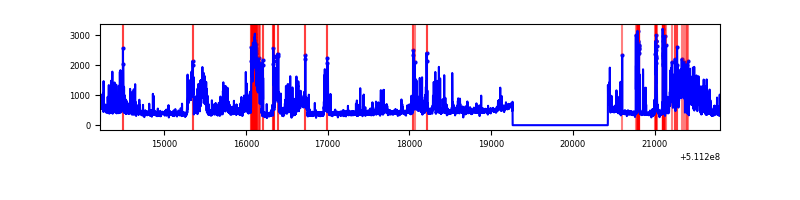 |
| D | 7 | 7 | 4 | 4 | 57.14% | 57.14% |  |
Top three noisy pixels from each quadrant. If the there are fewer than three noisy pixels in the level2.evt file, extra rows are filled as -1
| Pixel properties | Quadrant properties | ||||||
|---|---|---|---|---|---|---|---|
| Quadrant | DetID | PixID | Counts | Sigma | Mean | Median | Sigma |
| A | 12 | 3 | 1052960 | 6382.5 | 667 | 651 | 164.9 |
| A | 0 | 8 | 173555 | 1048.7 | 667 | 651 | 164.9 |
| A | 3 | 14 | 147773 | 892.33 | 667 | 651 | 164.9 |
| B | 5 | 185 | 1287709 | 9002.65 | 673 | 649 | 143.0 |
| B | 5 | 236 | 173663 | 1210.19 | 673 | 649 | 143.0 |
| B | 4 | 141 | 30826 | 211.08 | 673 | 649 | 143.0 |
| C | 15 | 230 | 520202 | 2951.34 | 644 | 638 | 176.0 |
| C | 15 | 215 | 466973 | 2648.98 | 644 | 638 | 176.0 |
| C | 15 | 199 | 113530 | 641.27 | 644 | 638 | 176.0 |
| D | 6 | 239 | 9511 | 12690.2 | 0 | 0 | 0.7 |
| D | 15 | 30 | 206 | 274.86 | 0 | 0 | 0.7 |
| D | 5 | 32 | 176 | 234.83 | 0 | 0 | 0.7 |
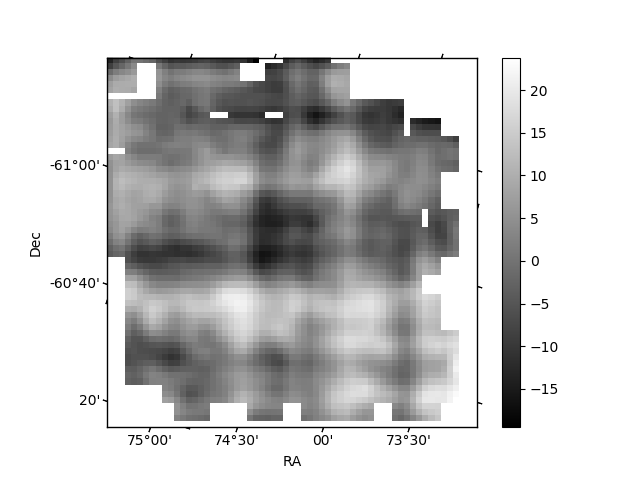
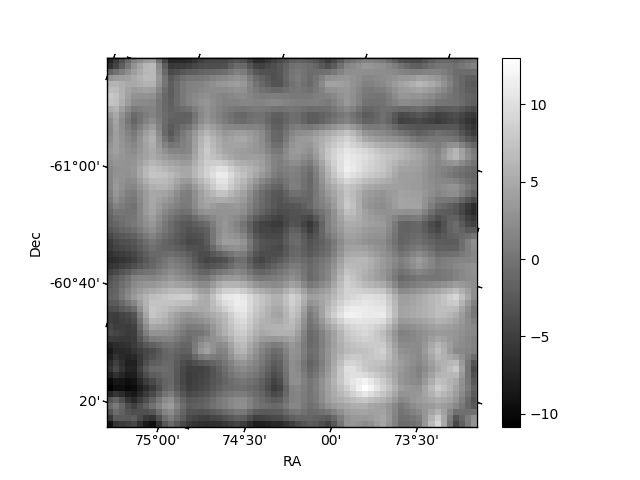
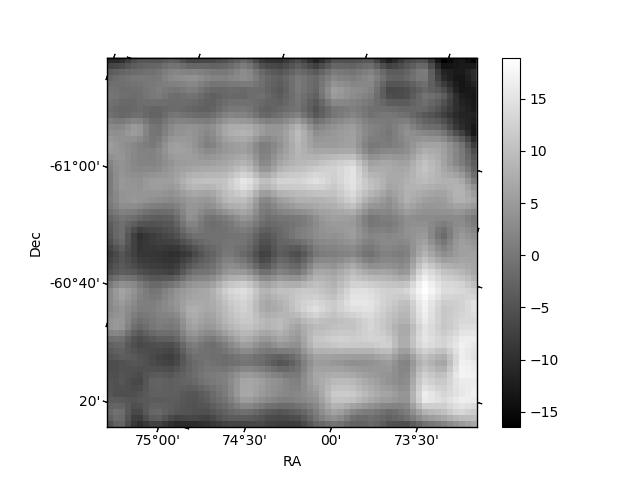
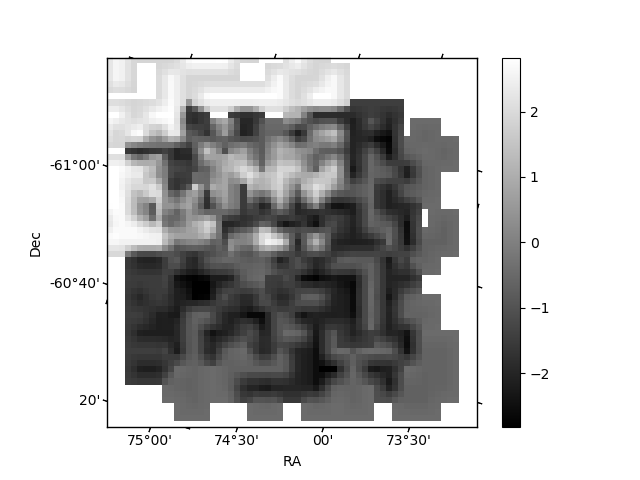
Histogram calculated using DETX and DETY for each event in the final _common_clean file
| Quadrant A | 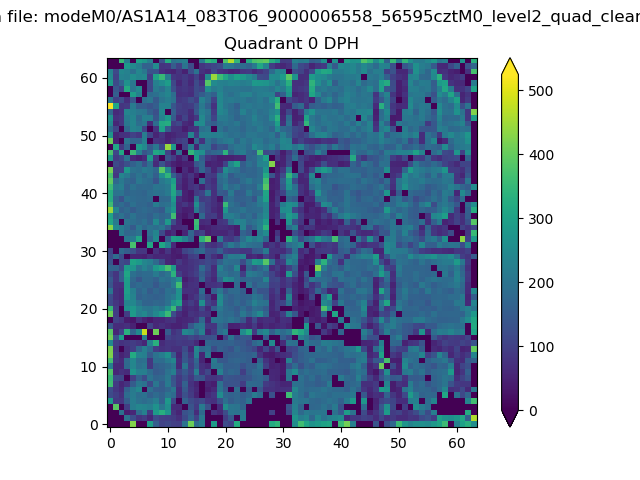 |
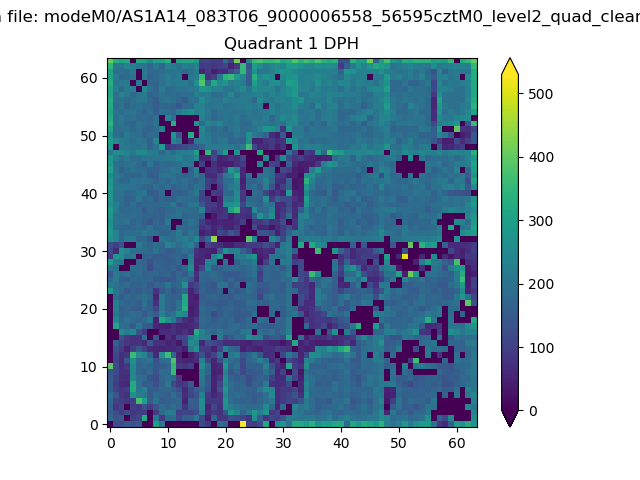 |
Quadrant B |
|---|---|---|---|
| Quadrant D | 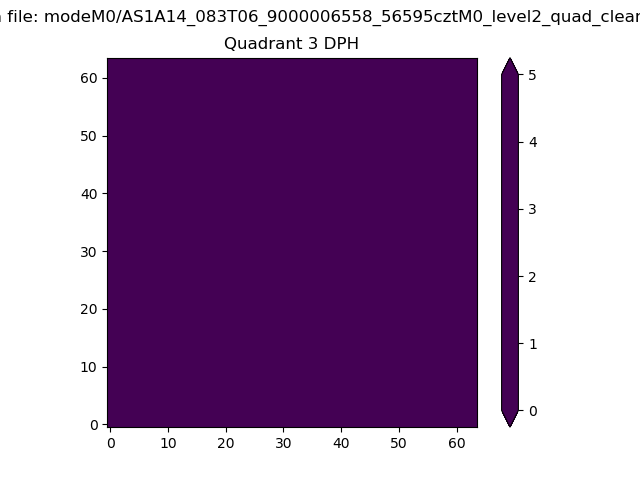 |
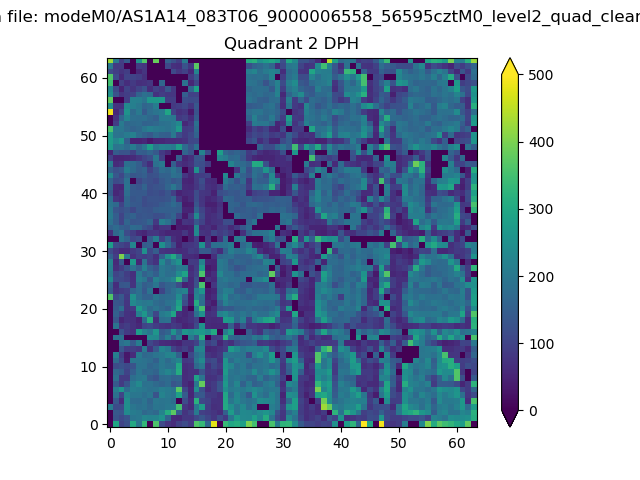 |
Quadrant C |
| Plot type | Count rate plots | Images |
|---|---|---|
| Comparison with Poisson distribution Blue bars denote a histogram of data divided into 1 sec bins. Red curve is a Poisson curve with rate = median count rate of data. |
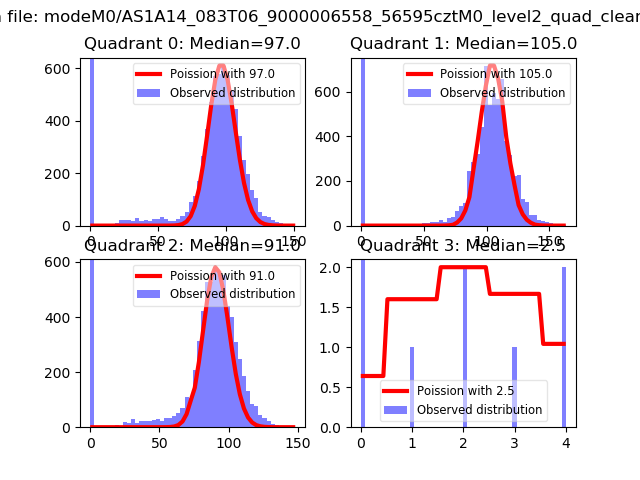 |
 |
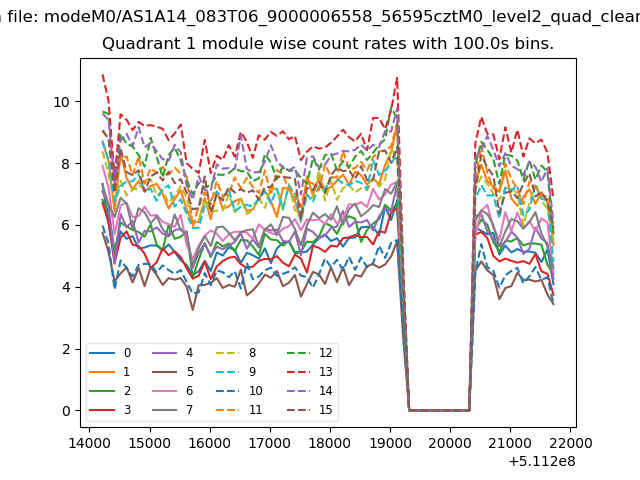
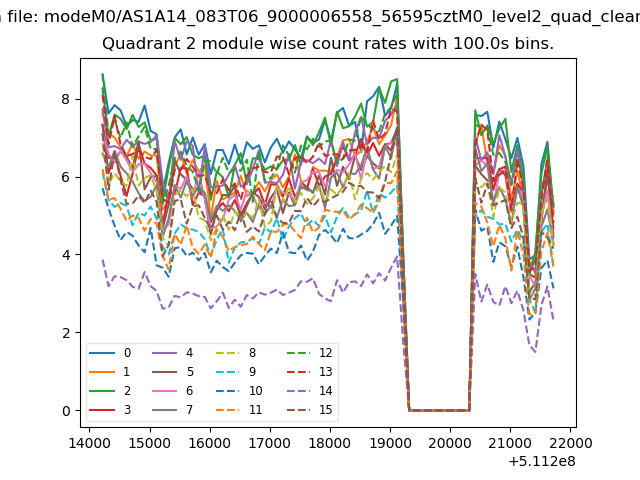
| Quadrant-wise count rates Data is divided into 100 sec bins |
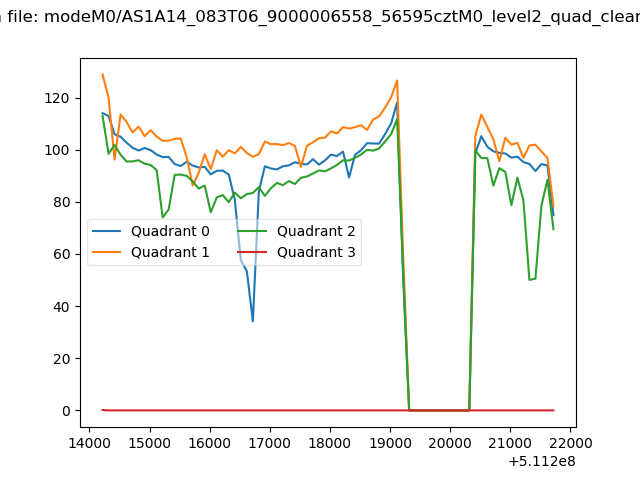 |
|
| Module-wise count rates for Quadrant A Data is divided into 100 sec bins |
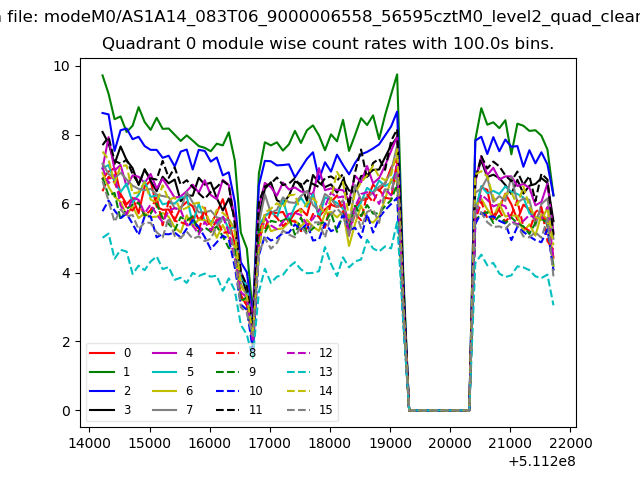 |
 |
| Module-wise count rates for Quadrant B Data is divided into 100 sec bins |
 |
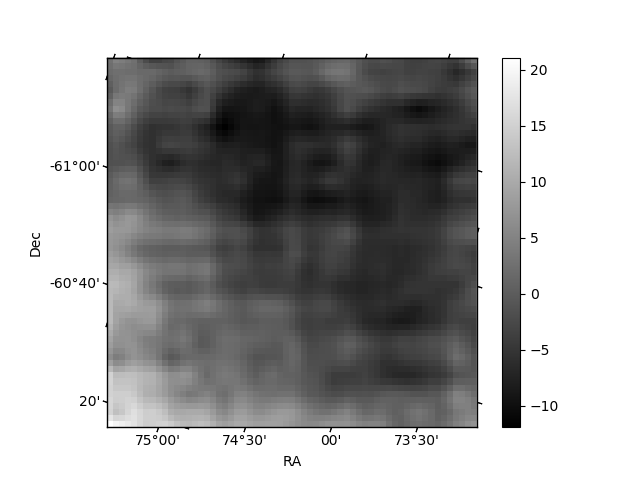 |
| Module-wise count rates for Quadrant C Data is divided into 100 sec bins |
 |
 |
| Module-wise count rates for Quadrant D Data is divided into 100 sec bins |
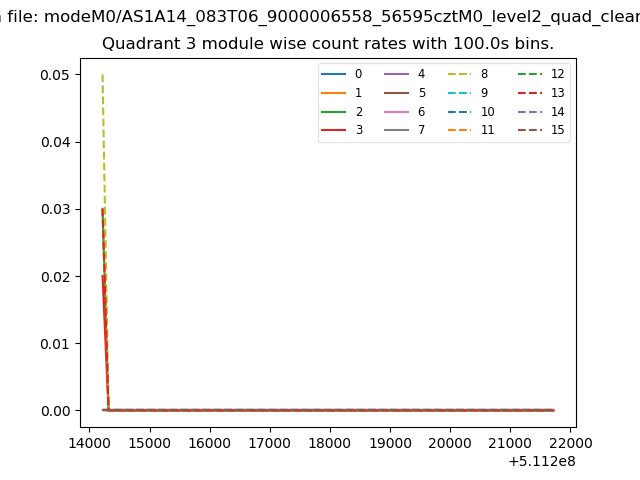 |
 |
| Parameter | Plot |
|---|---|
| CZT HV Monitor | 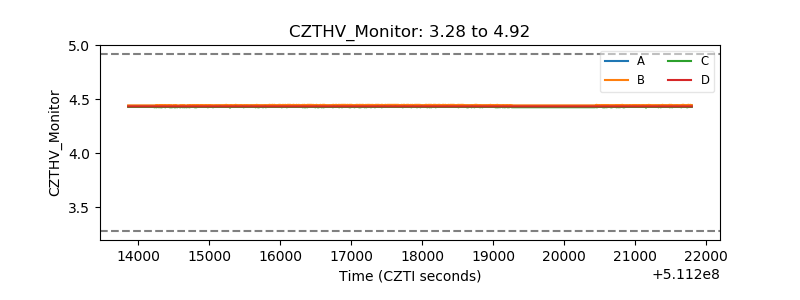 |
| D_VDD | 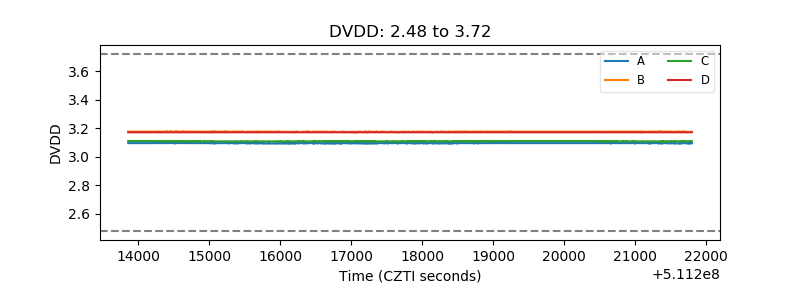 |
| Temperature 1 | 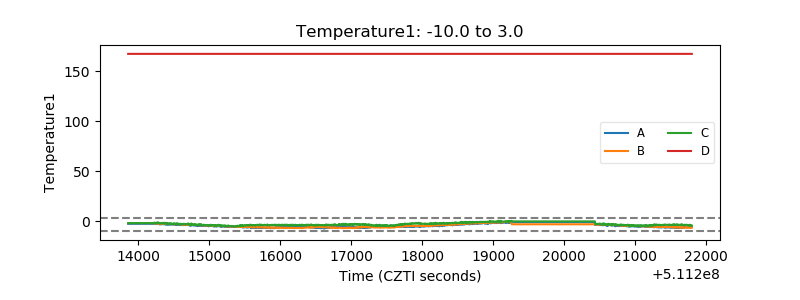 |
| Veto HV Monitor | 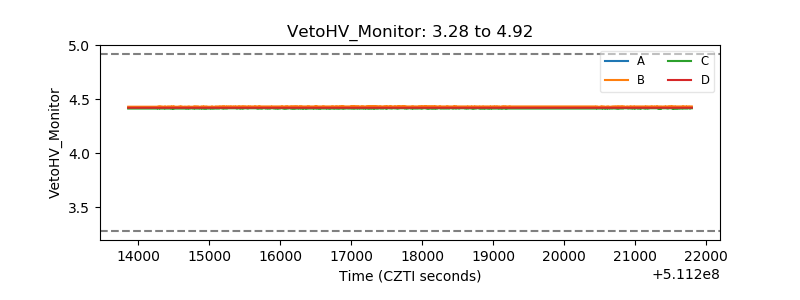 |
| Veto LLD | 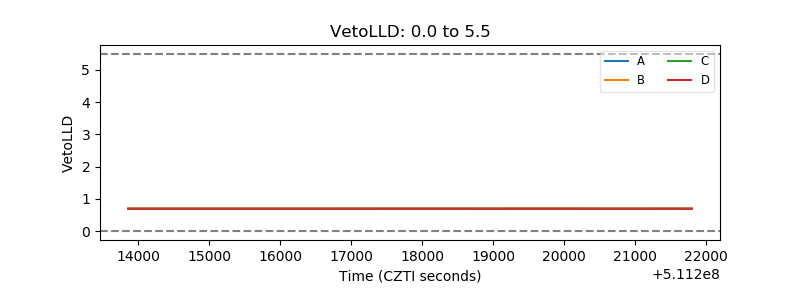 |
| Alpha Counter | 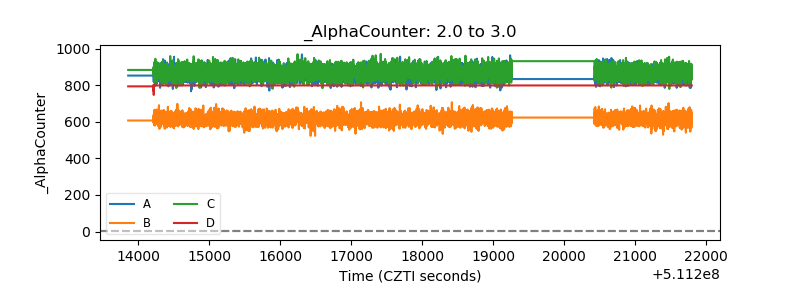 |
| _CPM_Rate | 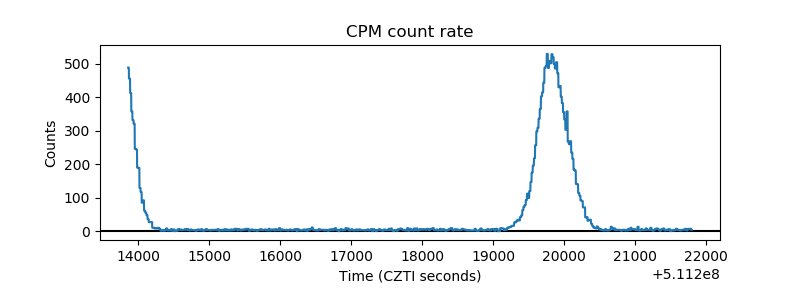 |
| CZT Counter | 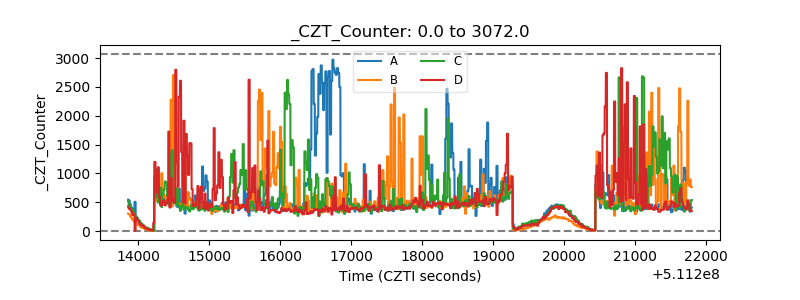 |
| +2.5 Volts monitor |  |
| +5 Volts monitor |  |
| _ROLL_ROT | 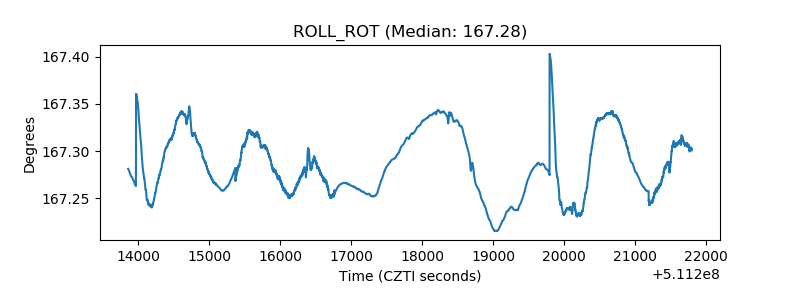 |
| _Roll_DEC | 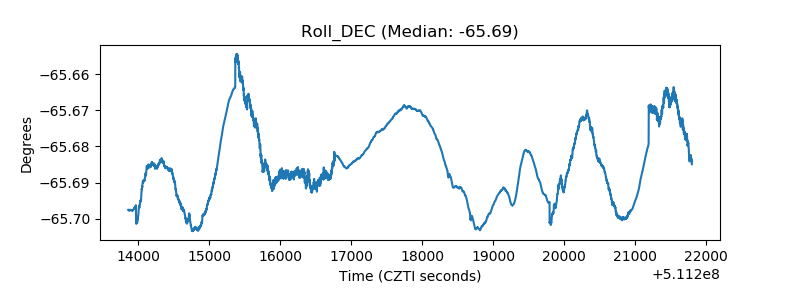 |
| _Roll_RA | 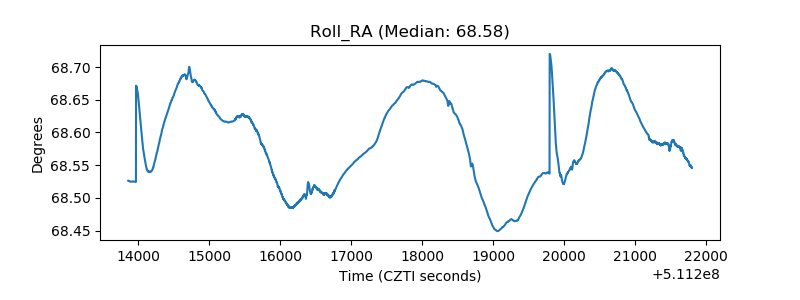 |
| Veto Counter | 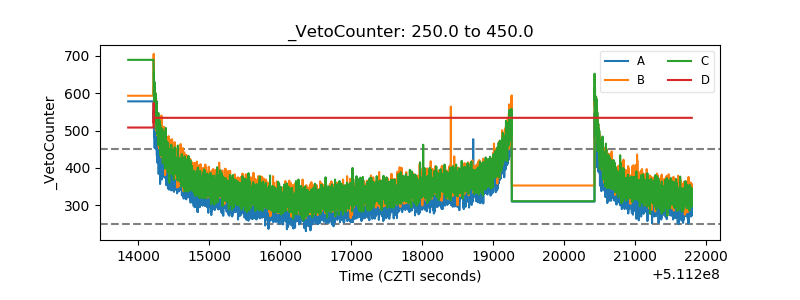 |