| Param | Original file | Final file |
|---|---|---|
| Filename | modeM0/AS1A14_083T06_9000006558_56596cztM0_level2.fits | modeM0/AS1A14_083T06_9000006558_56596cztM0_level2_quad_clean.evt |
| Size (bytes) | 453,363,840 | 94,466,880 |
| Size | 432.4 MB | 90.1 MB |
| Events in quadrant A | 3,528,456 | 628,775 |
| Events in quadrant B | 3,895,281 | 684,006 |
| Events in quadrant C | 4,474,098 | 550,417 |
| Events in quadrant D | 4,365,267 | 532,069 |
| Mode SS | |||
|---|---|---|---|
| Quadrant | BADHDUFLAG | Total packets | Discarded packets |
| A | 0 | 138 | 0 |
| B | 0 | 138 | 0 |
| C | 0 | 138 | 0 |
| D | 0 | 138 | 0 |
| Mode M9 | |||
|---|---|---|---|
| Quadrant | BADHDUFLAG | Total packets | Discarded packets |
| A | 0 | 21 | 0 |
| B | 0 | 21 | 0 |
| C | 0 | 21 | 0 |
| D | 0 | 21 | 0 |
| Mode M0 | |||
|---|---|---|---|
| Quadrant | BADHDUFLAG | Total packets | Discarded packets |
| A | 0 | 15470 | 2 |
| B | 0 | 16208 | 2 |
| C | 0 | 18217 | 2 |
| D | 0 | 17979 | 2 |
| Quadrant | Total seconds | Saturated seconds | Saturation percentage |
|---|---|---|---|
| A | 6668 | 189 | 2.834433% |
| B | 6668 | 203 | 3.044391% |
| C | 6668 | 646 | 9.688062% |
| D | 6668 | 446 | 6.688662% |
Noise dominated data is calculated using 1-second bins in cleaned event files. If a bin has >2000 counts, and if more than 50% of those come from <1% of pixels, then it is considered to be noise-dominated and hence unusable.
| Quadrant | # 1 sec bins | Bins with >0 counts | Bins with >2000 counts | High rate bins dominated by noise | Noise dominated (total time) | Noise dominated (detector-on time) | Marked lightcurve |
|---|---|---|---|---|---|---|---|
| A | 8808 | 6670 | 143 | 143 | 1.62% | 2.14% | 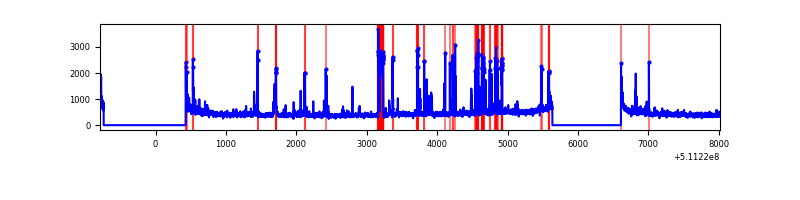 |
| B | 8808 | 6669 | 104 | 104 | 1.18% | 1.56% | 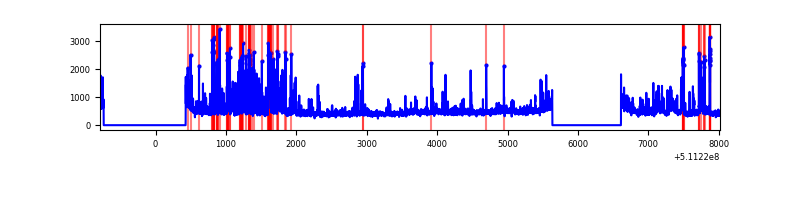 |
| C | 8808 | 6670 | 291 | 291 | 3.30% | 4.36% | 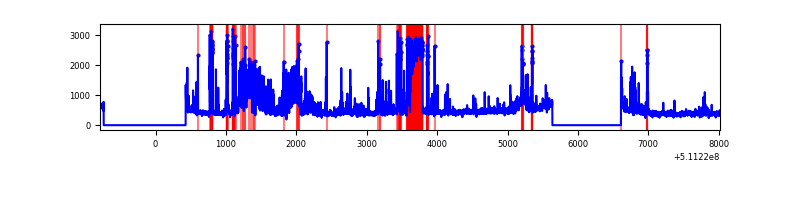 |
| D | 8808 | 6670 | 401 | 401 | 4.55% | 6.01% | 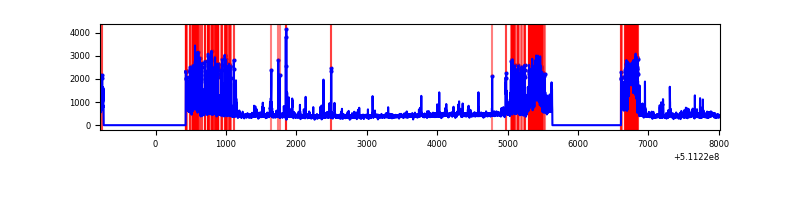 |
Top three noisy pixels from each quadrant. If the there are fewer than three noisy pixels in the level2.evt file, extra rows are filled as -1
| Pixel properties | Quadrant properties | ||||||
|---|---|---|---|---|---|---|---|
| Quadrant | DetID | PixID | Counts | Sigma | Mean | Median | Sigma |
| A | 0 | 8 | 295079 | 1697.93 | 702 | 684 | 173.4 |
| A | 4 | 249 | 197714 | 1136.38 | 702 | 684 | 173.4 |
| A | 3 | 14 | 77153 | 441.04 | 702 | 684 | 173.4 |
| B | 5 | 185 | 783307 | 5260.71 | 703 | 676 | 148.8 |
| B | 5 | 236 | 99800 | 666.29 | 703 | 676 | 148.8 |
| B | 3 | 145 | 80858 | 538.97 | 703 | 676 | 148.8 |
| C | 12 | 252 | 697858 | 3851.51 | 658 | 651 | 181.0 |
| C | 15 | 230 | 367115 | 2024.42 | 658 | 651 | 181.0 |
| C | 15 | 199 | 142984 | 786.28 | 658 | 651 | 181.0 |
| D | 6 | 239 | 862143 | 4627.21 | 658 | 628 | 186.2 |
| D | 2 | 249 | 460815 | 2471.67 | 658 | 628 | 186.2 |
| D | 2 | 31 | 107178 | 572.28 | 658 | 628 | 186.2 |
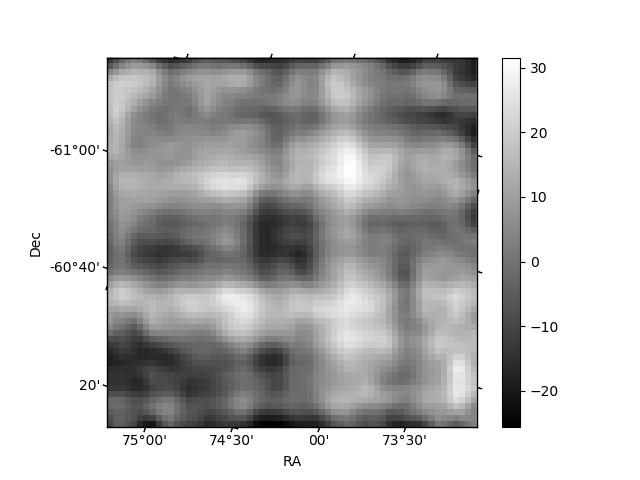
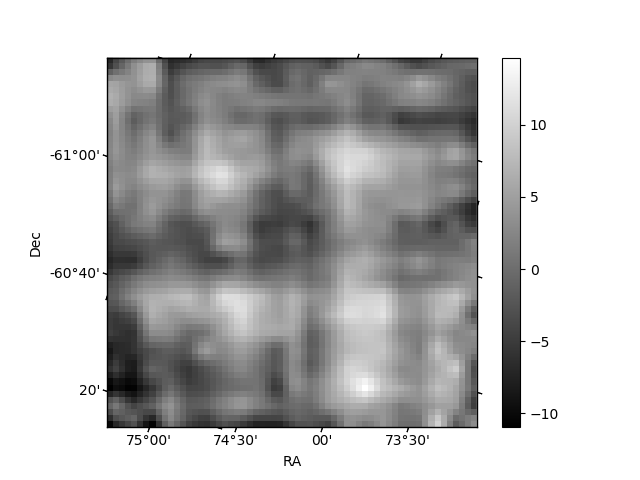
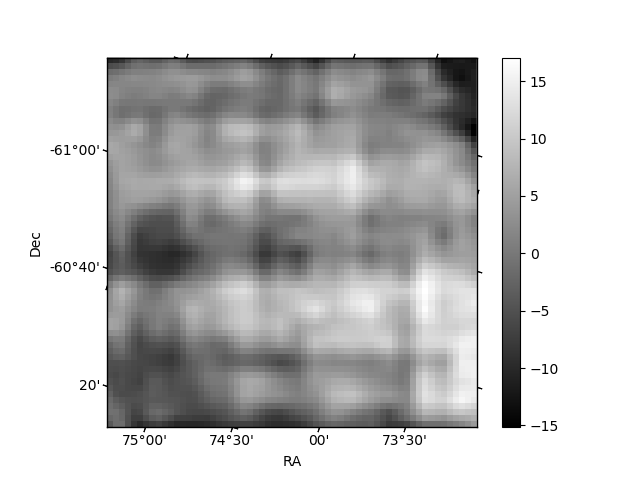
Histogram calculated using DETX and DETY for each event in the final _common_clean file
| Quadrant A | 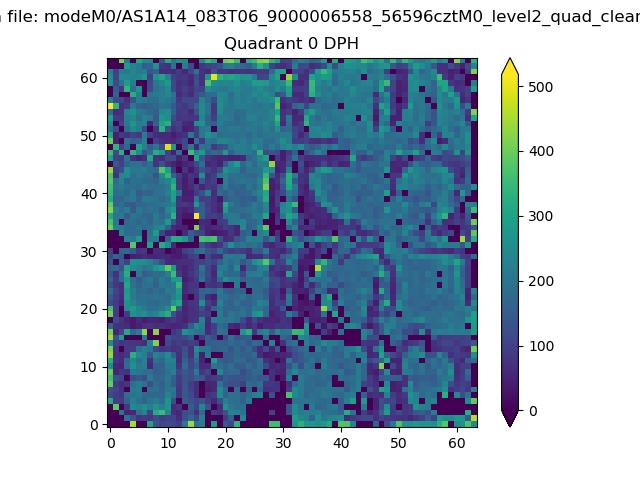 |
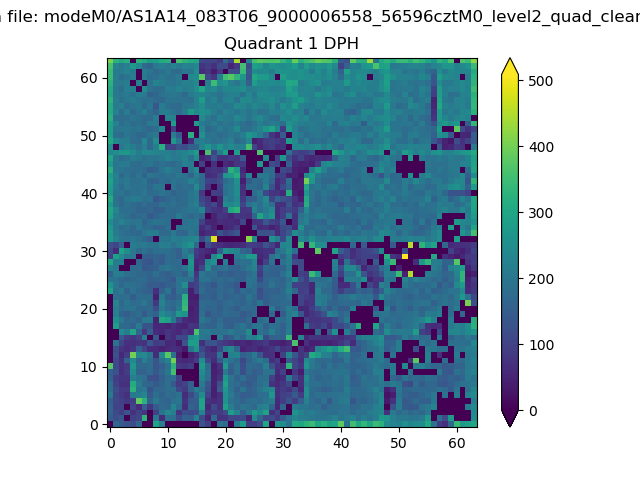 |
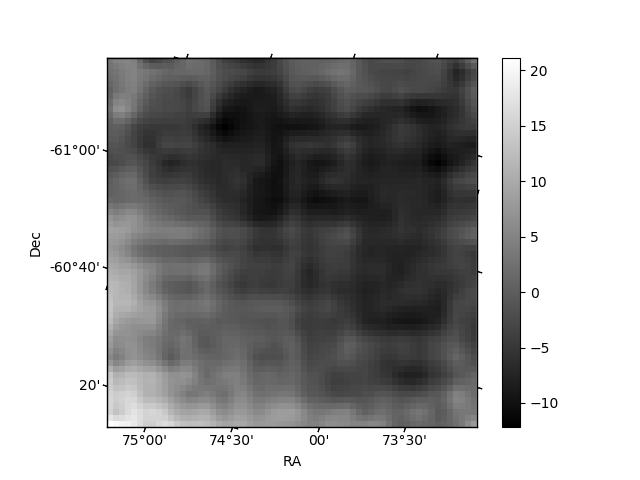
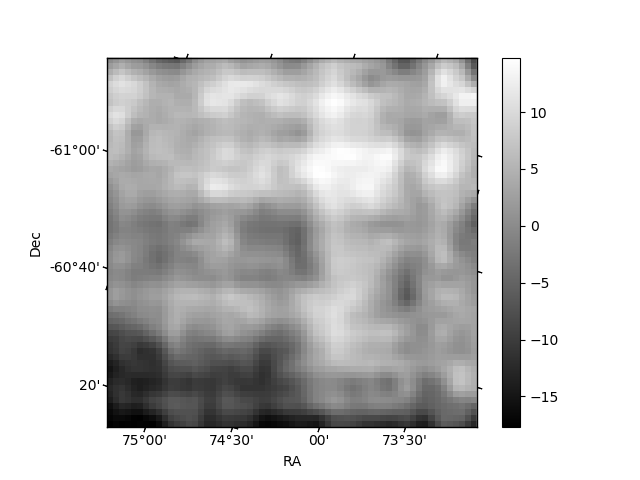
Quadrant B |
|---|---|---|---|
| Quadrant D | 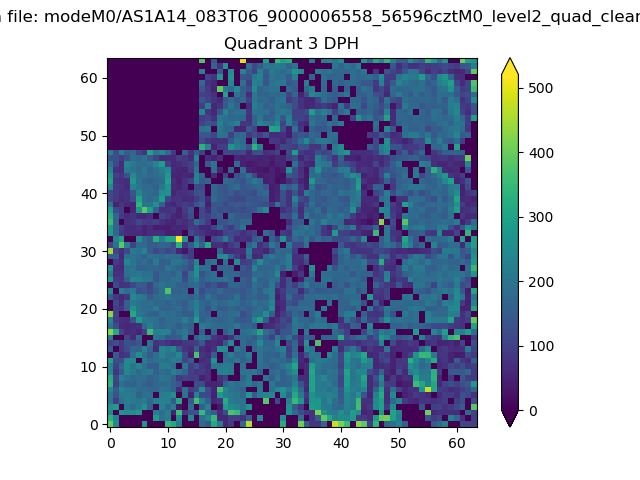 |
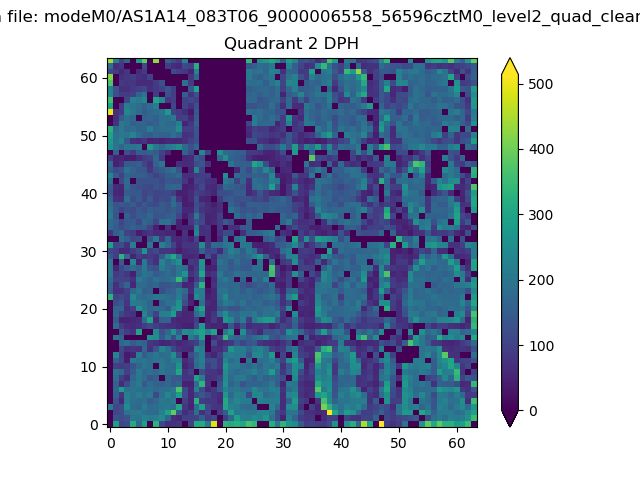 |
Quadrant C |
| Plot type | Count rate plots | Images |
|---|---|---|
| Comparison with Poisson distribution Blue bars denote a histogram of data divided into 1 sec bins. Red curve is a Poisson curve with rate = median count rate of data. |
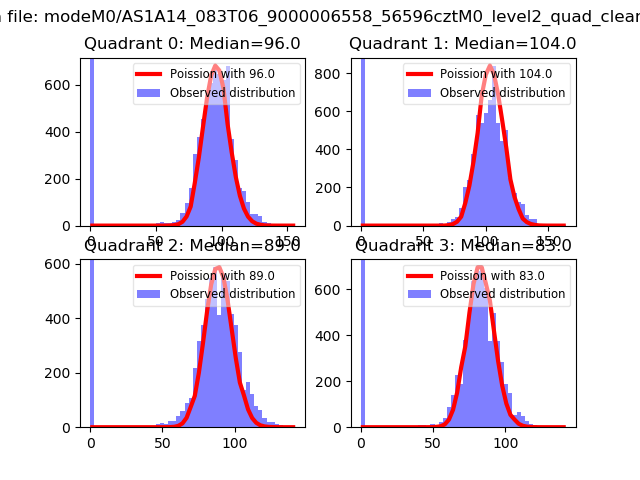 |
 |
| Quadrant-wise count rates Data is divided into 100 sec bins |
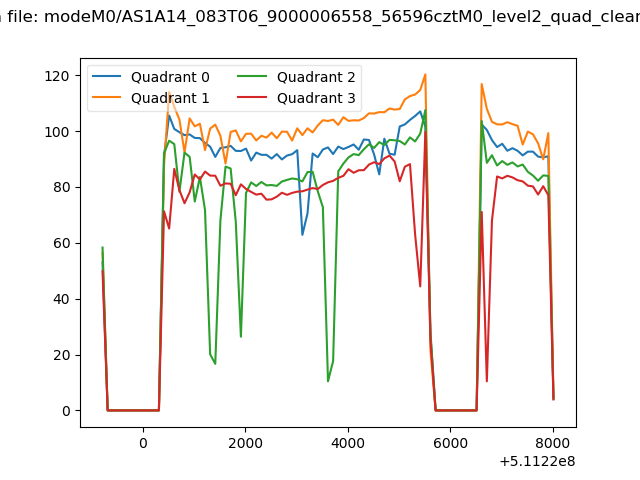 |
|
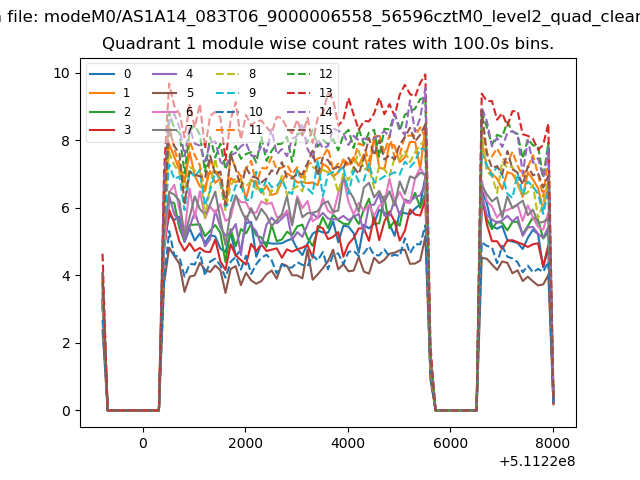
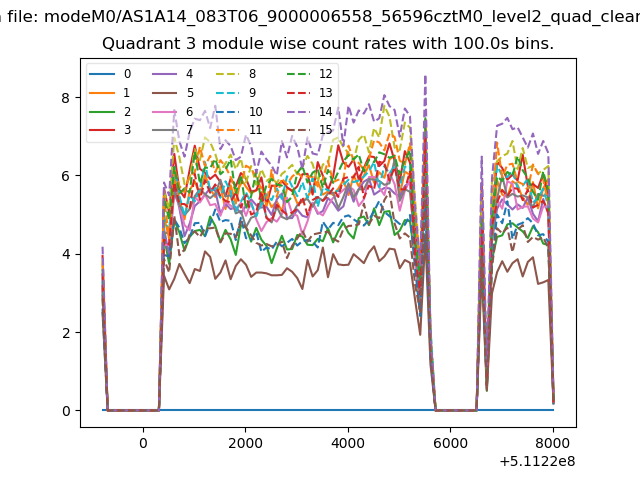
| Module-wise count rates for Quadrant A Data is divided into 100 sec bins |
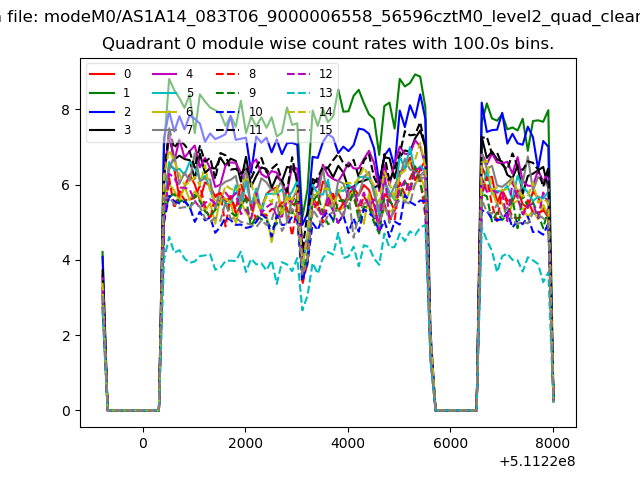 |
 |
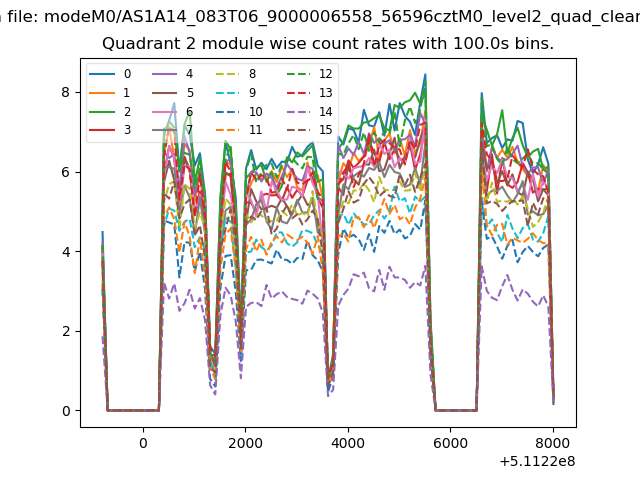
| Module-wise count rates for Quadrant B Data is divided into 100 sec bins |
 |
 |
| Module-wise count rates for Quadrant C Data is divided into 100 sec bins |
 |
 |
| Module-wise count rates for Quadrant D Data is divided into 100 sec bins |
 |
 |
| Parameter | Plot |
|---|---|
| CZT HV Monitor | 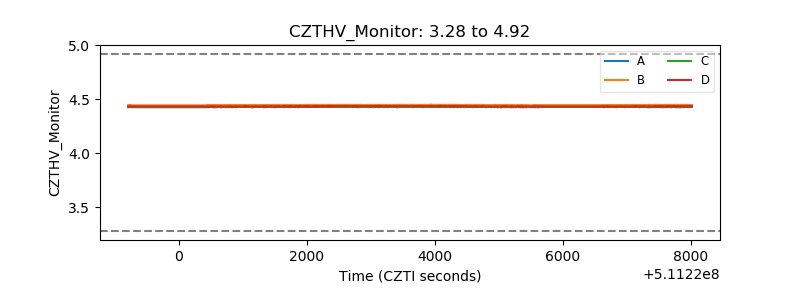 |
| D_VDD | 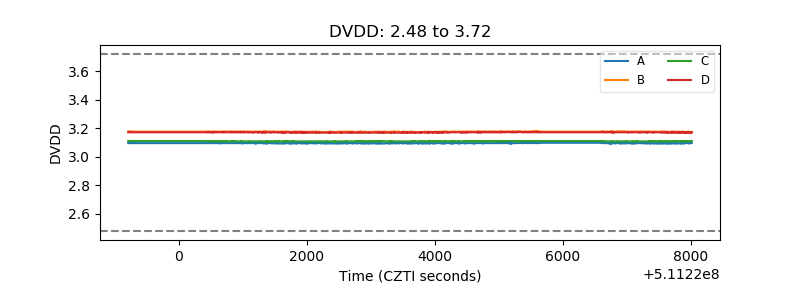 |
| Temperature 1 | 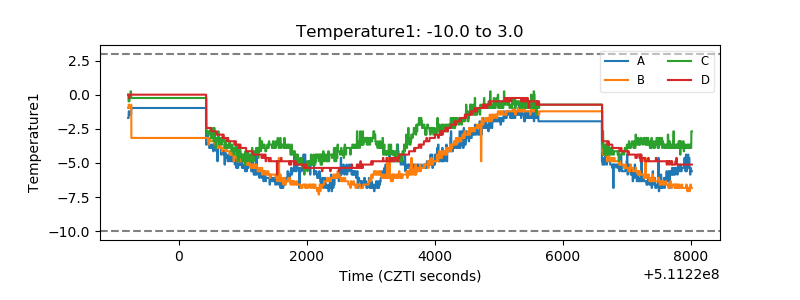 |
| Veto HV Monitor | 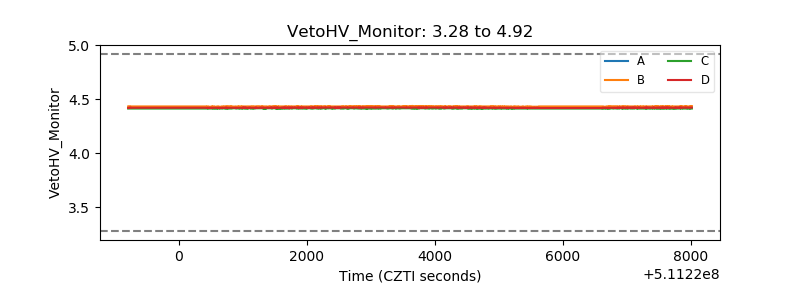 |
| Veto LLD | 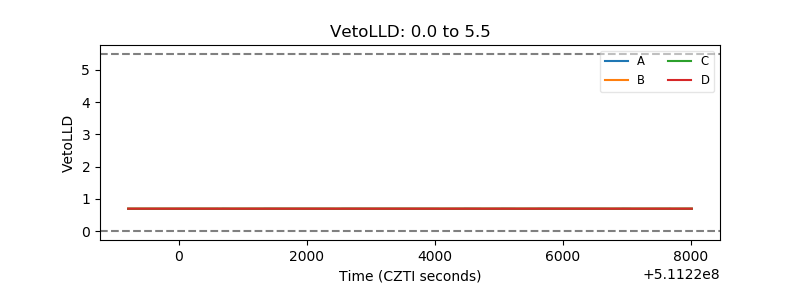 |
| Alpha Counter | 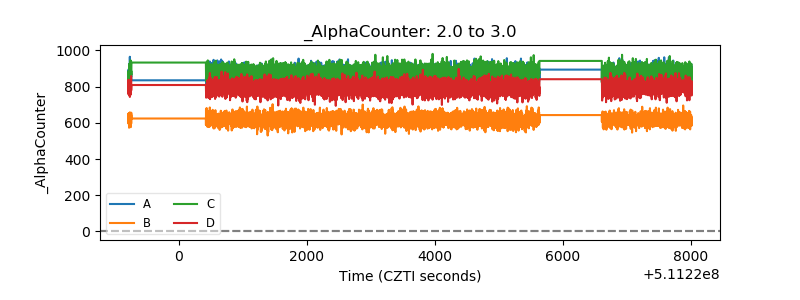 |
| _CPM_Rate | 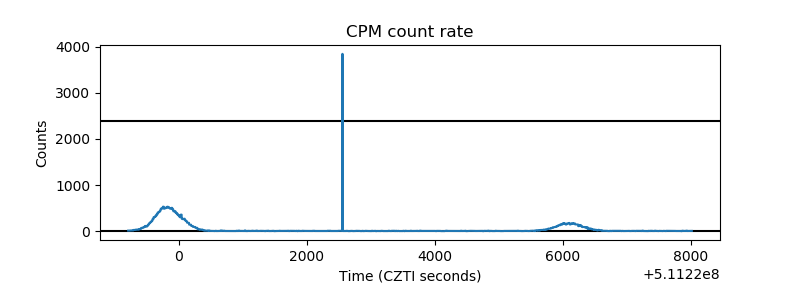 |
| CZT Counter | 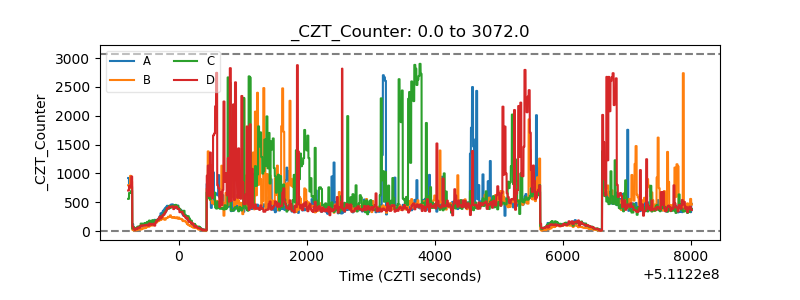 |
| +2.5 Volts monitor |  |
| +5 Volts monitor |  |
| _ROLL_ROT | 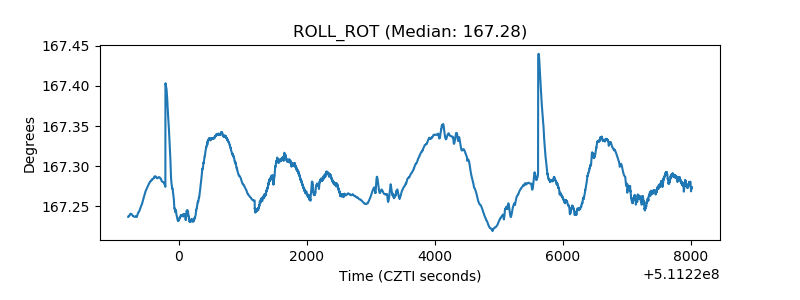 |
| _Roll_DEC | 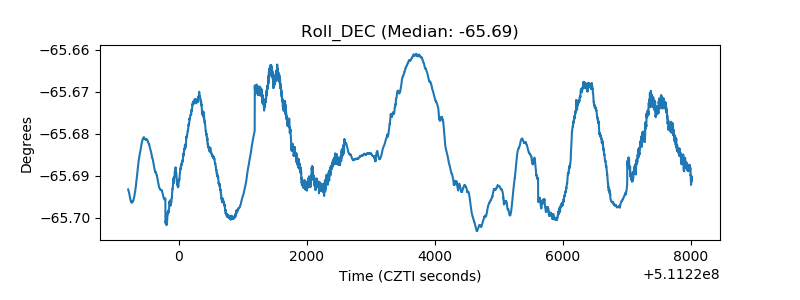 |
| _Roll_RA | 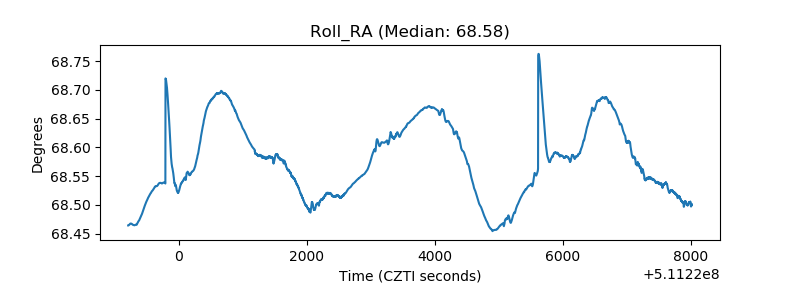 |
| Veto Counter | 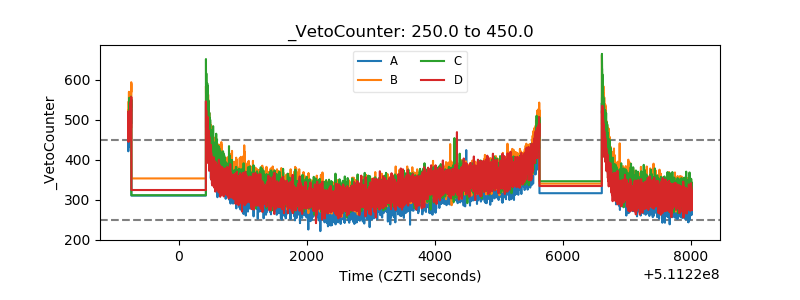 |