| Param | Original file | Final file |
|---|---|---|
| Filename | modeM0/AS1A14_083T06_9000006558_56597cztM0_level2.fits | modeM0/AS1A14_083T06_9000006558_56597cztM0_level2_quad_clean.evt |
| Size (bytes) | 482,356,800 | 88,747,200 |
| Size | 460.0 MB | 84.6 MB |
| Events in quadrant A | 3,902,866 | 587,959 |
| Events in quadrant B | 4,958,581 | 577,756 |
| Events in quadrant C | 3,884,031 | 544,686 |
| Events in quadrant D | 4,553,363 | 478,030 |
| Mode SS | |||
|---|---|---|---|
| Quadrant | BADHDUFLAG | Total packets | Discarded packets |
| A | 0 | 148 | 0 |
| B | 0 | 148 | 0 |
| C | 0 | 148 | 0 |
| D | 0 | 148 | 0 |
| Mode M9 | |||
|---|---|---|---|
| Quadrant | BADHDUFLAG | Total packets | Discarded packets |
| A | 0 | 15 | 0 |
| B | 0 | 15 | 0 |
| C | 0 | 15 | 0 |
| D | 0 | 15 | 0 |
| Mode M0 | |||
|---|---|---|---|
| Quadrant | BADHDUFLAG | Total packets | Discarded packets |
| A | 0 | 16836 | 2 |
| B | 0 | 19934 | 2 |
| C | 0 | 17080 | 2 |
| D | 0 | 18916 | 2 |
| Quadrant | Total seconds | Saturated seconds | Saturation percentage |
|---|---|---|---|
| A | 7153 | 204 | 2.851950% |
| B | 7153 | 815 | 11.393821% |
| C | 7154 | 230 | 3.214985% |
| D | 7154 | 446 | 6.234275% |
Noise dominated data is calculated using 1-second bins in cleaned event files. If a bin has >2000 counts, and if more than 50% of those come from <1% of pixels, then it is considered to be noise-dominated and hence unusable.
| Quadrant | # 1 sec bins | Bins with >0 counts | Bins with >2000 counts | High rate bins dominated by noise | Noise dominated (total time) | Noise dominated (detector-on time) | Marked lightcurve |
|---|---|---|---|---|---|---|---|
| A | 8975 | 7437 | 118 | 118 | 1.31% | 1.59% | 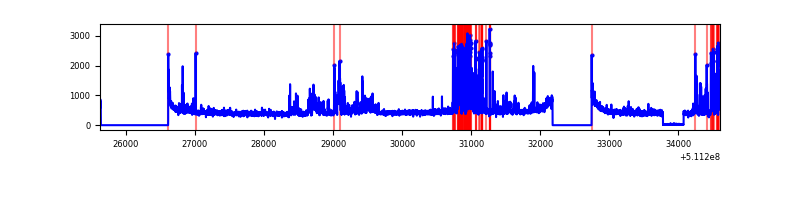 |
| B | 8975 | 7435 | 583 | 583 | 6.50% | 7.84% | 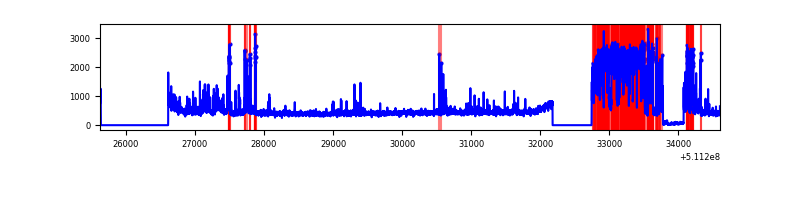 |
| C | 8976 | 7438 | 116 | 116 | 1.29% | 1.56% | 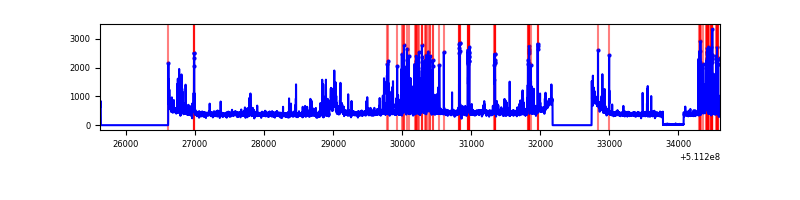 |
| D | 8976 | 7437 | 382 | 382 | 4.26% | 5.14% | 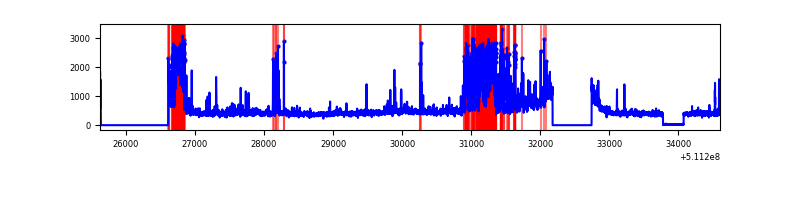 |
Top three noisy pixels from each quadrant. If the there are fewer than three noisy pixels in the level2.evt file, extra rows are filled as -1
| Pixel properties | Quadrant properties | ||||||
|---|---|---|---|---|---|---|---|
| Quadrant | DetID | PixID | Counts | Sigma | Mean | Median | Sigma |
| A | 4 | 95 | 368054 | 1954.93 | 759 | 739 | 187.9 |
| A | 0 | 8 | 332556 | 1766.01 | 759 | 739 | 187.9 |
| A | 3 | 14 | 121085 | 640.51 | 759 | 739 | 187.9 |
| B | 5 | 185 | 1841379 | 11868.03 | 727 | 701 | 155.1 |
| B | 5 | 236 | 109830 | 703.62 | 727 | 701 | 155.1 |
| B | 4 | 21 | 40499 | 256.6 | 727 | 701 | 155.1 |
| C | 6 | 223 | 338597 | 1688.3 | 737 | 731 | 200.1 |
| C | 15 | 208 | 232341 | 1157.34 | 737 | 731 | 200.1 |
| C | 14 | 254 | 149773 | 744.76 | 737 | 731 | 200.1 |
| D | 6 | 239 | 585758 | 2920.25 | 716 | 683 | 200.4 |
| D | 2 | 249 | 540585 | 2694.78 | 716 | 683 | 200.4 |
| D | 7 | 96 | 185478 | 922.36 | 716 | 683 | 200.4 |
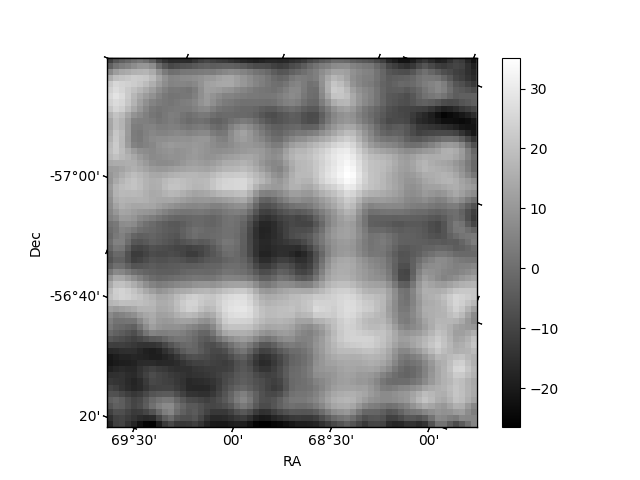
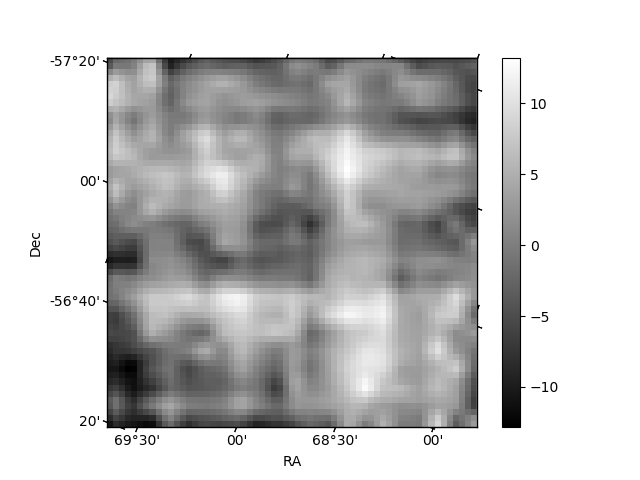
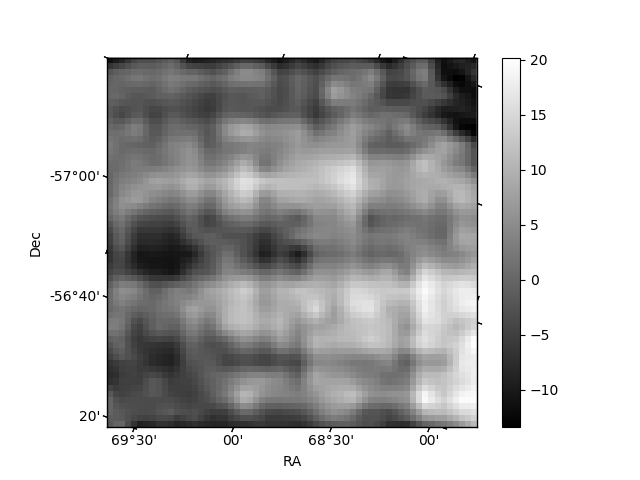
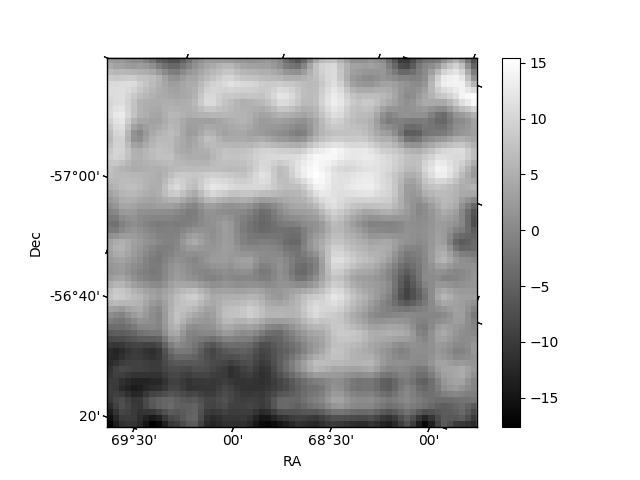
Histogram calculated using DETX and DETY for each event in the final _common_clean file
| Quadrant A | 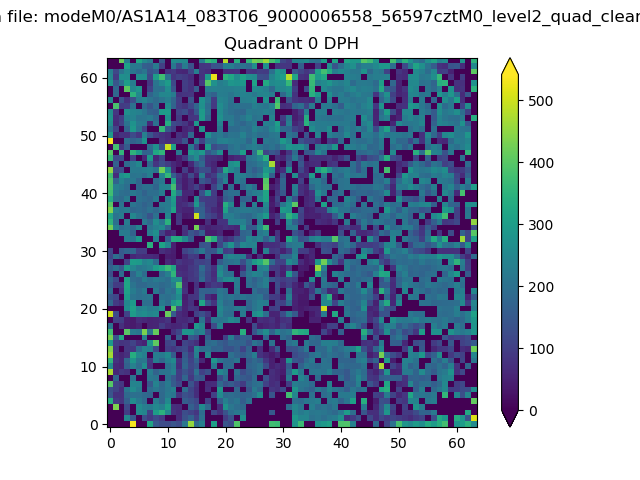 |
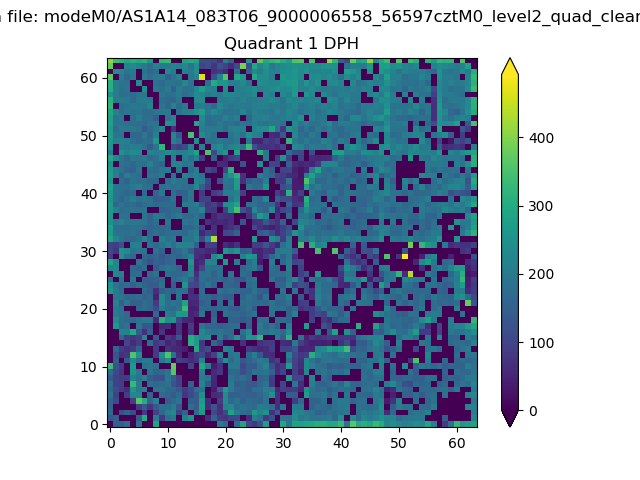 |
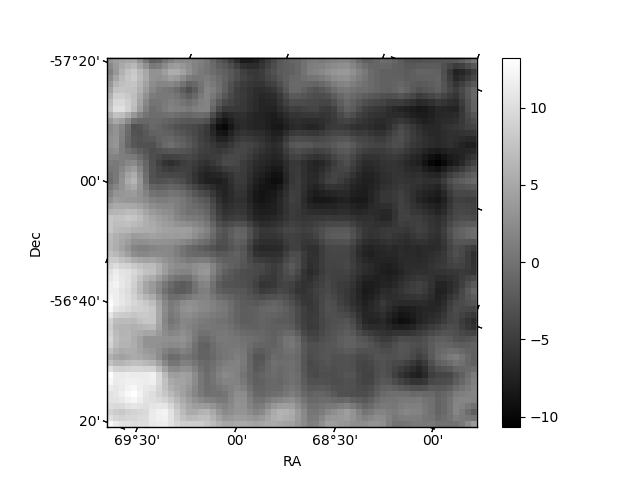
Quadrant B |
|---|---|---|---|
| Quadrant D | 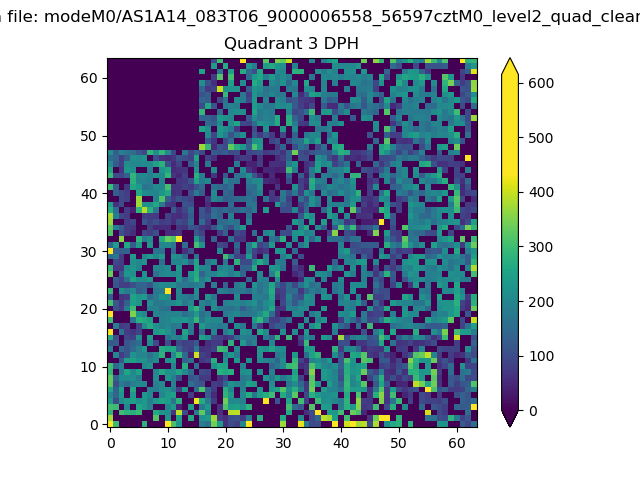 |
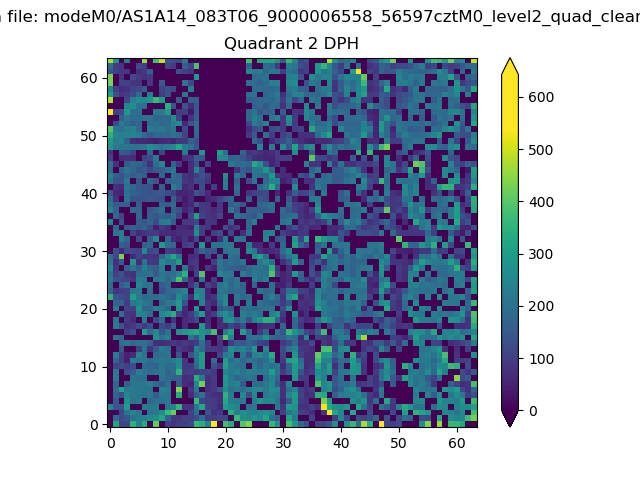 |
Quadrant C |
| Plot type | Count rate plots | Images |
|---|---|---|
| Comparison with Poisson distribution Blue bars denote a histogram of data divided into 1 sec bins. Red curve is a Poisson curve with rate = median count rate of data. |
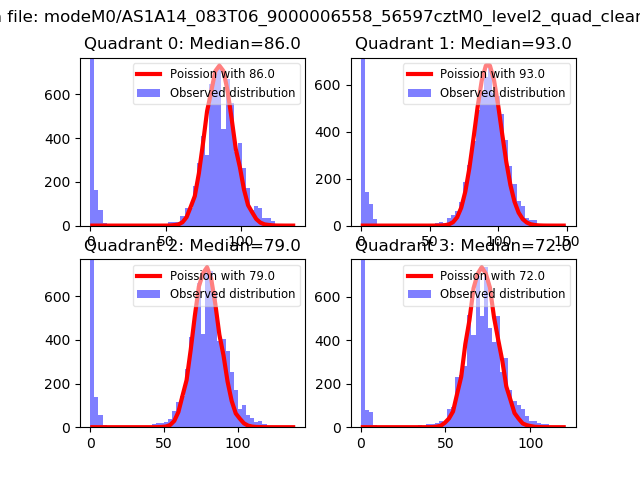 |
 |
| Quadrant-wise count rates Data is divided into 100 sec bins |
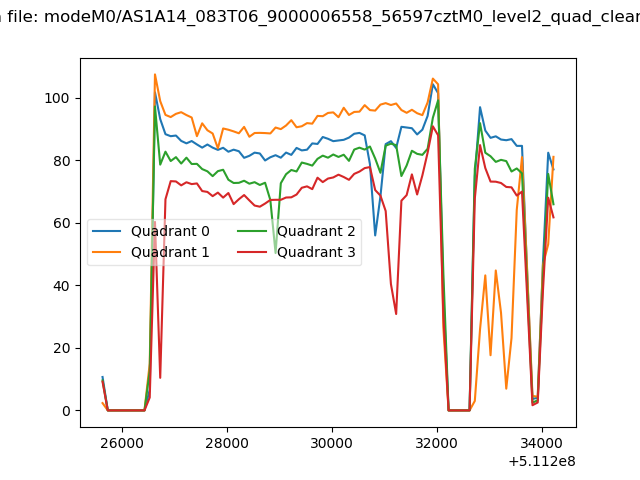 |
|
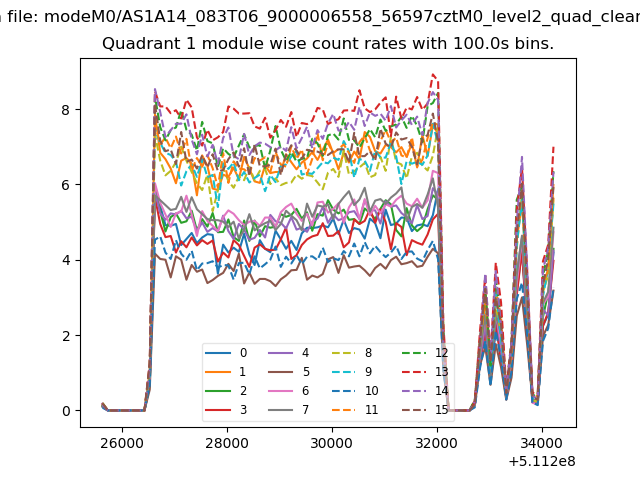
| Module-wise count rates for Quadrant A Data is divided into 100 sec bins |
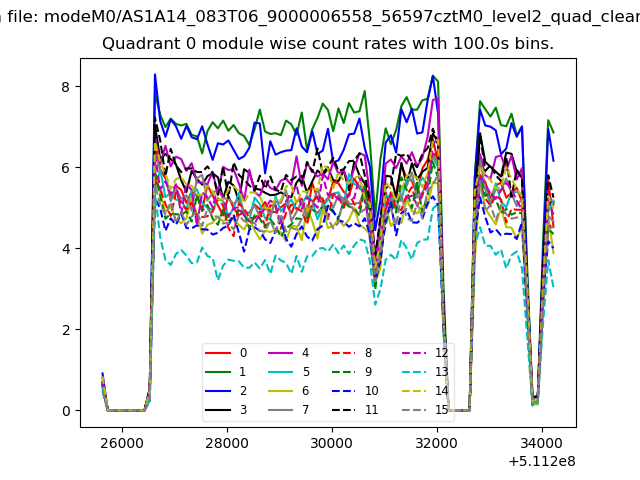 |
 |
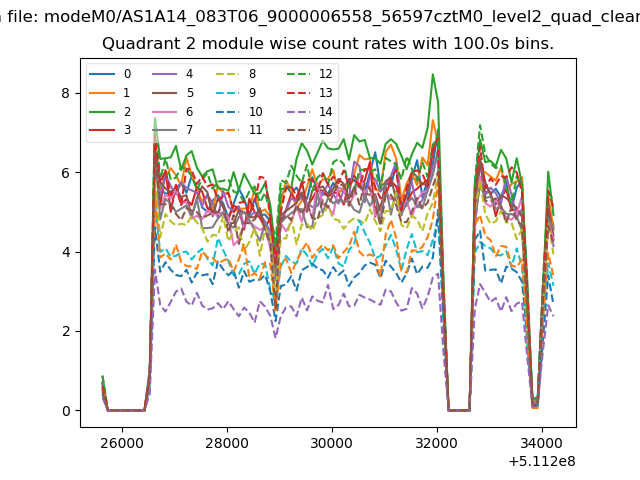
| Module-wise count rates for Quadrant B Data is divided into 100 sec bins |
 |
 |
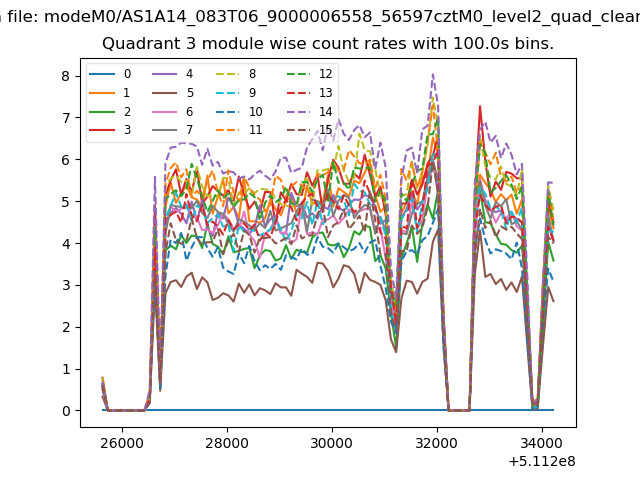
| Module-wise count rates for Quadrant C Data is divided into 100 sec bins |
 |
 |
| Module-wise count rates for Quadrant D Data is divided into 100 sec bins |
 |
 |
| Parameter | Plot |
|---|---|
| CZT HV Monitor |  |
| D_VDD | 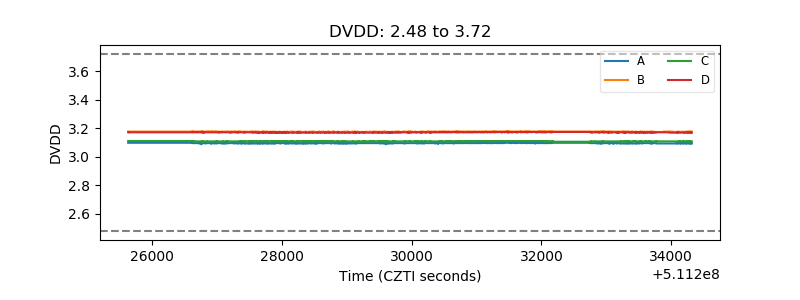 |
| Temperature 1 | 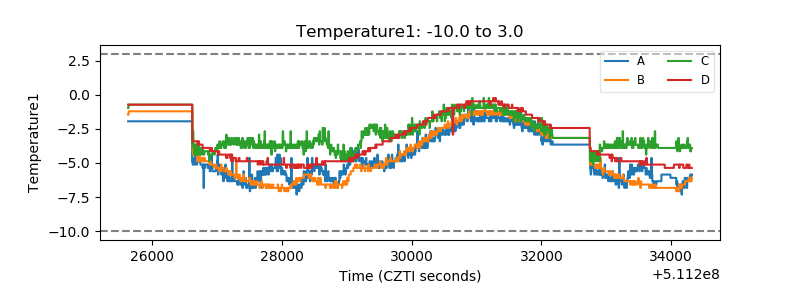 |
| Veto HV Monitor | 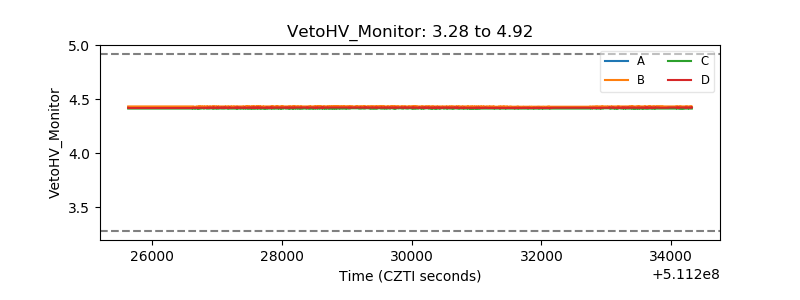 |
| Veto LLD | 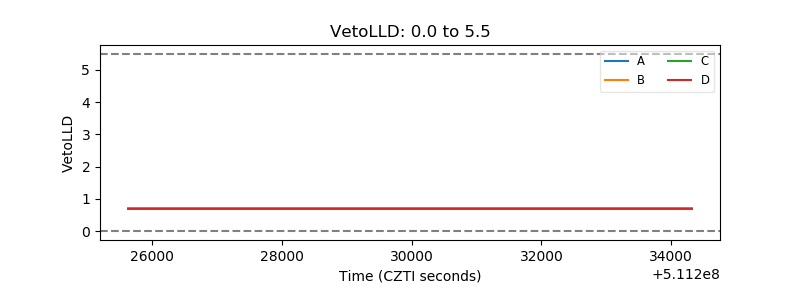 |
| Alpha Counter | 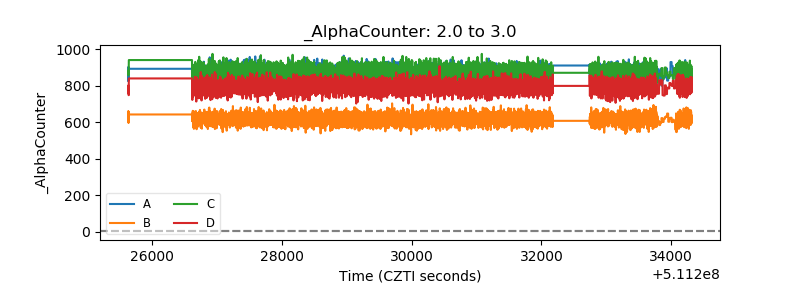 |
| _CPM_Rate | 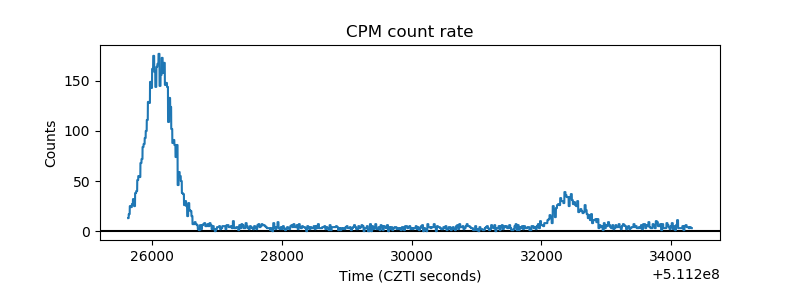 |
| CZT Counter | 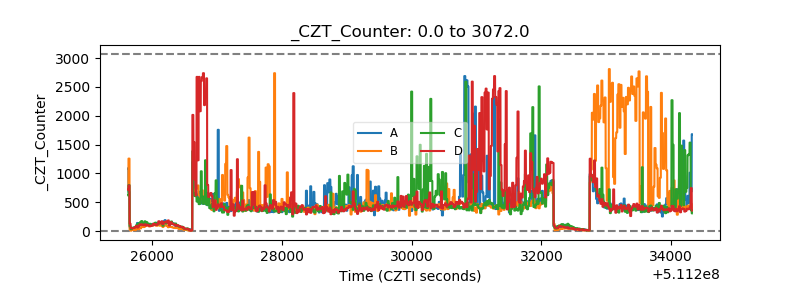 |
| +2.5 Volts monitor |  |
| +5 Volts monitor |  |
| _ROLL_ROT | 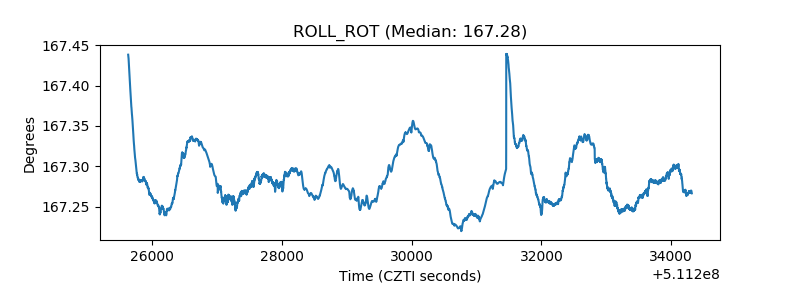 |
| _Roll_DEC | 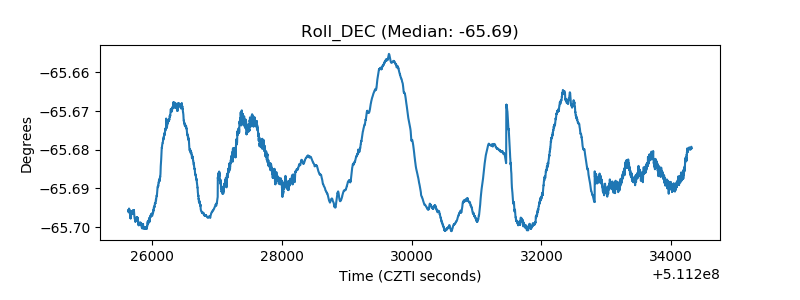 |
| _Roll_RA | 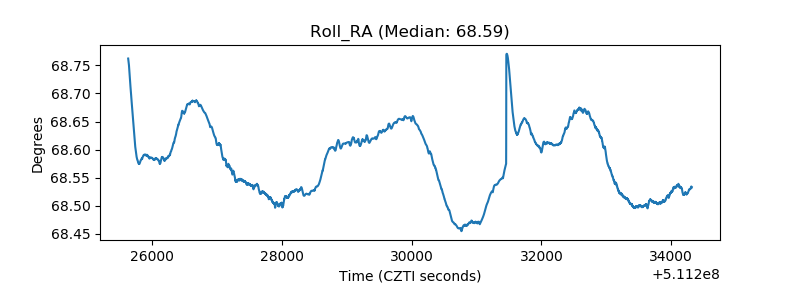 |
| Veto Counter | 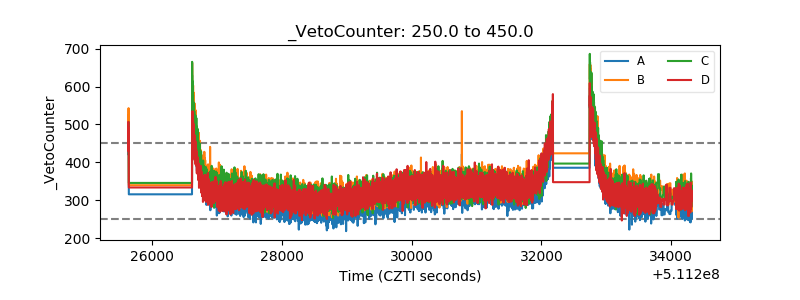 |