| Param | Original file | Final file |
|---|---|---|
| Filename | modeM0/AS1A14_083T06_9000006558_56598cztM0_level2.fits | modeM0/AS1A14_083T06_9000006558_56598cztM0_level2_quad_clean.evt |
| Size (bytes) | 543,729,600 | 99,889,920 |
| Size | 518.5 MB | 95.3 MB |
| Events in quadrant A | 4,521,898 | 652,265 |
| Events in quadrant B | 5,552,797 | 650,039 |
| Events in quadrant C | 4,608,498 | 610,589 |
| Events in quadrant D | 4,815,313 | 549,003 |
| Mode SS | |||
|---|---|---|---|
| Quadrant | BADHDUFLAG | Total packets | Discarded packets |
| A | 0 | 162 | 0 |
| B | 0 | 162 | 0 |
| C | 0 | 162 | 0 |
| D | 0 | 162 | 0 |
| Mode M9 | |||
|---|---|---|---|
| Quadrant | BADHDUFLAG | Total packets | Discarded packets |
| A | 0 | 3 | 0 |
| B | 0 | 3 | 0 |
| C | 0 | 4 | 0 |
| D | 0 | 4 | 0 |
| Mode M0 | |||
|---|---|---|---|
| Quadrant | BADHDUFLAG | Total packets | Discarded packets |
| A | 0 | 19383 | 1 |
| B | 0 | 22422 | 2 |
| C | 0 | 19727 | 1 |
| D | 0 | 20385 | 1 |
| Quadrant | Total seconds | Saturated seconds | Saturation percentage |
|---|---|---|---|
| A | 8090 | 234 | 2.892460% |
| B | 8089 | 865 | 10.693534% |
| C | 8089 | 256 | 3.164792% |
| D | 8089 | 168 | 2.076895% |
Noise dominated data is calculated using 1-second bins in cleaned event files. If a bin has >2000 counts, and if more than 50% of those come from <1% of pixels, then it is considered to be noise-dominated and hence unusable.
| Quadrant | # 1 sec bins | Bins with >0 counts | Bins with >2000 counts | High rate bins dominated by noise | Noise dominated (total time) | Noise dominated (detector-on time) | Marked lightcurve |
|---|---|---|---|---|---|---|---|
| A | 8372 | 8372 | 202 | 202 | 2.41% | 2.41% | 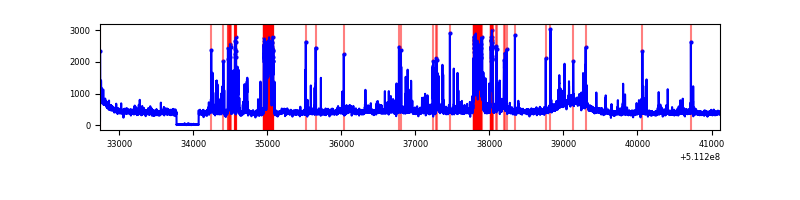 |
| B | 8371 | 8371 | 612 | 612 | 7.31% | 7.31% | 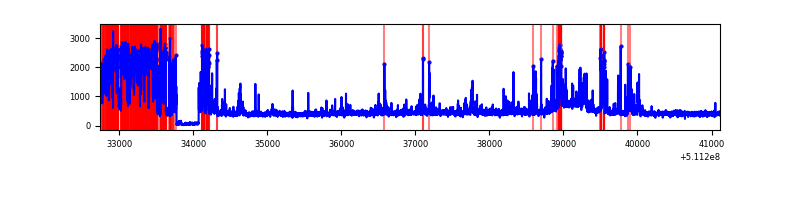 |
| C | 8371 | 8371 | 168 | 168 | 2.01% | 2.01% | 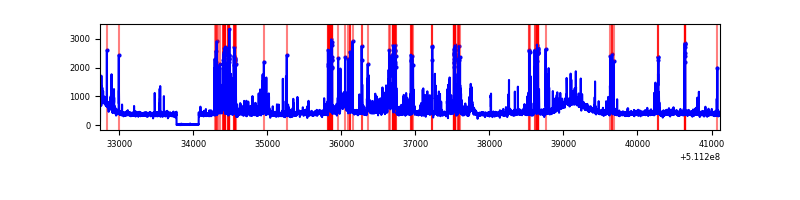 |
| D | 8371 | 8371 | 152 | 152 | 1.82% | 1.82% | 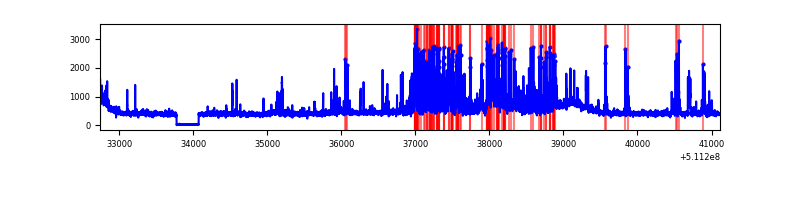 |
Top three noisy pixels from each quadrant. If the there are fewer than three noisy pixels in the level2.evt file, extra rows are filled as -1
| Pixel properties | Quadrant properties | ||||||
|---|---|---|---|---|---|---|---|
| Quadrant | DetID | PixID | Counts | Sigma | Mean | Median | Sigma |
| A | 4 | 95 | 415431 | 1910.6 | 867 | 843 | 217.0 |
| A | 10 | 251 | 326690 | 1501.64 | 867 | 843 | 217.0 |
| A | 8 | 249 | 115277 | 527.36 | 867 | 843 | 217.0 |
| B | 5 | 185 | 2038199 | 11543.78 | 830 | 800 | 176.5 |
| B | 4 | 21 | 81206 | 455.58 | 830 | 800 | 176.5 |
| B | 10 | 247 | 34912 | 193.28 | 830 | 800 | 176.5 |
| C | 12 | 252 | 542396 | 2380.8 | 841 | 834 | 227.5 |
| C | 15 | 208 | 292139 | 1280.62 | 841 | 834 | 227.5 |
| C | 15 | 230 | 194649 | 852.04 | 841 | 834 | 227.5 |
| D | 6 | 239 | 603527 | 2580.67 | 836 | 797 | 233.6 |
| D | 2 | 31 | 224594 | 958.22 | 836 | 797 | 233.6 |
| D | 2 | 249 | 170337 | 725.91 | 836 | 797 | 233.6 |
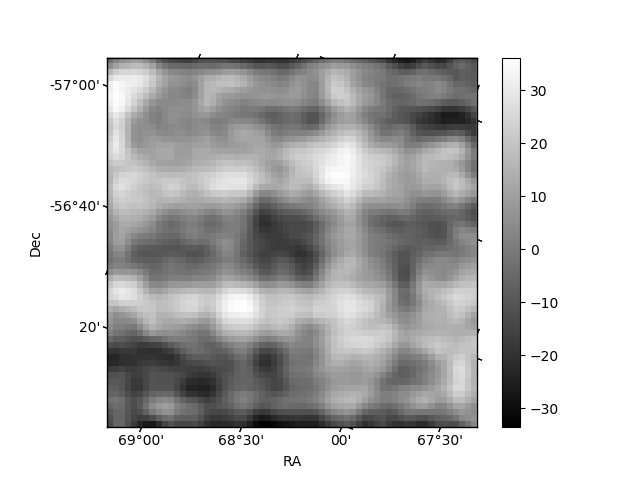
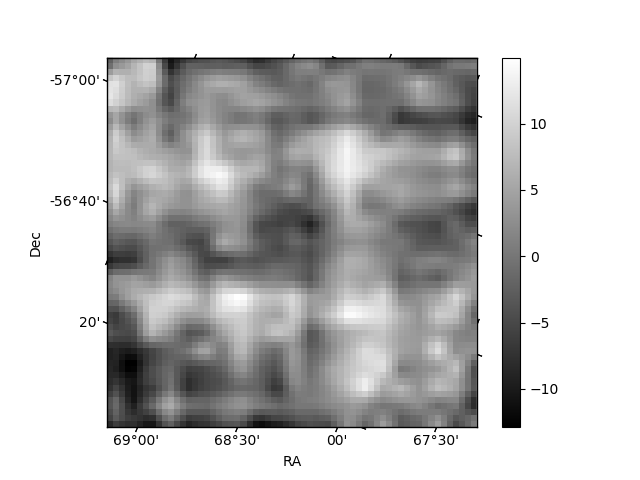
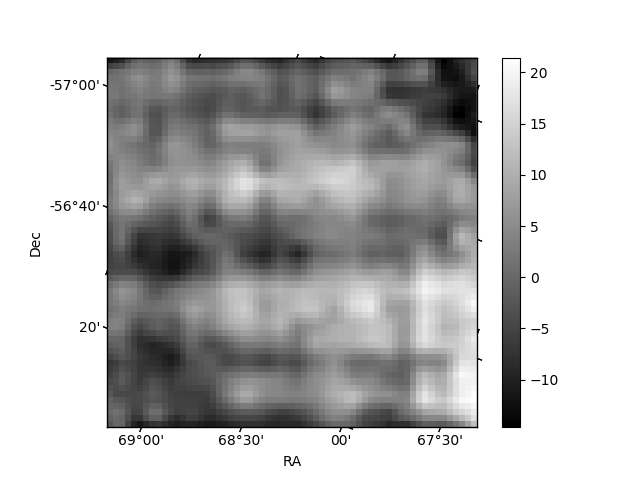
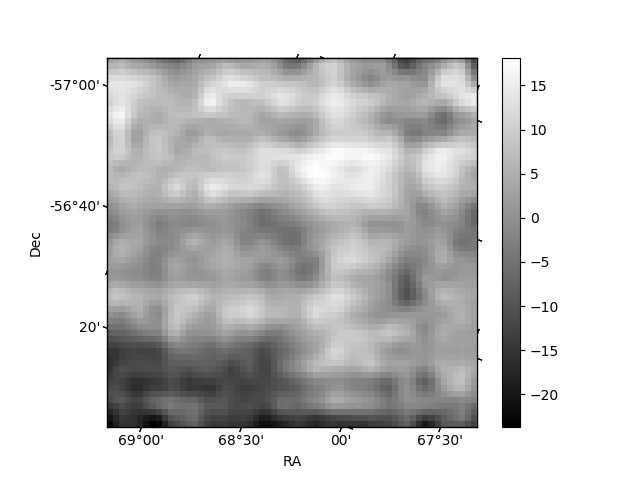
Histogram calculated using DETX and DETY for each event in the final _common_clean file
| Quadrant A | 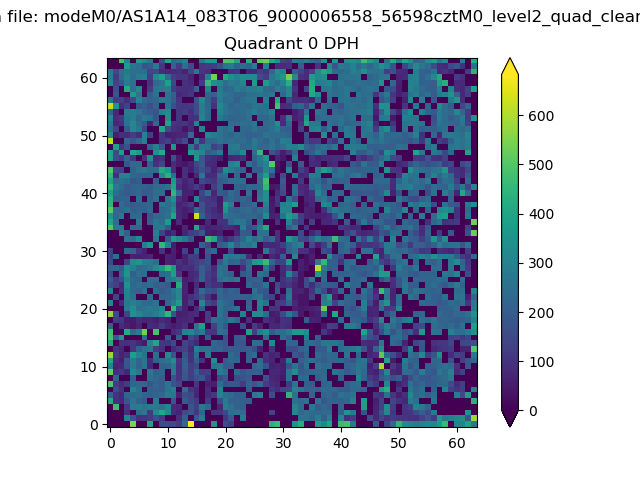 |
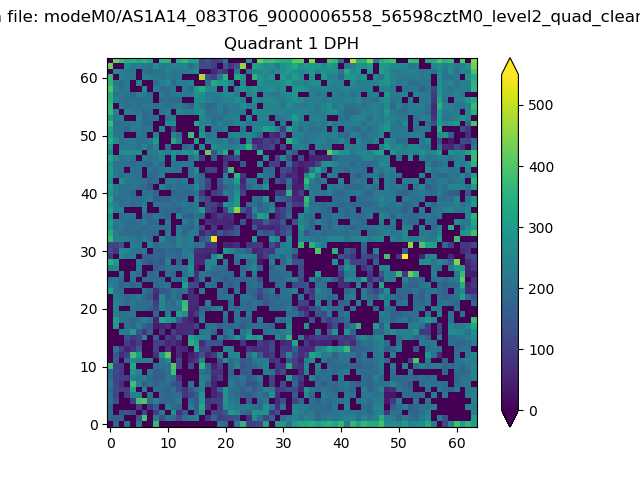 |
Quadrant B |
|---|---|---|---|
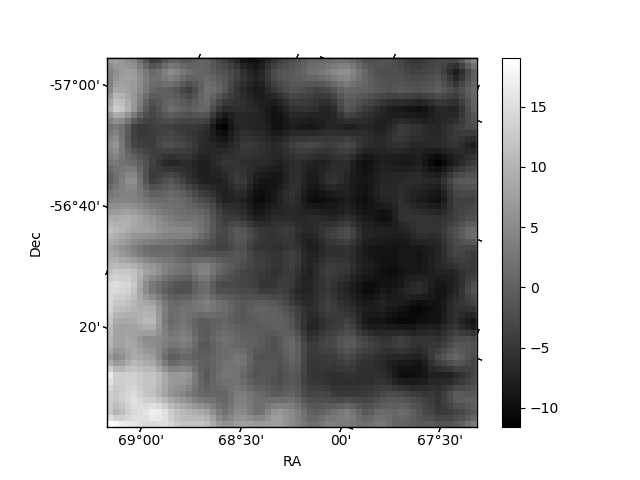
| Quadrant D | 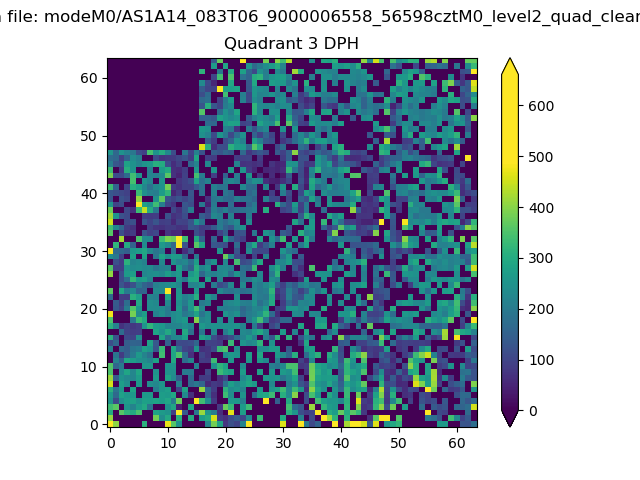 |
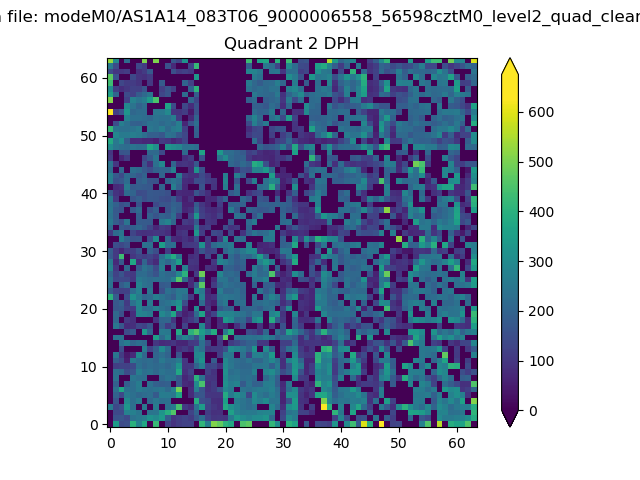 |
Quadrant C |
| Plot type | Count rate plots | Images |
|---|---|---|
| Comparison with Poisson distribution Blue bars denote a histogram of data divided into 1 sec bins. Red curve is a Poisson curve with rate = median count rate of data. |
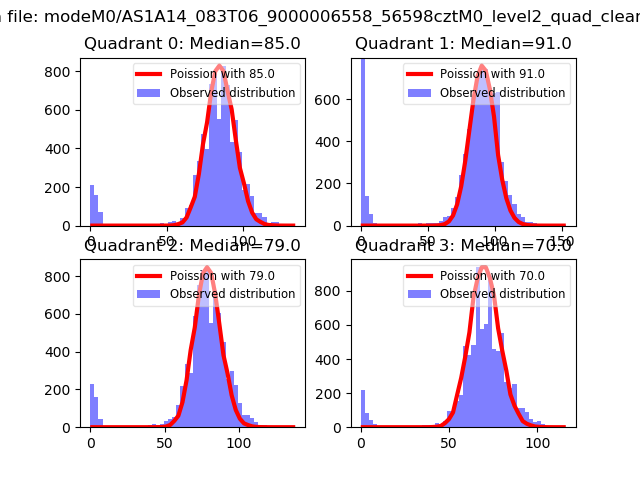 |
 |
| Quadrant-wise count rates Data is divided into 100 sec bins |
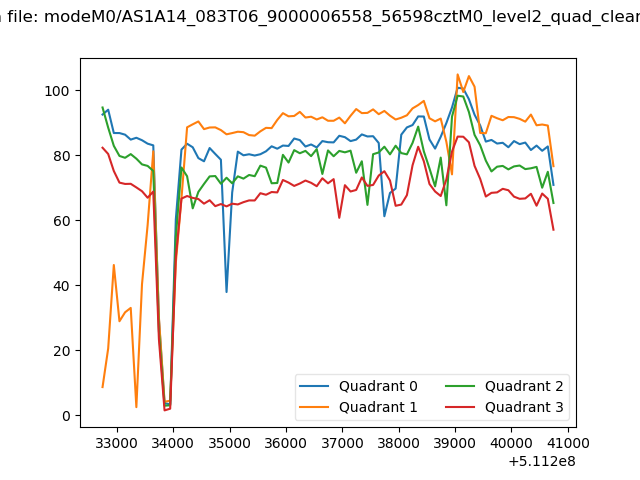 |
|
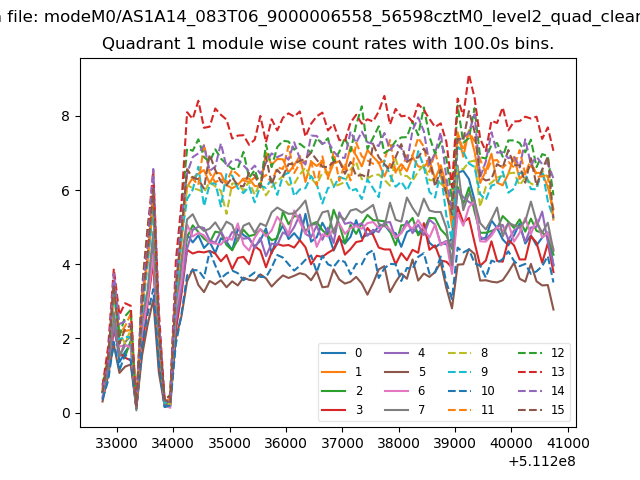
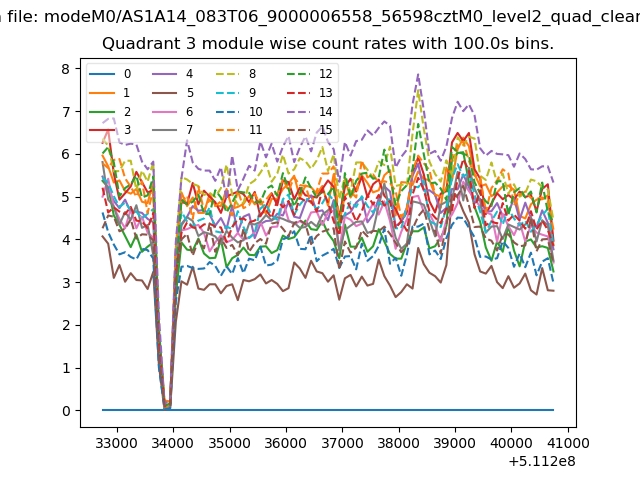
| Module-wise count rates for Quadrant A Data is divided into 100 sec bins |
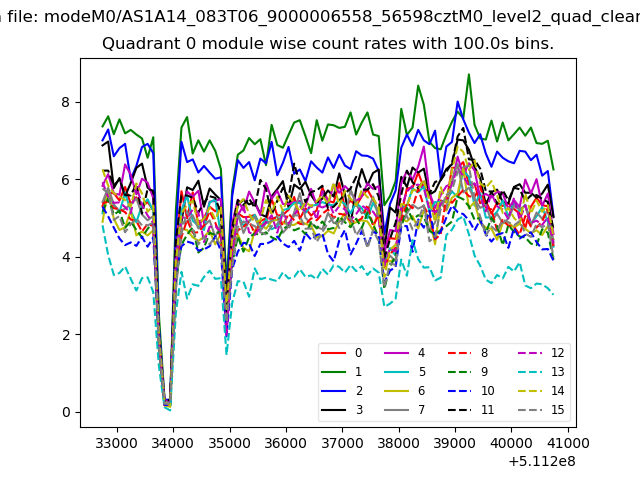 |
 |
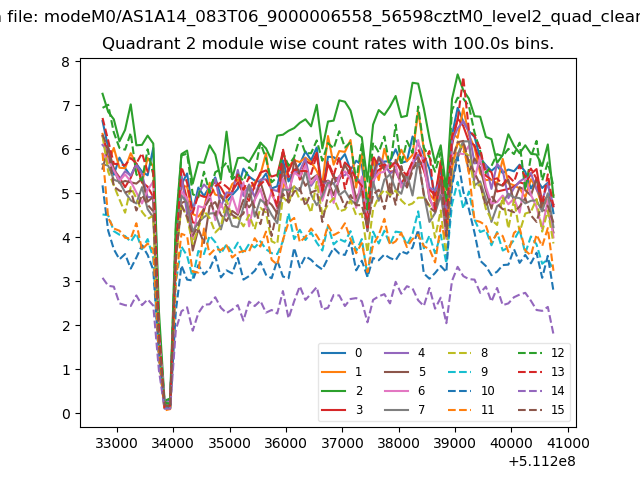
| Module-wise count rates for Quadrant B Data is divided into 100 sec bins |
 |
 |
| Module-wise count rates for Quadrant C Data is divided into 100 sec bins |
 |
 |
| Module-wise count rates for Quadrant D Data is divided into 100 sec bins |
 |
 |
| Parameter | Plot |
|---|---|
| CZT HV Monitor | 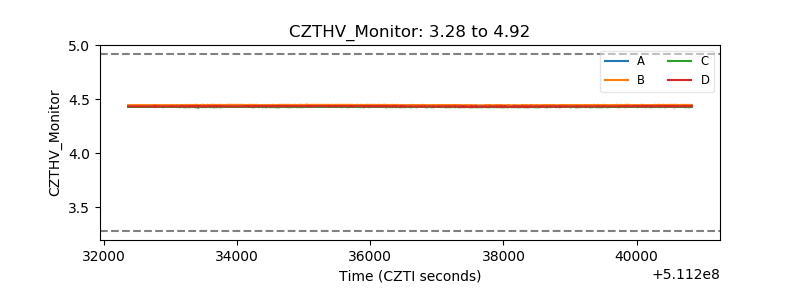 |
| D_VDD | 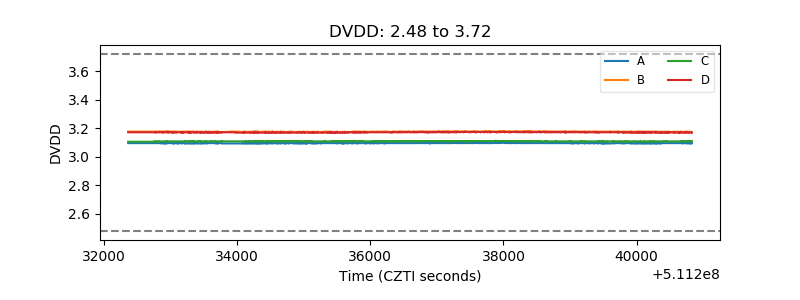 |
| Temperature 1 | 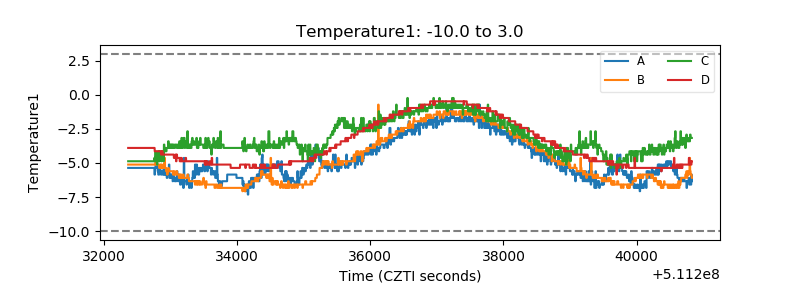 |
| Veto HV Monitor | 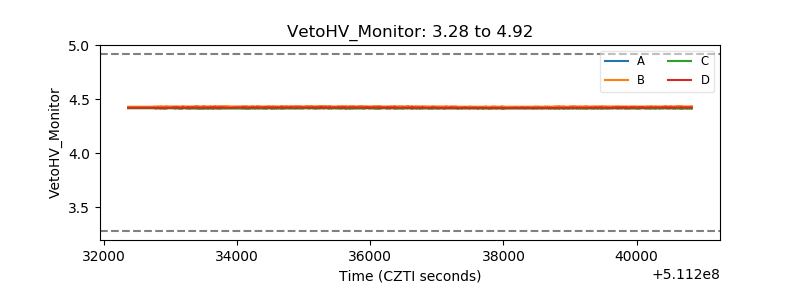 |
| Veto LLD | 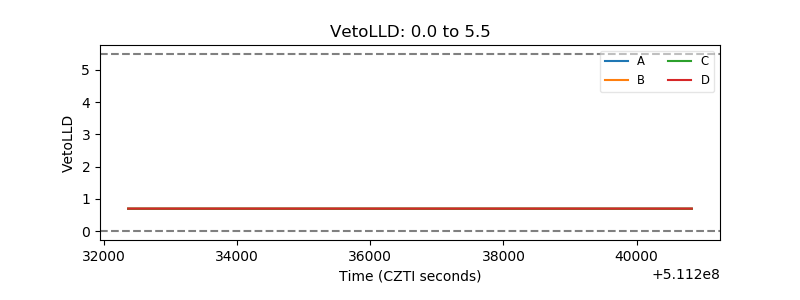 |
| Alpha Counter | 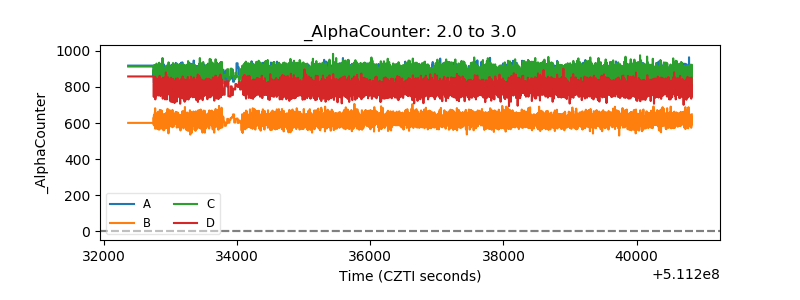 |
| _CPM_Rate | 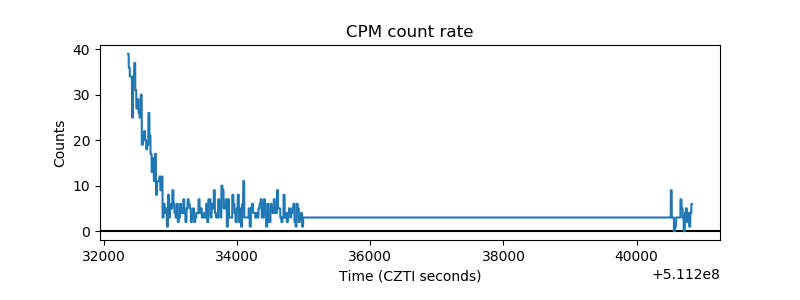 |
| CZT Counter | 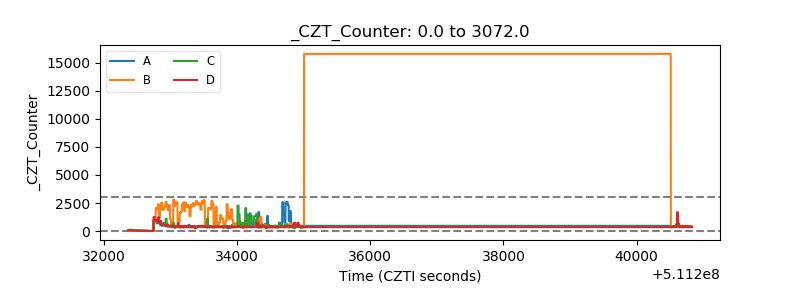 |
| +2.5 Volts monitor |  |
| +5 Volts monitor |  |
| _ROLL_ROT | 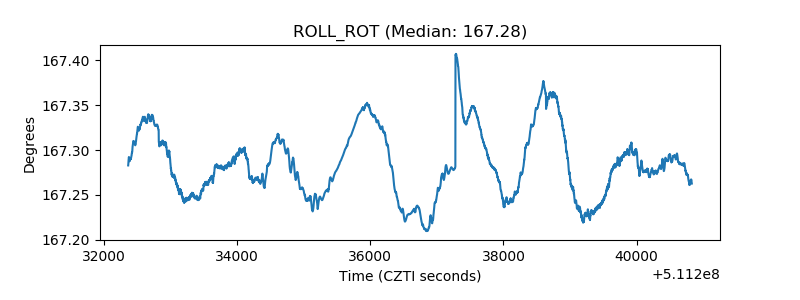 |
| _Roll_DEC | 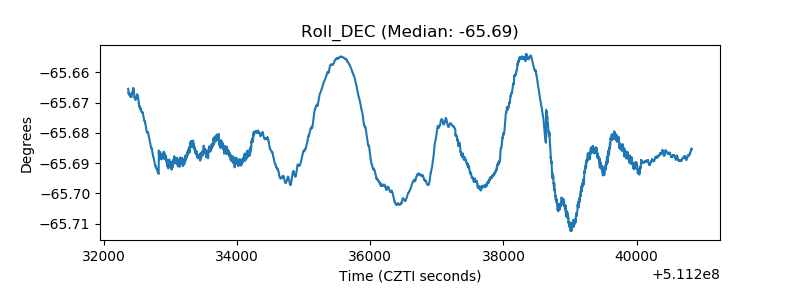 |
| _Roll_RA | 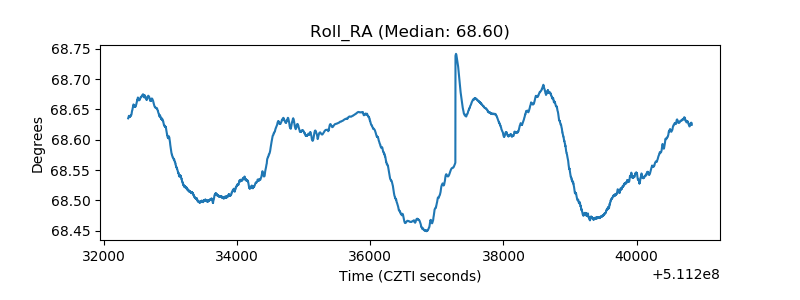 |
| Veto Counter | 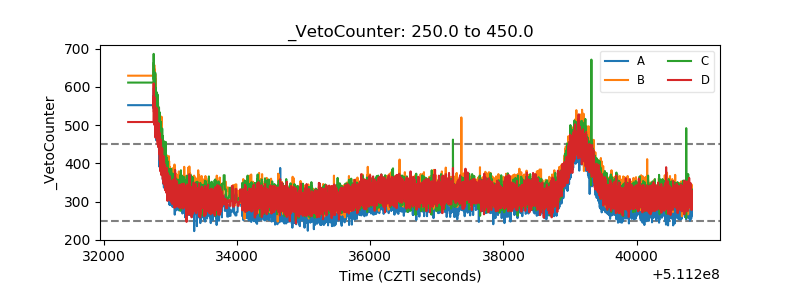 |