| Param | Original file | Final file |
|---|---|---|
| Filename | modeM0/AS1A14_083T06_9000006558_56599cztM0_level2.fits | modeM0/AS1A14_083T06_9000006558_56599cztM0_level2_quad_clean.evt |
| Size (bytes) | 514,344,960 | 113,941,440 |
| Size | 490.5 MB | 108.7 MB |
| Events in quadrant A | 4,369,917 | 743,150 |
| Events in quadrant B | 4,617,232 | 802,365 |
| Events in quadrant C | 3,954,823 | 708,048 |
| Events in quadrant D | 5,464,734 | 630,734 |
| Mode SS | |||
|---|---|---|---|
| Quadrant | BADHDUFLAG | Total packets | Discarded packets |
| A | 0 | 162 | 0 |
| B | 0 | 162 | 0 |
| C | 0 | 162 | 0 |
| D | 0 | 162 | 0 |
| Mode M0 | |||
|---|---|---|---|
| Quadrant | BADHDUFLAG | Total packets | Discarded packets |
| A | 0 | 19166 | 0 |
| B | 0 | 19544 | 0 |
| C | 0 | 17943 | 0 |
| D | 0 | 22055 | 0 |
| Quadrant | Total seconds | Saturated seconds | Saturation percentage |
|---|---|---|---|
| A | 8139 | 217 | 2.666175% |
| B | 8140 | 271 | 3.329238% |
| C | 8140 | 129 | 1.584767% |
| D | 8140 | 474 | 5.823096% |
Noise dominated data is calculated using 1-second bins in cleaned event files. If a bin has >2000 counts, and if more than 50% of those come from <1% of pixels, then it is considered to be noise-dominated and hence unusable.
| Quadrant | # 1 sec bins | Bins with >0 counts | Bins with >2000 counts | High rate bins dominated by noise | Noise dominated (total time) | Noise dominated (detector-on time) | Marked lightcurve |
|---|---|---|---|---|---|---|---|
| A | 8139 | 8139 | 200 | 200 | 2.46% | 2.46% | 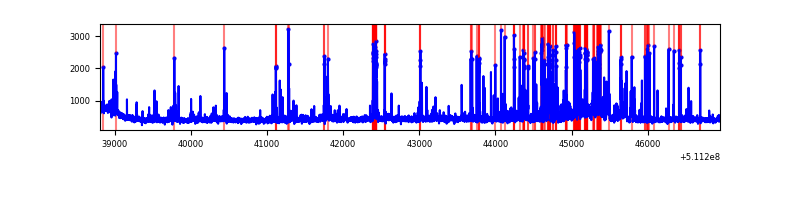 |
| B | 8140 | 8140 | 157 | 157 | 1.93% | 1.93% | 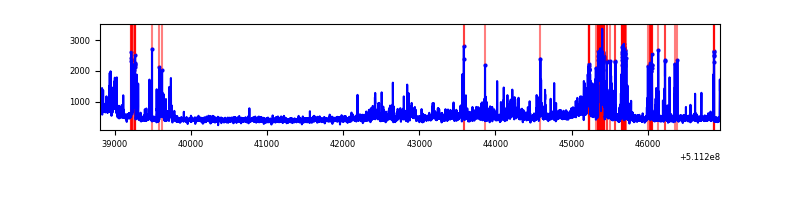 |
| C | 8140 | 8140 | 113 | 113 | 1.39% | 1.39% | 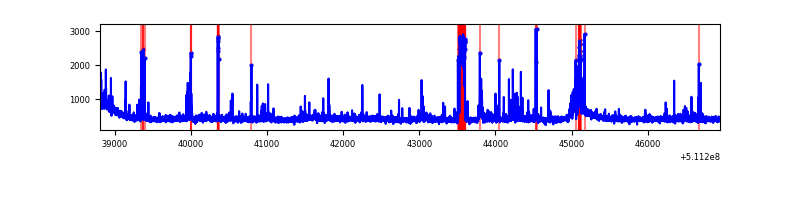 |
| D | 8140 | 8140 | 495 | 495 | 6.08% | 6.08% | 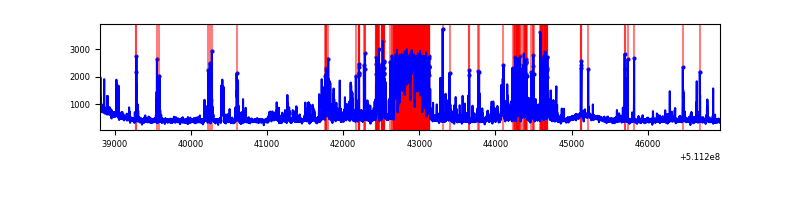 |
Top three noisy pixels from each quadrant. If the there are fewer than three noisy pixels in the level2.evt file, extra rows are filled as -1
| Pixel properties | Quadrant properties | ||||||
|---|---|---|---|---|---|---|---|
| Quadrant | DetID | PixID | Counts | Sigma | Mean | Median | Sigma |
| A | 0 | 8 | 527758 | 2485.69 | 857 | 838 | 212.0 |
| A | 4 | 249 | 155554 | 729.86 | 857 | 838 | 212.0 |
| A | 4 | 13 | 91041 | 425.52 | 857 | 838 | 212.0 |
| B | 5 | 185 | 720475 | 3974.6 | 855 | 823 | 181.1 |
| B | 0 | 171 | 329320 | 1814.27 | 855 | 823 | 181.1 |
| B | 4 | 21 | 64851 | 353.62 | 855 | 823 | 181.1 |
| C | 15 | 230 | 200178 | 875.08 | 841 | 834 | 227.8 |
| C | 13 | 3 | 161639 | 705.9 | 841 | 834 | 227.8 |
| C | 12 | 252 | 118574 | 516.85 | 841 | 834 | 227.8 |
| D | 2 | 249 | 1012402 | 4415.69 | 818 | 778 | 229.1 |
| D | 6 | 239 | 557881 | 2431.73 | 818 | 778 | 229.1 |
| D | 2 | 31 | 158507 | 688.48 | 818 | 778 | 229.1 |
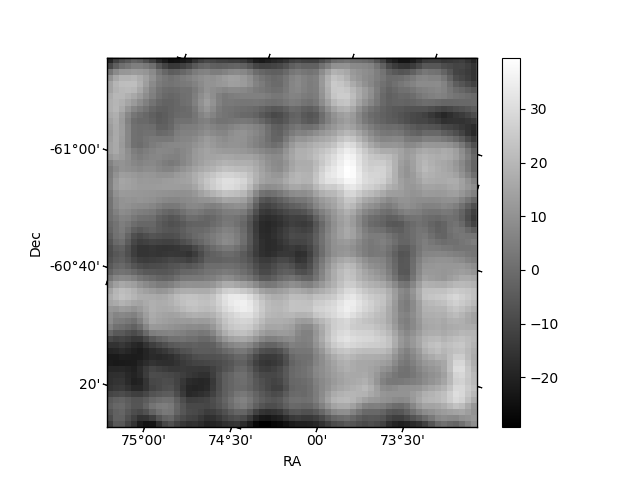
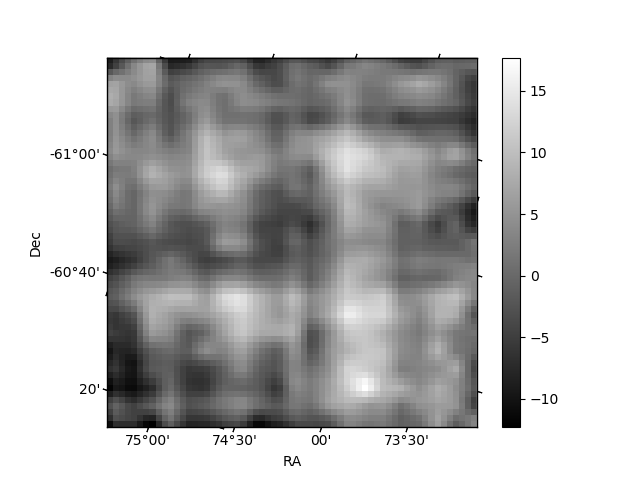
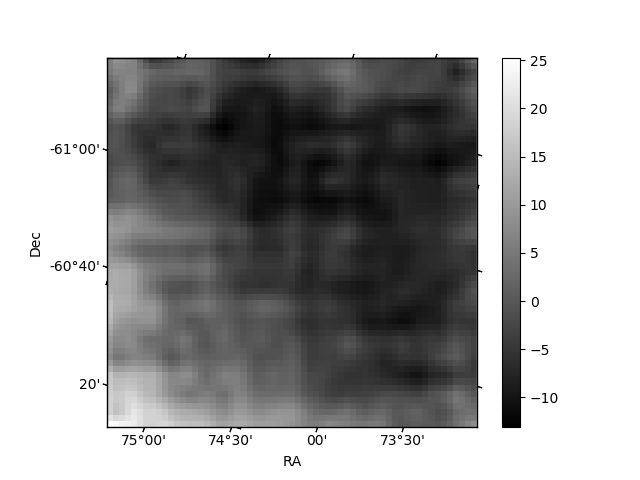
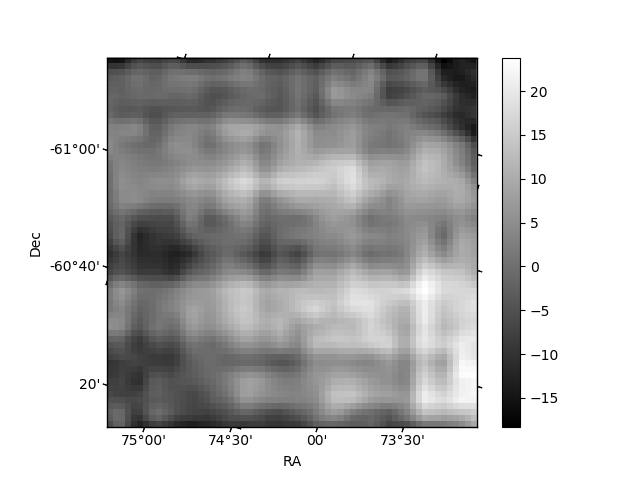
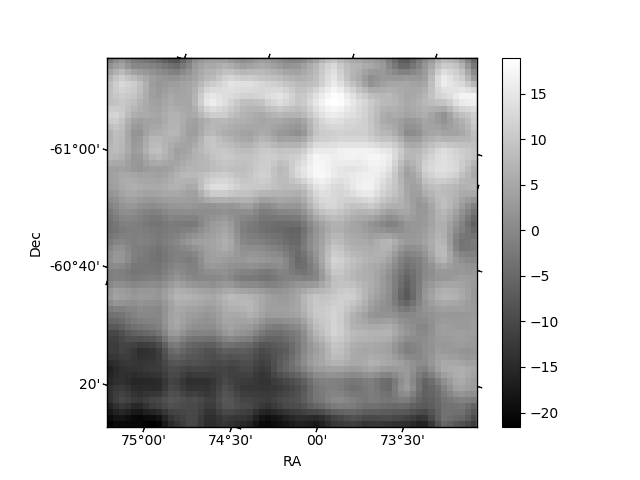
Histogram calculated using DETX and DETY for each event in the final _common_clean file
| Quadrant A | 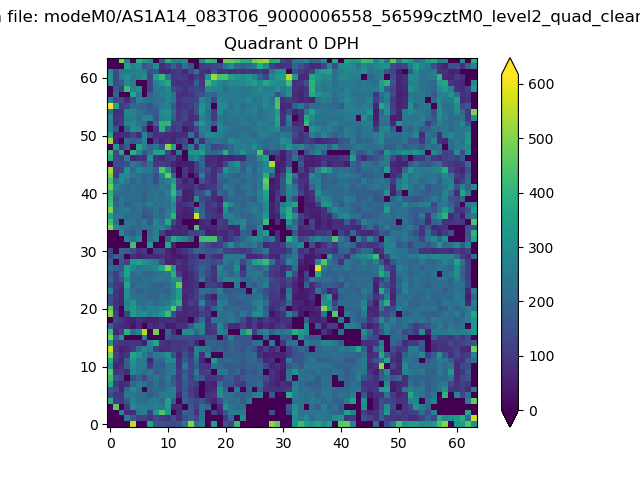 |
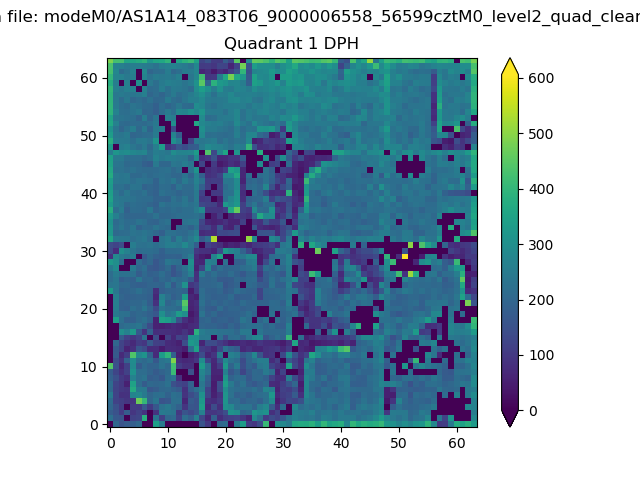 |
Quadrant B |
|---|---|---|---|
| Quadrant D | 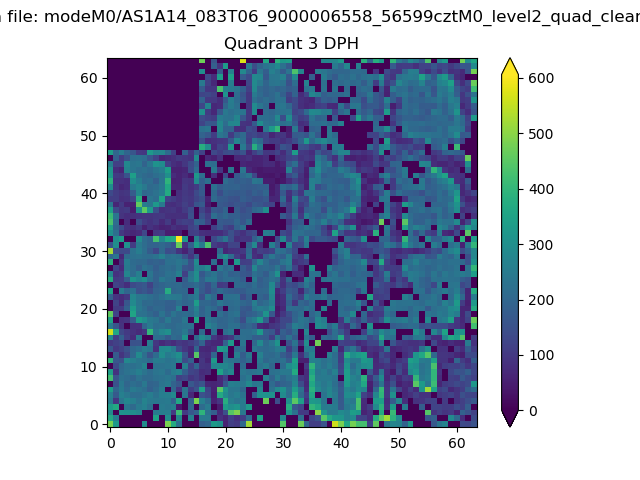 |
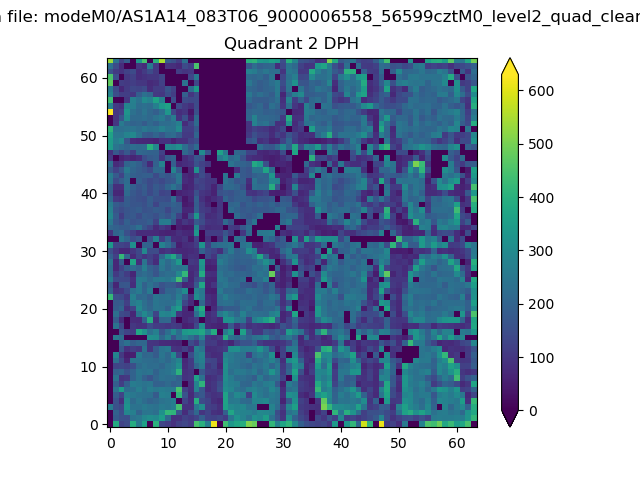 |
Quadrant C |
| Plot type | Count rate plots | Images |
|---|---|---|
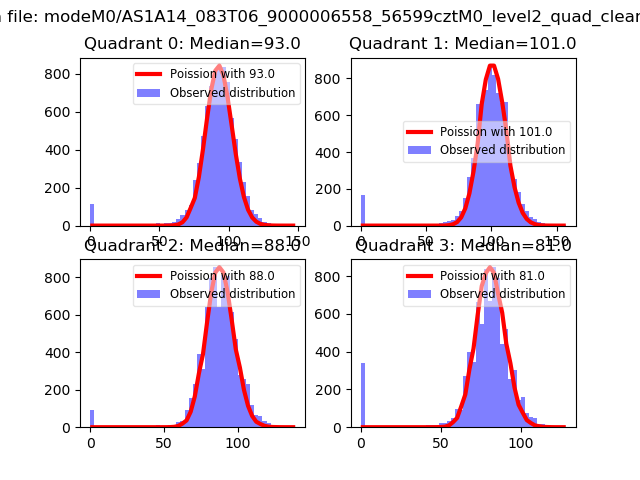
| Comparison with Poisson distribution Blue bars denote a histogram of data divided into 1 sec bins. Red curve is a Poisson curve with rate = median count rate of data. |
 |
 |
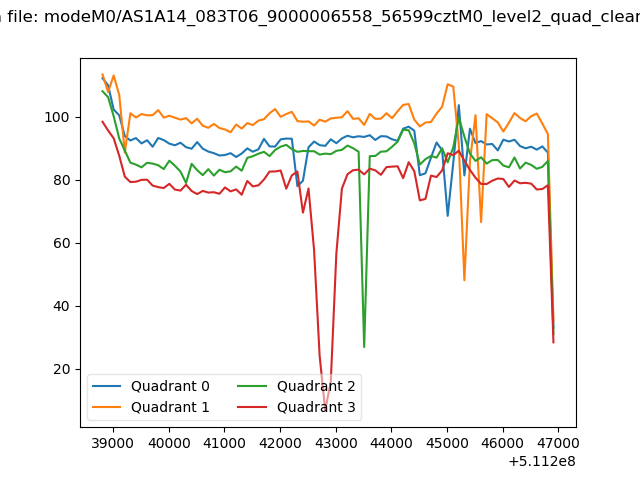
| Quadrant-wise count rates Data is divided into 100 sec bins |
 |
|
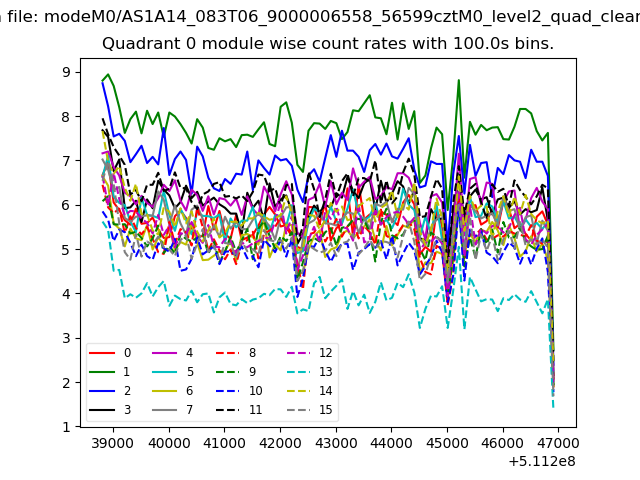
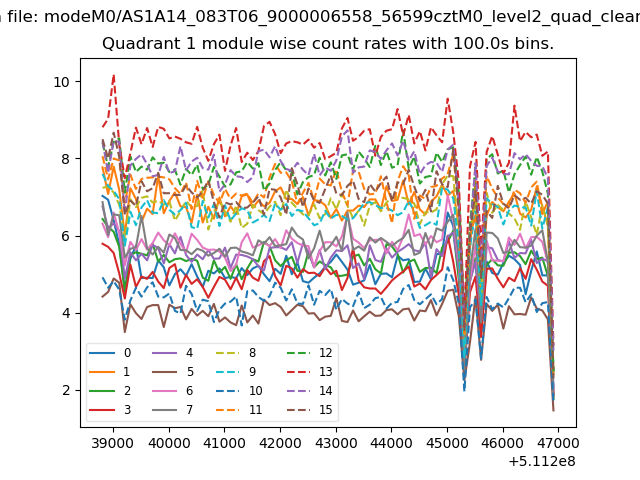
| Module-wise count rates for Quadrant A Data is divided into 100 sec bins |
 |
 |
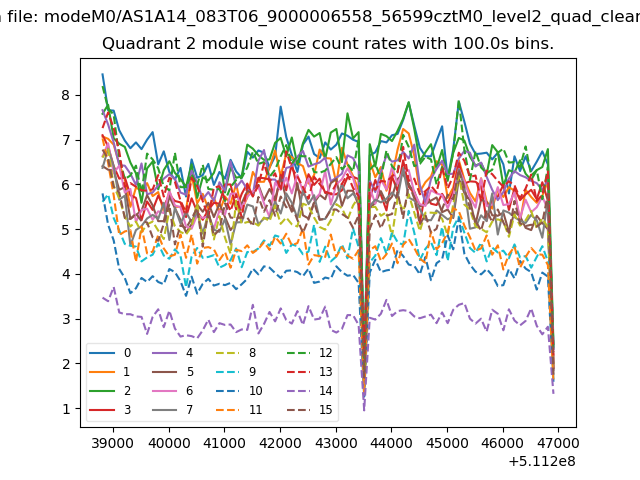
| Module-wise count rates for Quadrant B Data is divided into 100 sec bins |
 |
 |
| Module-wise count rates for Quadrant C Data is divided into 100 sec bins |
 |
 |
| Module-wise count rates for Quadrant D Data is divided into 100 sec bins |
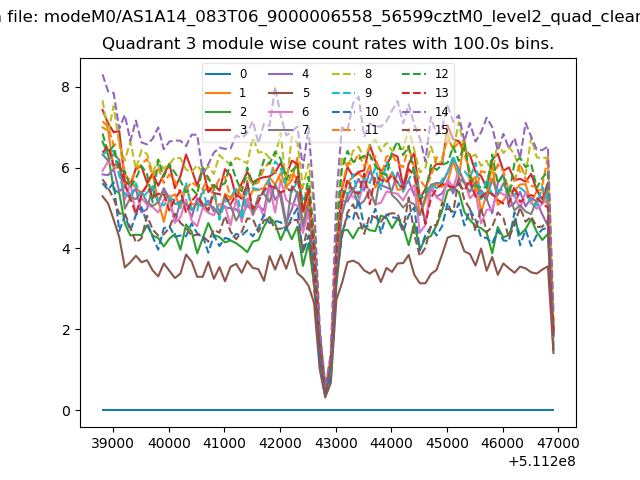 |
 |
| Parameter | Plot |
|---|---|
| CZT HV Monitor | 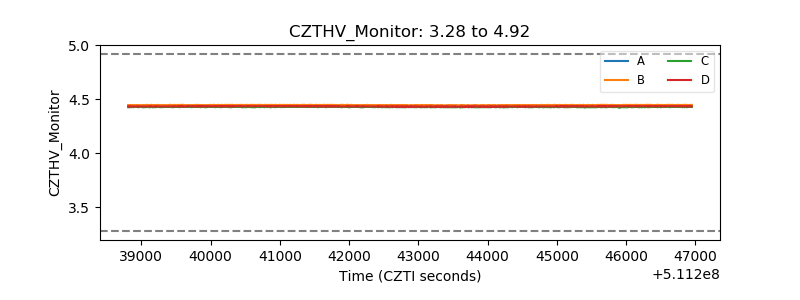 |
| D_VDD | 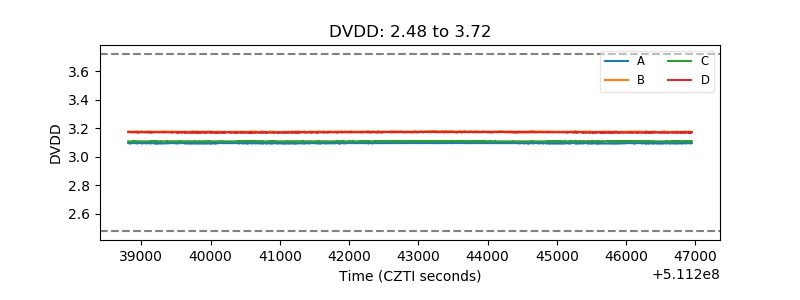 |
| Temperature 1 | 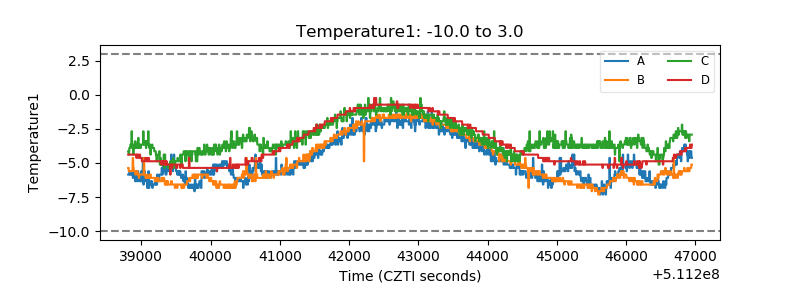 |
| Veto HV Monitor | 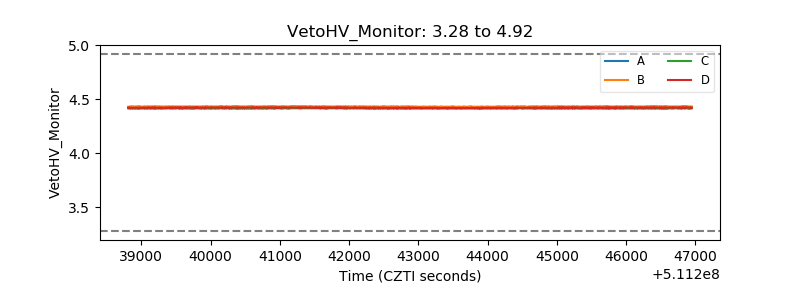 |
| Veto LLD | 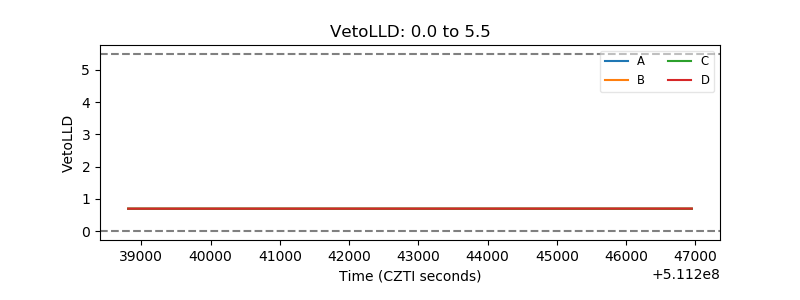 |
| Alpha Counter | 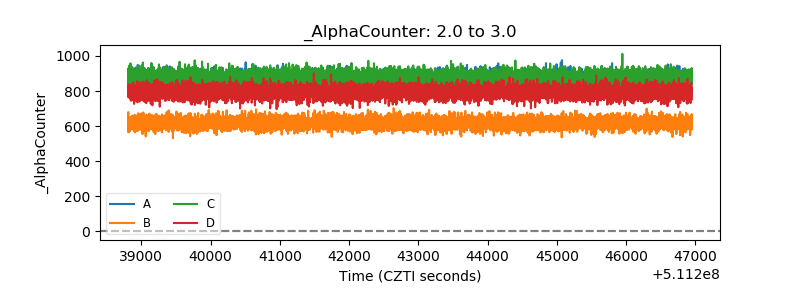 |
| _CPM_Rate | 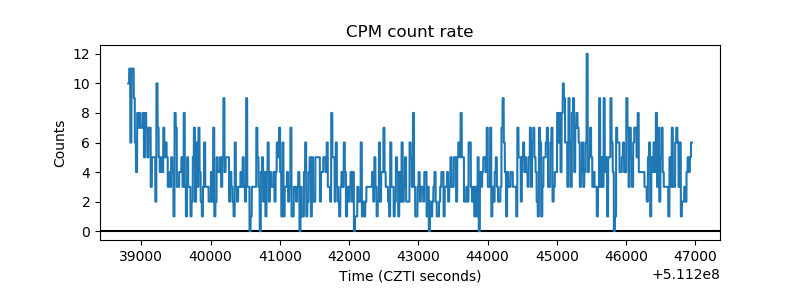 |
| CZT Counter | 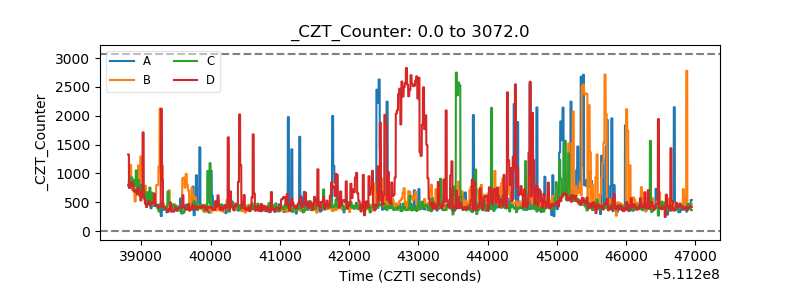 |
| +2.5 Volts monitor |  |
| +5 Volts monitor |  |
| _ROLL_ROT | 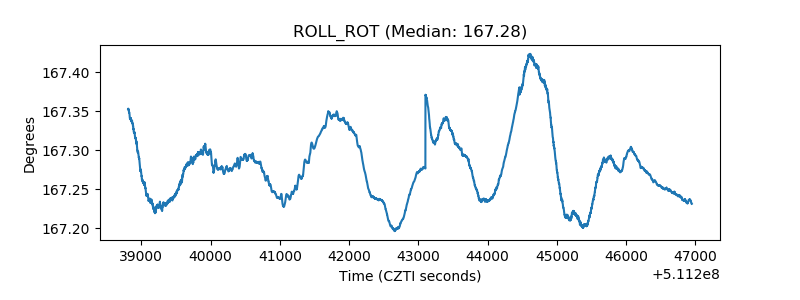 |
| _Roll_DEC | 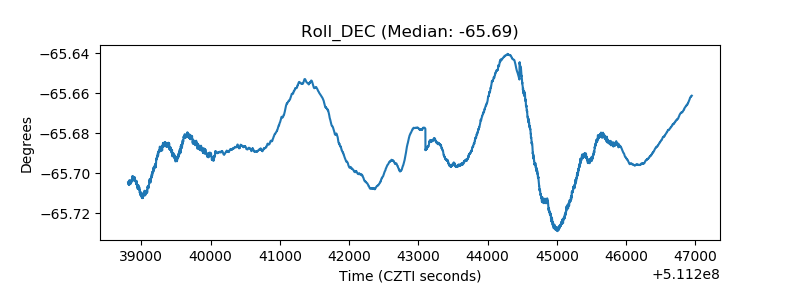 |
| _Roll_RA | 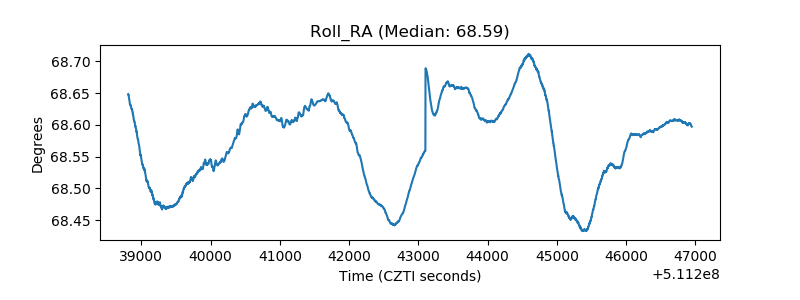 |
| Veto Counter | 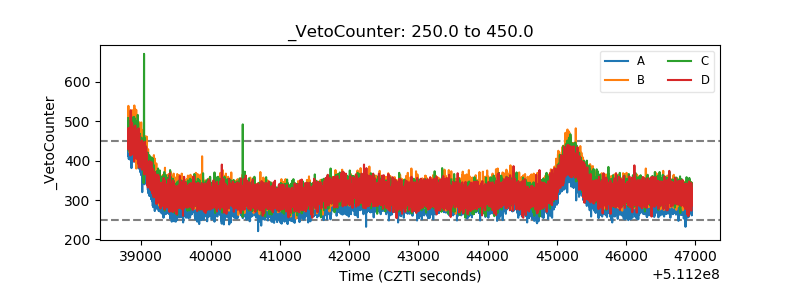 |