| Param | Original file | Final file |
|---|---|---|
| Filename | modeM0/AS1A14_083T06_9000006558_56600cztM0_level2.fits | modeM0/AS1A14_083T06_9000006558_56600cztM0_level2_quad_clean.evt |
| Size (bytes) | 521,294,400 | 110,905,920 |
| Size | 497.1 MB | 105.8 MB |
| Events in quadrant A | 4,199,560 | 722,890 |
| Events in quadrant B | 4,795,632 | 777,526 |
| Events in quadrant C | 4,488,501 | 678,071 |
| Events in quadrant D | 5,200,000 | 630,751 |
| Mode SS | |||
|---|---|---|---|
| Quadrant | BADHDUFLAG | Total packets | Discarded packets |
| A | 0 | 158 | 0 |
| B | 0 | 158 | 0 |
| C | 0 | 158 | 0 |
| D | 0 | 158 | 0 |
| Mode M0 | |||
|---|---|---|---|
| Quadrant | BADHDUFLAG | Total packets | Discarded packets |
| A | 0 | 18283 | 0 |
| B | 0 | 19811 | 2 |
| C | 0 | 19209 | 0 |
| D | 0 | 21106 | 0 |
| Quadrant | Total seconds | Saturated seconds | Saturation percentage |
|---|---|---|---|
| A | 7893 | 154 | 1.951096% |
| B | 7892 | 277 | 3.509883% |
| C | 7892 | 268 | 3.395844% |
| D | 7893 | 347 | 4.396301% |
Noise dominated data is calculated using 1-second bins in cleaned event files. If a bin has >2000 counts, and if more than 50% of those come from <1% of pixels, then it is considered to be noise-dominated and hence unusable.
| Quadrant | # 1 sec bins | Bins with >0 counts | Bins with >2000 counts | High rate bins dominated by noise | Noise dominated (total time) | Noise dominated (detector-on time) | Marked lightcurve |
|---|---|---|---|---|---|---|---|
| A | 7893 | 7893 | 134 | 134 | 1.70% | 1.70% | 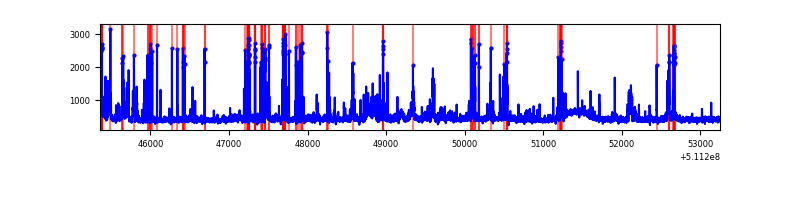 |
| B | 7892 | 7892 | 171 | 171 | 2.17% | 2.17% | 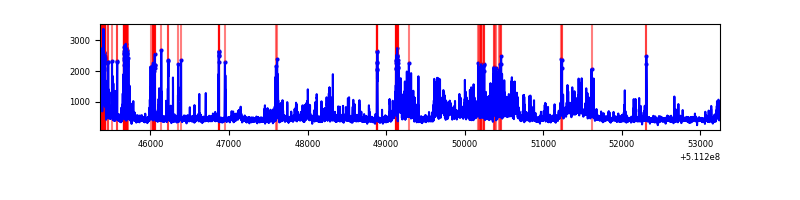 |
| C | 7892 | 7892 | 299 | 299 | 3.79% | 3.79% | 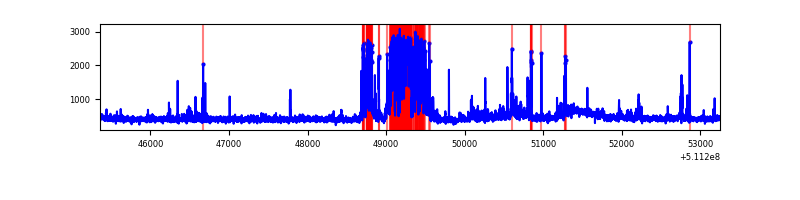 |
| D | 7893 | 7893 | 383 | 383 | 4.85% | 4.85% | 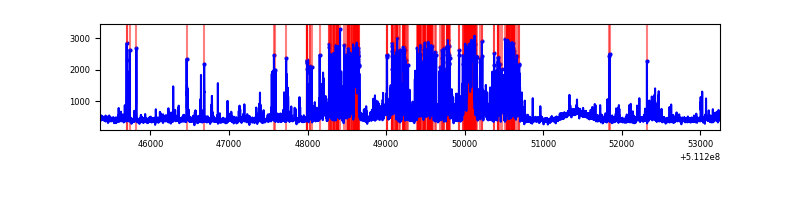 |
Top three noisy pixels from each quadrant. If the there are fewer than three noisy pixels in the level2.evt file, extra rows are filled as -1
| Pixel properties | Quadrant properties | ||||||
|---|---|---|---|---|---|---|---|
| Quadrant | DetID | PixID | Counts | Sigma | Mean | Median | Sigma |
| A | 0 | 8 | 306494 | 1474.53 | 831 | 811 | 207.3 |
| A | 8 | 249 | 167421 | 803.68 | 831 | 811 | 207.3 |
| A | 4 | 249 | 137710 | 660.36 | 831 | 811 | 207.3 |
| B | 5 | 185 | 1300350 | 7302.01 | 826 | 796 | 178.0 |
| B | 0 | 171 | 77535 | 431.19 | 826 | 796 | 178.0 |
| B | 4 | 21 | 50070 | 276.86 | 826 | 796 | 178.0 |
| C | 15 | 230 | 908151 | 4106.81 | 812 | 804 | 220.9 |
| C | 12 | 252 | 218109 | 983.56 | 812 | 804 | 220.9 |
| C | 6 | 223 | 73038 | 326.94 | 812 | 804 | 220.9 |
| D | 6 | 239 | 760787 | 3380.07 | 796 | 759 | 224.9 |
| D | 2 | 249 | 437598 | 1942.75 | 796 | 759 | 224.9 |
| D | 8 | 129 | 217757 | 965.05 | 796 | 759 | 224.9 |
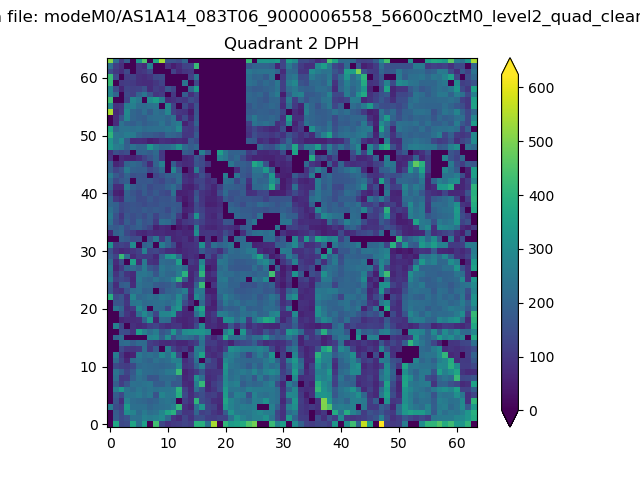
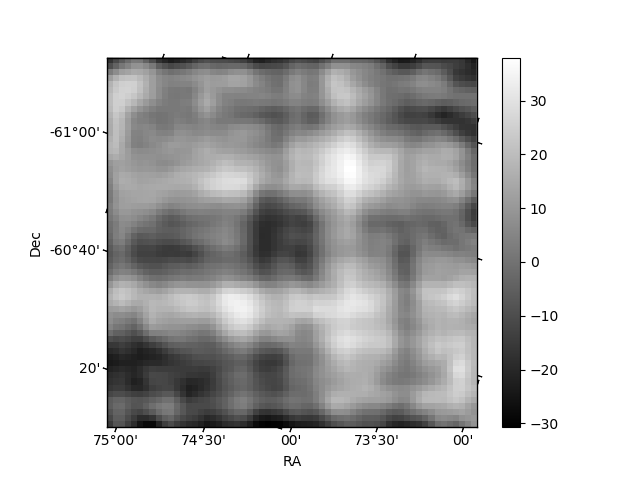
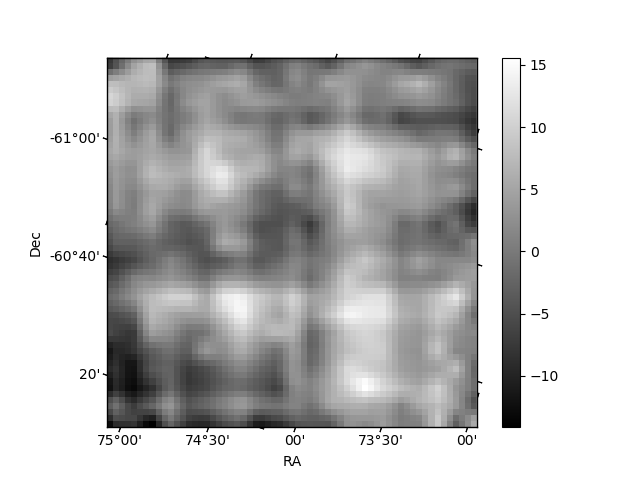
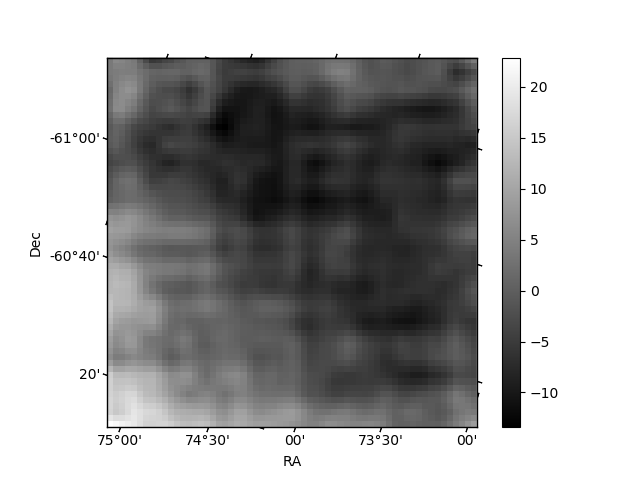
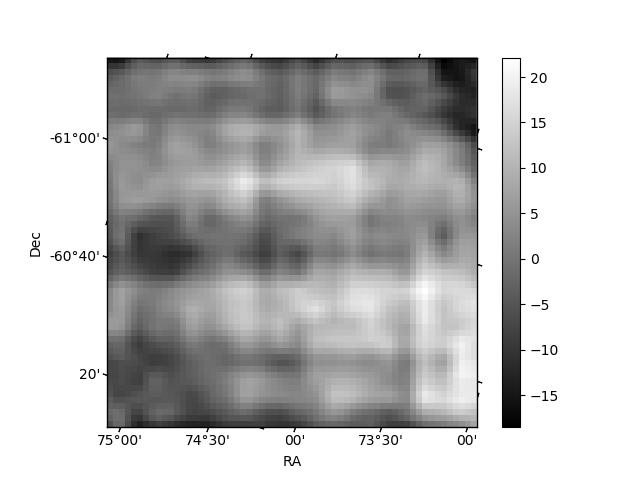
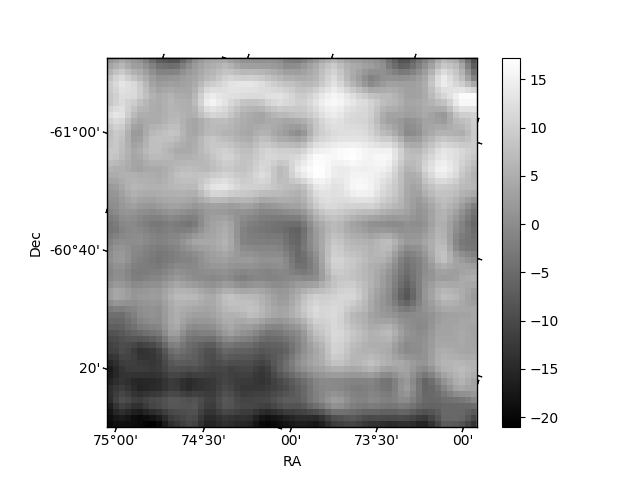
Histogram calculated using DETX and DETY for each event in the final _common_clean file
| Quadrant A | 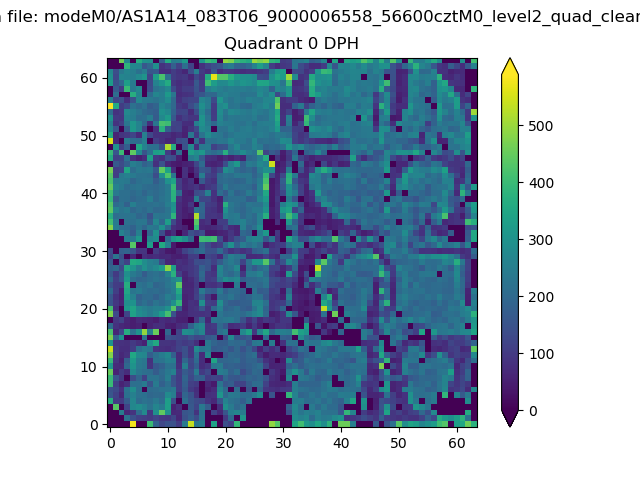 |
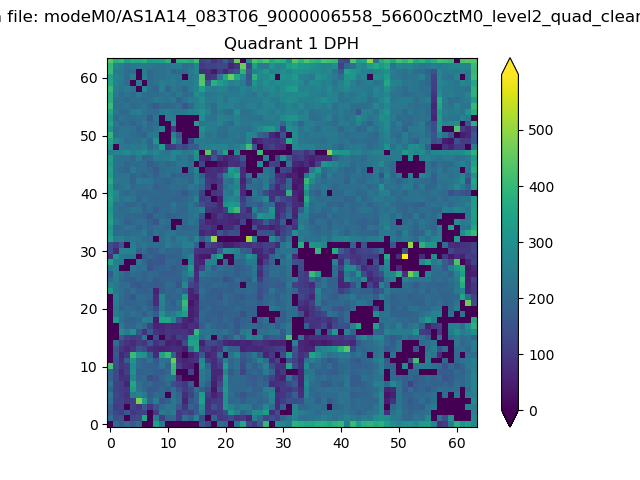 |
Quadrant B |
|---|---|---|---|
| Quadrant D | 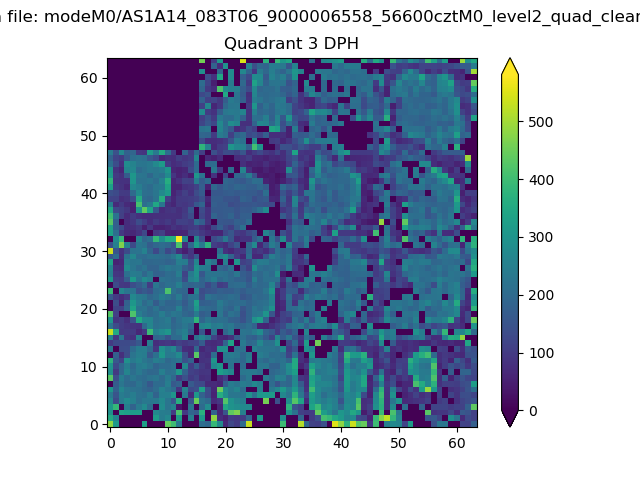 |
 |
Quadrant C |
| Plot type | Count rate plots | Images |
|---|---|---|
| Comparison with Poisson distribution Blue bars denote a histogram of data divided into 1 sec bins. Red curve is a Poisson curve with rate = median count rate of data. |
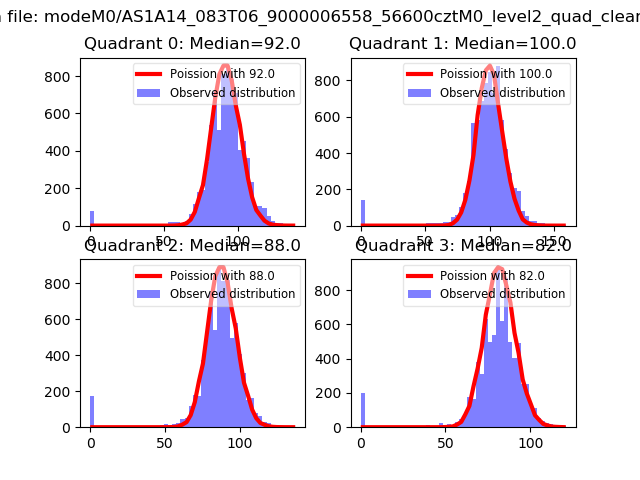 |
 |
| Quadrant-wise count rates Data is divided into 100 sec bins |
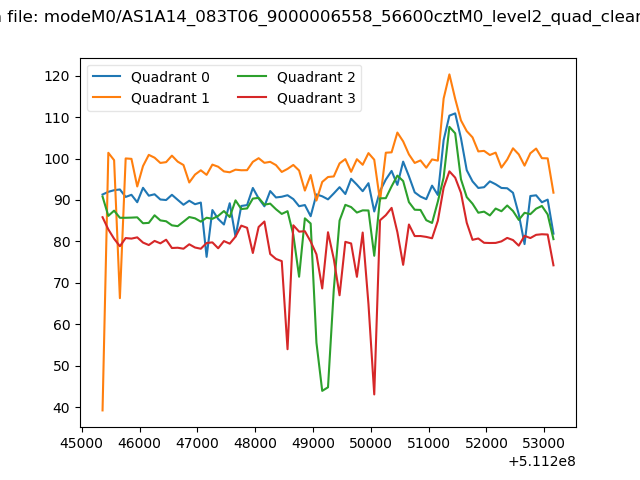 |
|
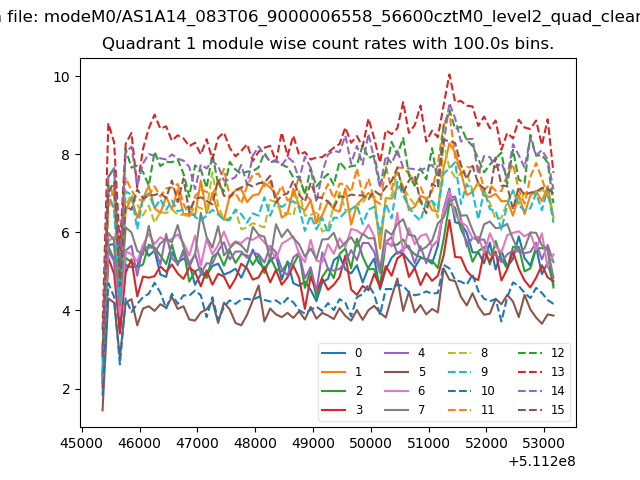
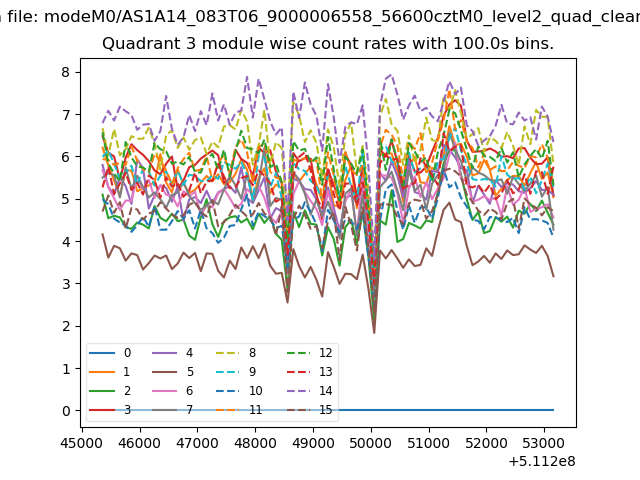
| Module-wise count rates for Quadrant A Data is divided into 100 sec bins |
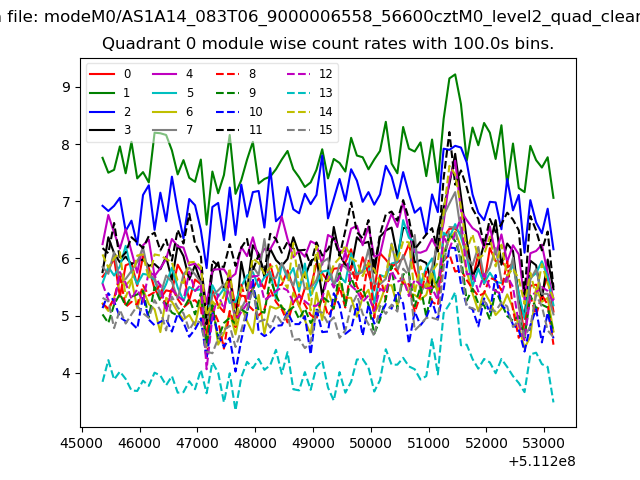 |
 |
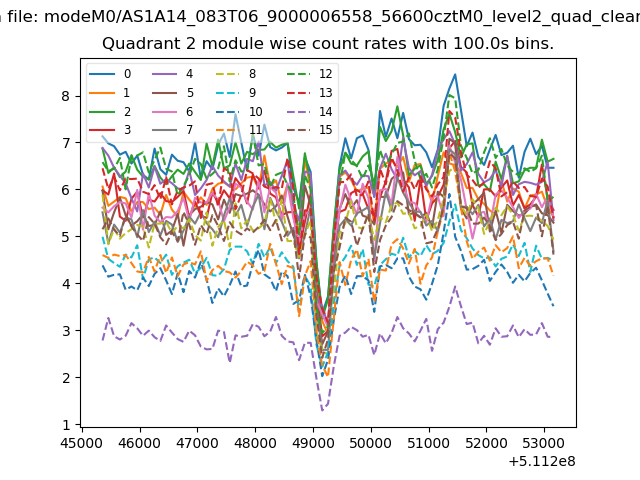
| Module-wise count rates for Quadrant B Data is divided into 100 sec bins |
 |
 |
| Module-wise count rates for Quadrant C Data is divided into 100 sec bins |
 |
 |
| Module-wise count rates for Quadrant D Data is divided into 100 sec bins |
 |
 |
| Parameter | Plot |
|---|---|
| CZT HV Monitor | 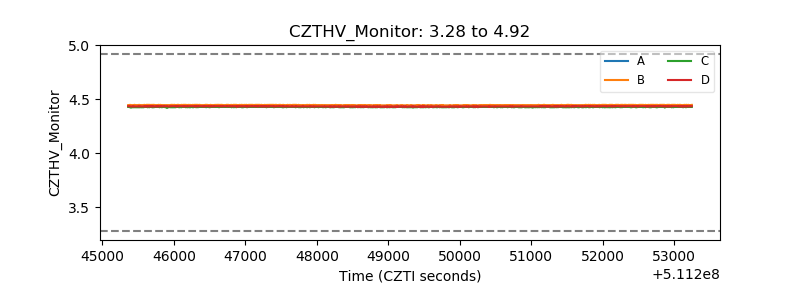 |
| D_VDD | 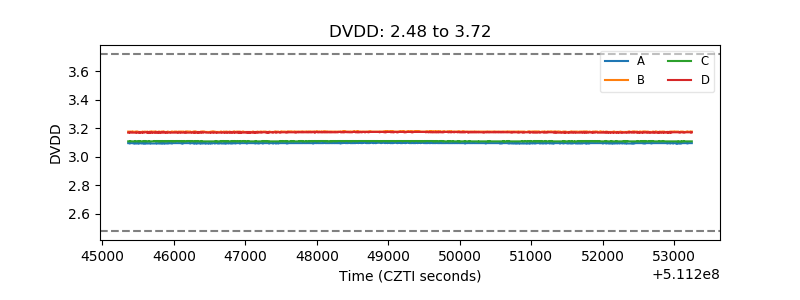 |
| Temperature 1 | 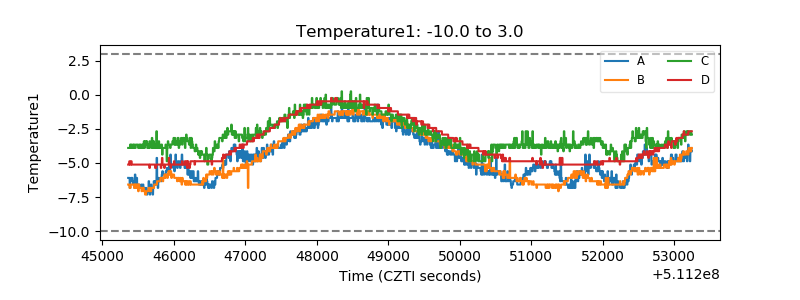 |
| Veto HV Monitor | 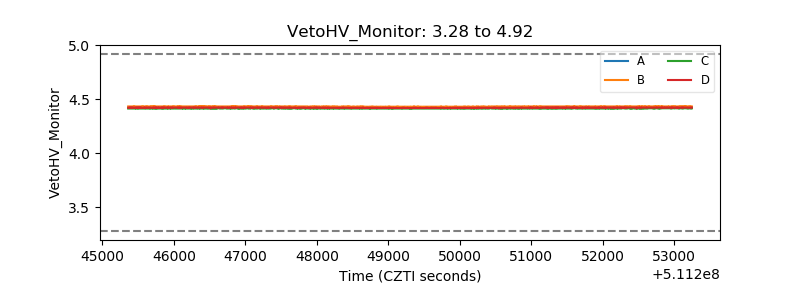 |
| Veto LLD | 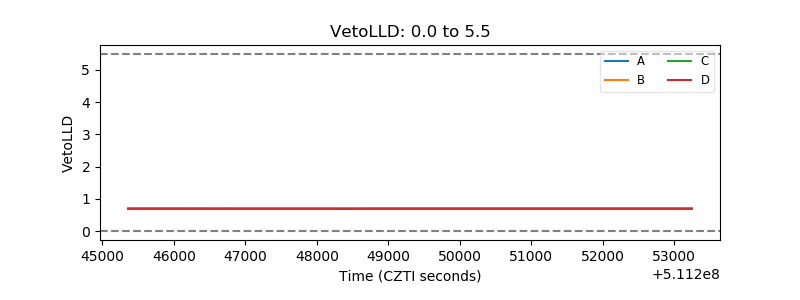 |
| Alpha Counter | 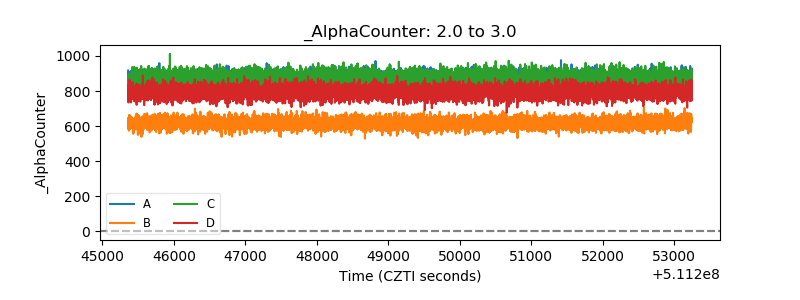 |
| _CPM_Rate | 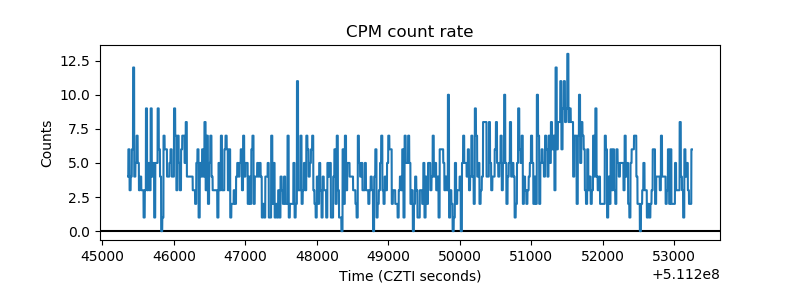 |
| CZT Counter | 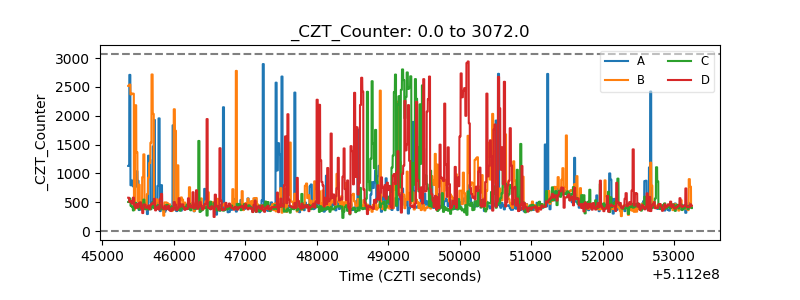 |
| +2.5 Volts monitor |  |
| +5 Volts monitor |  |
| _ROLL_ROT | 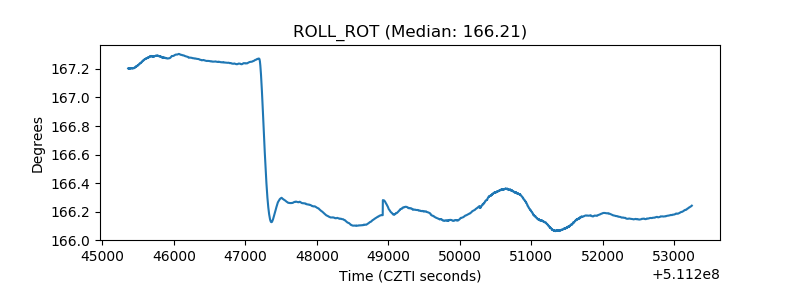 |
| _Roll_DEC | 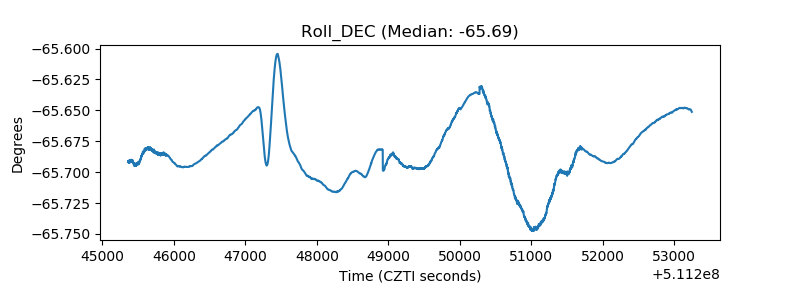 |
| _Roll_RA | 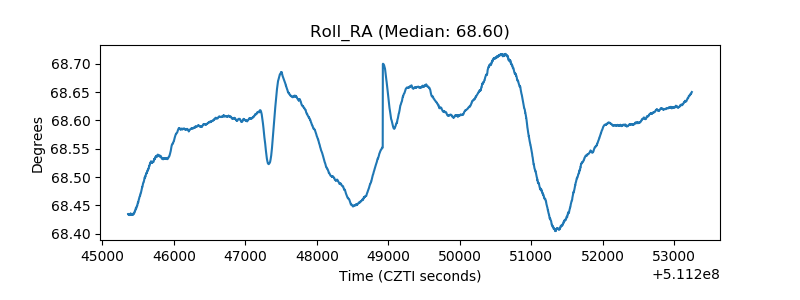 |
| Veto Counter | 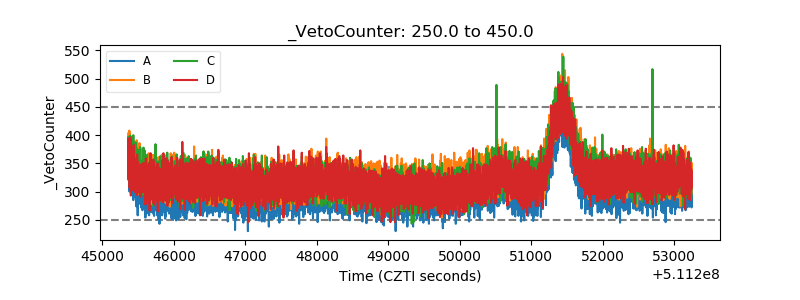 |