| Param | Original file | Final file |
|---|---|---|
| Filename | modeM0/AS1A14_083T06_9000006558_56603cztM0_level2.fits | modeM0/AS1A14_083T06_9000006558_56603cztM0_level2_quad_clean.evt |
| Size (bytes) | 1,277,366,400 | 261,861,120 |
| Size | 1.2 GB | 249.7 MB |
| Events in quadrant A | 9,787,813 | 1,737,194 |
| Events in quadrant B | 9,060,684 | 1,879,482 |
| Events in quadrant C | 10,434,841 | 1,614,880 |
| Events in quadrant D | 16,516,907 | 1,377,583 |
| Mode SS | |||
|---|---|---|---|
| Quadrant | BADHDUFLAG | Total packets | Discarded packets |
| A | 0 | 386 | 0 |
| B | 0 | 386 | 0 |
| C | 0 | 386 | 0 |
| D | 0 | 386 | 0 |
| Mode M9 | |||
|---|---|---|---|
| Quadrant | BADHDUFLAG | Total packets | Discarded packets |
| A | 0 | 13 | 0 |
| B | 0 | 13 | 0 |
| C | 0 | 13 | 0 |
| D | 0 | 13 | 0 |
| Mode M0 | |||
|---|---|---|---|
| Quadrant | BADHDUFLAG | Total packets | Discarded packets |
| A | 0 | 42858 | 4 |
| B | 0 | 40589 | 4 |
| C | 0 | 44961 | 4 |
| D | 0 | 62172 | 4 |
| Quadrant | Total seconds | Saturated seconds | Saturation percentage |
|---|---|---|---|
| A | 19152 | 543 | 2.835213% |
| B | 19152 | 463 | 2.417502% |
| C | 19152 | 991 | 5.174394% |
| D | 19153 | 2195 | 11.460346% |
Noise dominated data is calculated using 1-second bins in cleaned event files. If a bin has >2000 counts, and if more than 50% of those come from <1% of pixels, then it is considered to be noise-dominated and hence unusable.
| Quadrant | # 1 sec bins | Bins with >0 counts | Bins with >2000 counts | High rate bins dominated by noise | Noise dominated (total time) | Noise dominated (detector-on time) | Marked lightcurve |
|---|---|---|---|---|---|---|---|
| A | 20387 | 19153 | 184 | 184 | 0.90% | 0.96% | 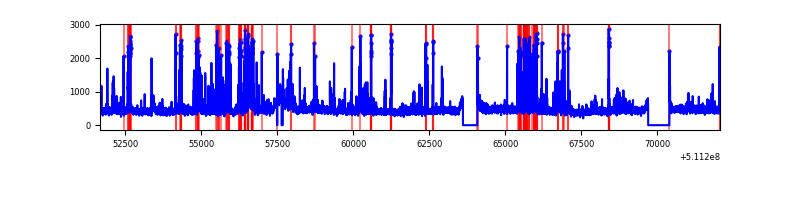 |
| B | 20386 | 19151 | 55 | 55 | 0.27% | 0.29% | 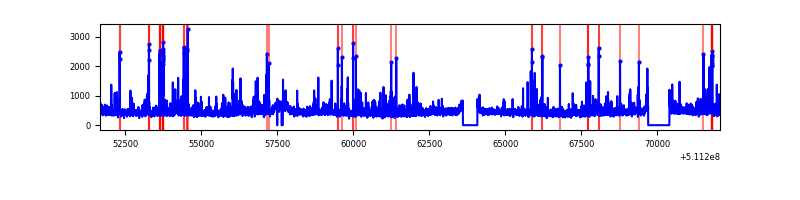 |
| C | 20386 | 19152 | 382 | 382 | 1.87% | 1.99% | 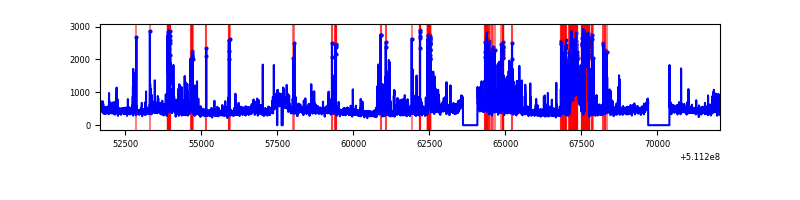 |
| D | 20388 | 19154 | 1999 | 1999 | 9.80% | 10.44% | 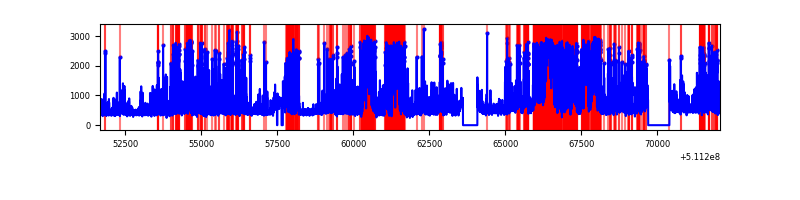 |
Top three noisy pixels from each quadrant. If the there are fewer than three noisy pixels in the level2.evt file, extra rows are filled as -1
| Pixel properties | Quadrant properties | ||||||
|---|---|---|---|---|---|---|---|
| Quadrant | DetID | PixID | Counts | Sigma | Mean | Median | Sigma |
| A | 8 | 249 | 613384 | 1214.99 | 2048 | 1994 | 503.2 |
| A | 13 | 248 | 287575 | 567.52 | 2048 | 1994 | 503.2 |
| A | 4 | 159 | 236901 | 466.82 | 2048 | 1994 | 503.2 |
| B | 5 | 185 | 276511 | 627.21 | 2035 | 1956 | 437.7 |
| B | 10 | 247 | 195074 | 441.17 | 2035 | 1956 | 437.7 |
| B | 4 | 21 | 191189 | 432.3 | 2035 | 1956 | 437.7 |
| C | 13 | 3 | 1016831 | 1874.19 | 1978 | 1956 | 541.5 |
| C | 12 | 252 | 566252 | 1042.09 | 1978 | 1956 | 541.5 |
| C | 15 | 230 | 378762 | 695.85 | 1978 | 1956 | 541.5 |
| D | 2 | 249 | 2501081 | 4630.73 | 1916 | 1823 | 539.7 |
| D | 10 | 199 | 2289932 | 4239.5 | 1916 | 1823 | 539.7 |
| D | 6 | 239 | 954306 | 1764.8 | 1916 | 1823 | 539.7 |
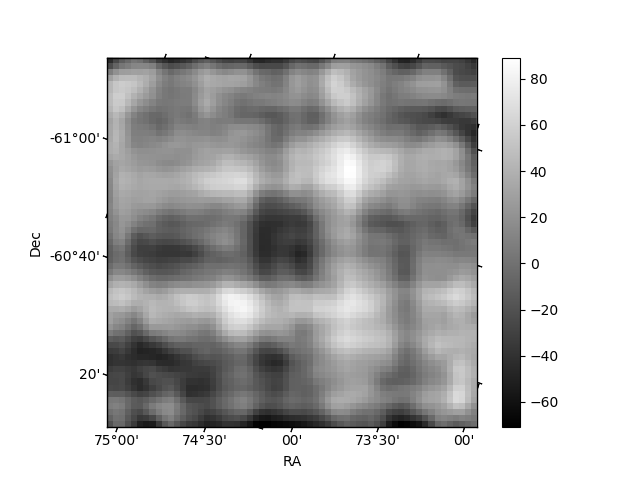
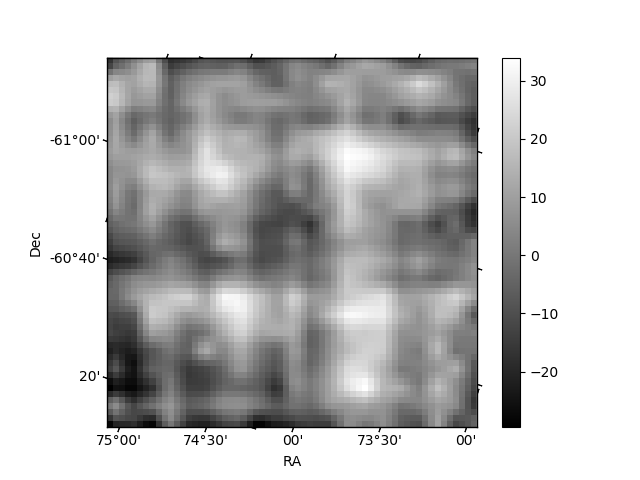
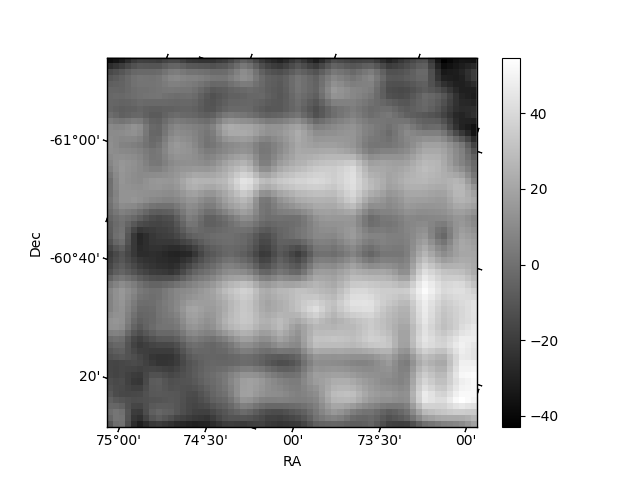
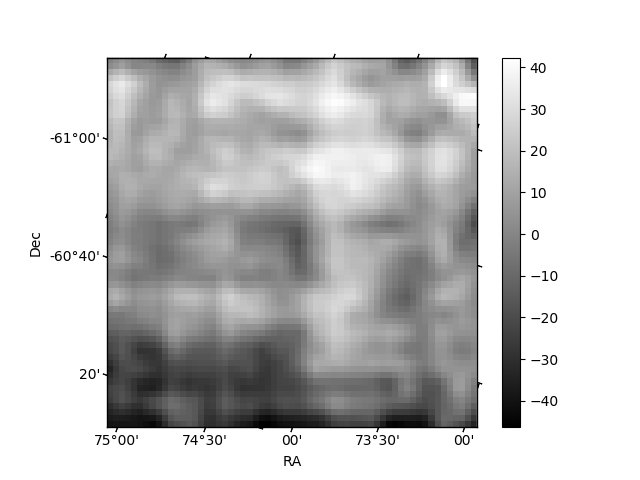
Histogram calculated using DETX and DETY for each event in the final _common_clean file
| Quadrant A | 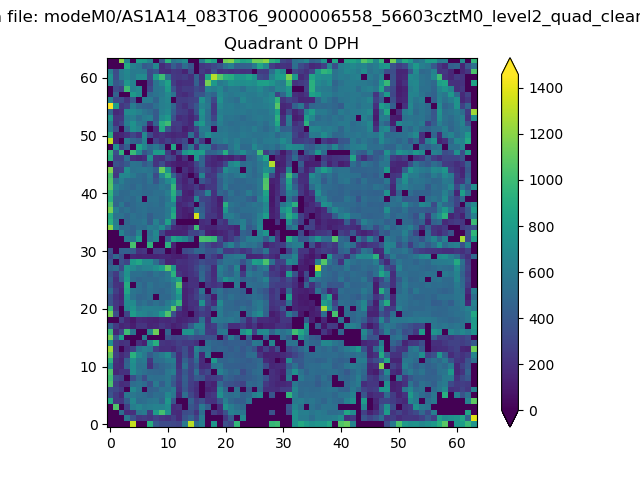 |
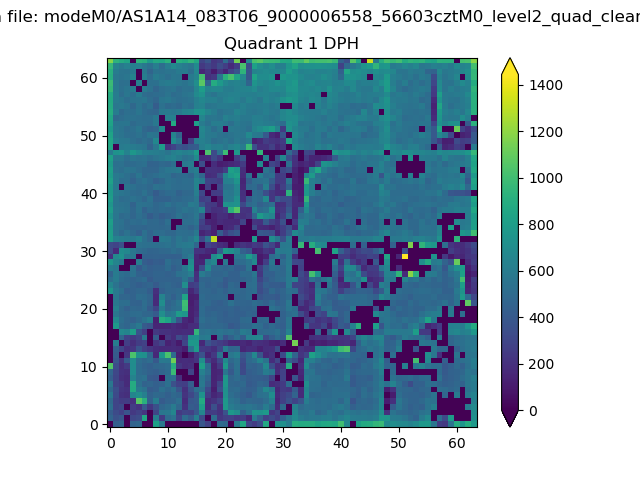 |
Quadrant B |
|---|---|---|---|
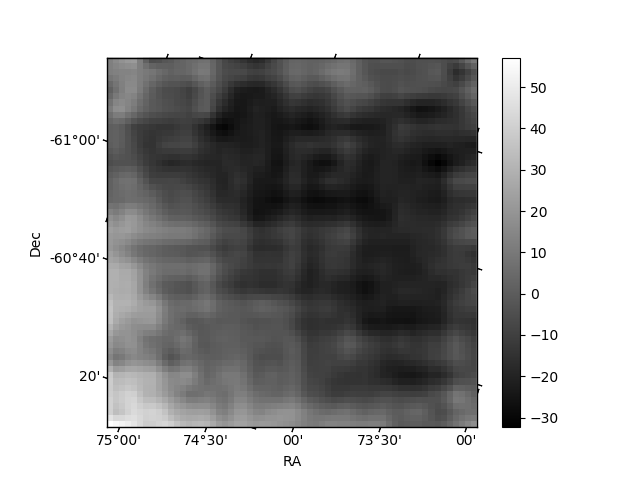
| Quadrant D | 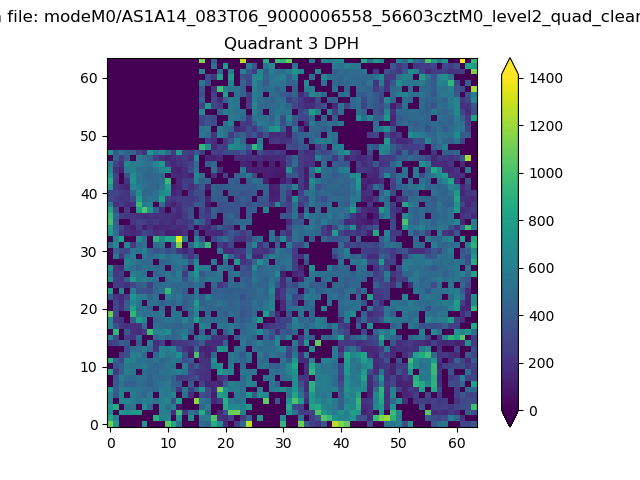 |
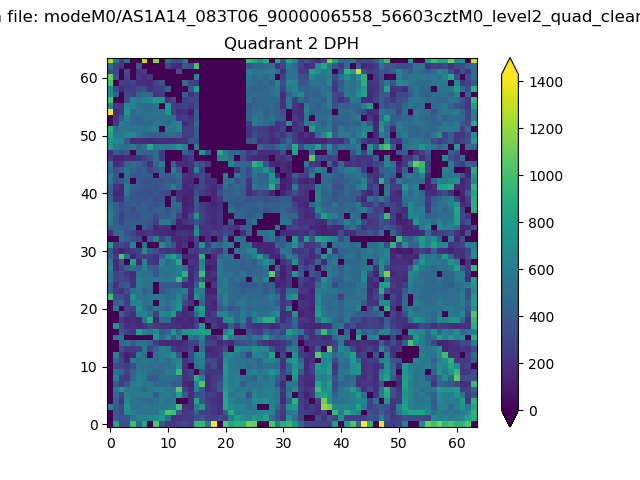 |
Quadrant C |
| Plot type | Count rate plots | Images |
|---|---|---|
| Comparison with Poisson distribution Blue bars denote a histogram of data divided into 1 sec bins. Red curve is a Poisson curve with rate = median count rate of data. |
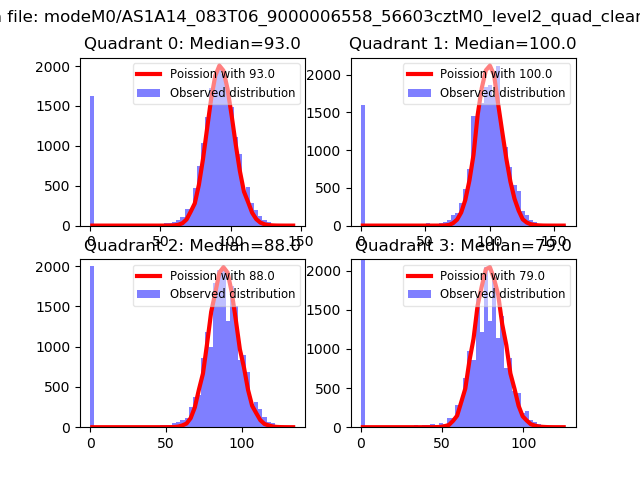 |
 |
| Quadrant-wise count rates Data is divided into 100 sec bins |
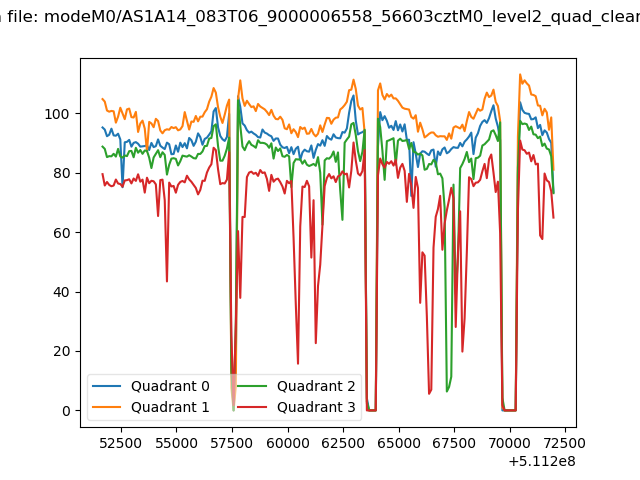 |
|
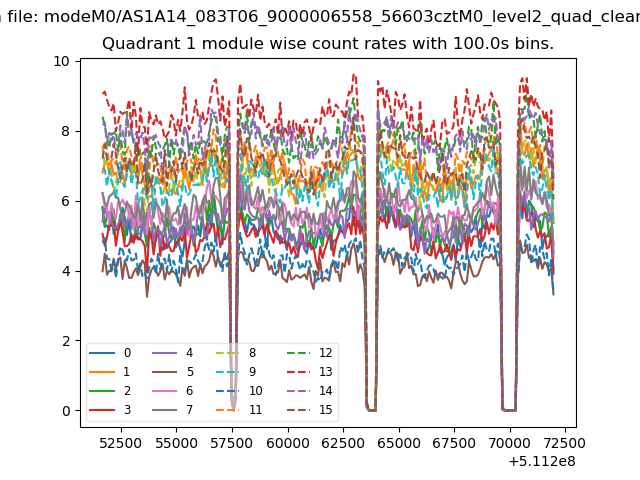
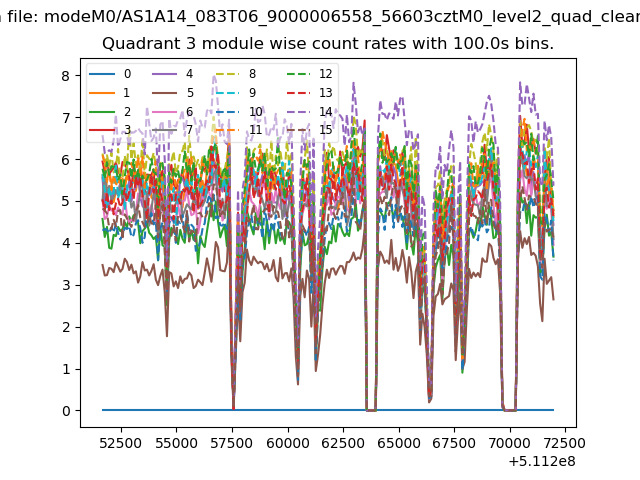
| Module-wise count rates for Quadrant A Data is divided into 100 sec bins |
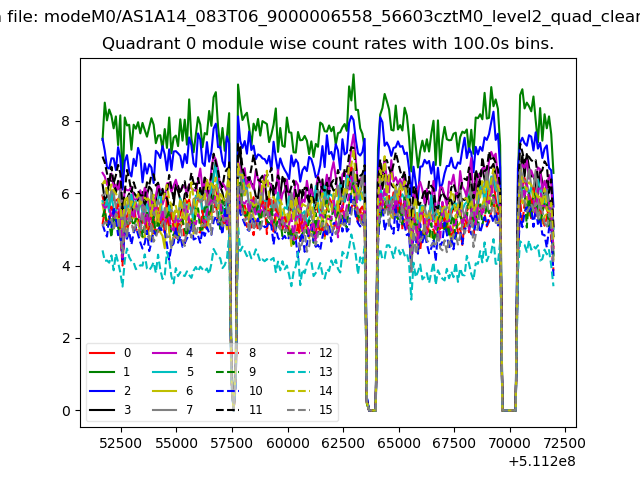 |
 |
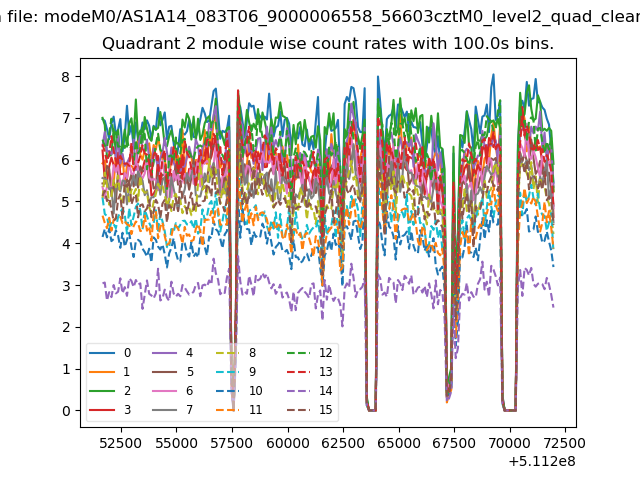
| Module-wise count rates for Quadrant B Data is divided into 100 sec bins |
 |
 |
| Module-wise count rates for Quadrant C Data is divided into 100 sec bins |
 |
 |
| Module-wise count rates for Quadrant D Data is divided into 100 sec bins |
 |
 |
| Parameter | Plot |
|---|---|
| CZT HV Monitor | 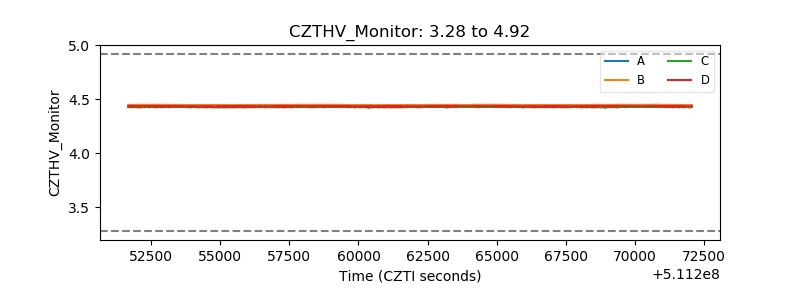 |
| D_VDD | 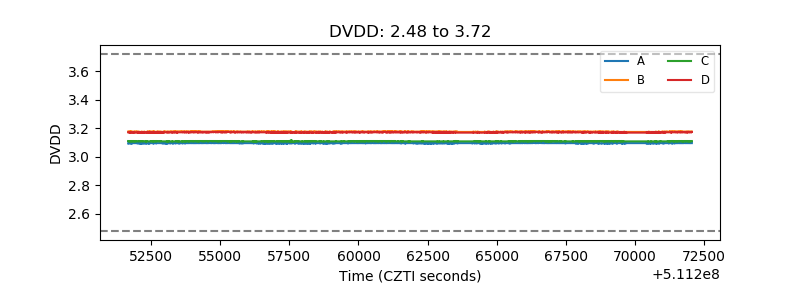 |
| Temperature 1 | 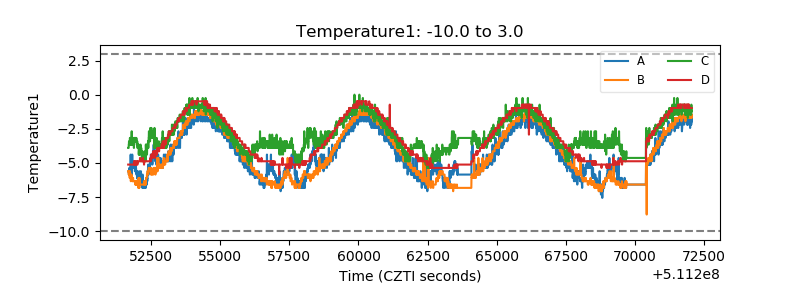 |
| Veto HV Monitor | 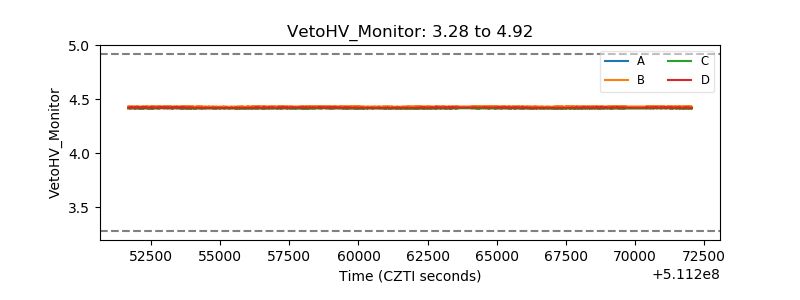 |
| Veto LLD | 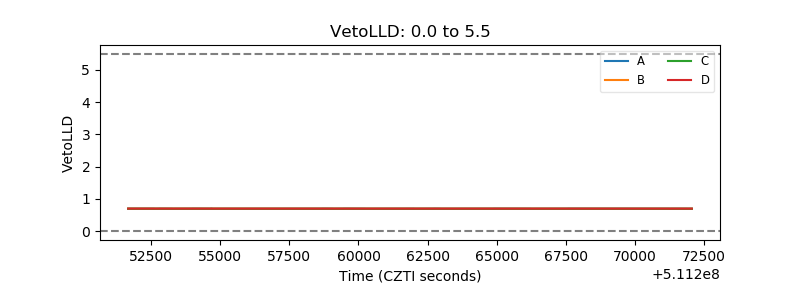 |
| Alpha Counter | 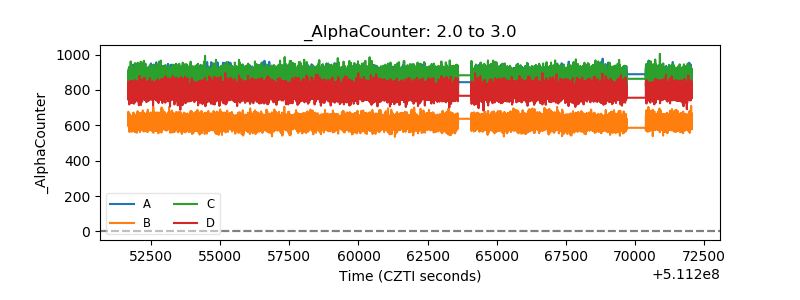 |
| _CPM_Rate | 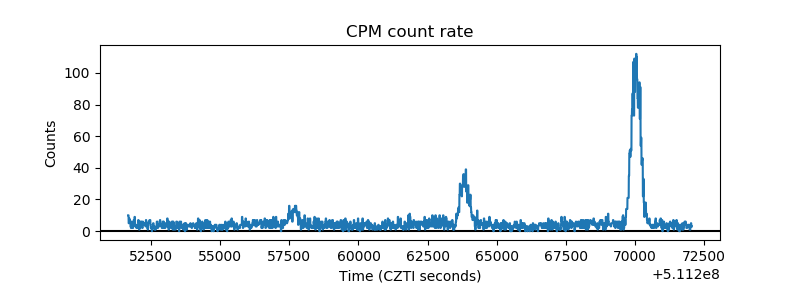 |
| CZT Counter | 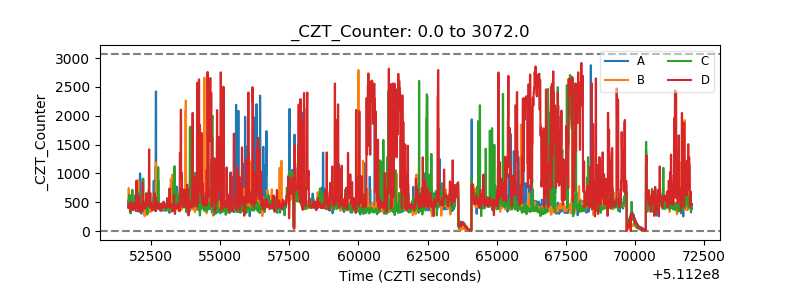 |
| +2.5 Volts monitor |  |
| +5 Volts monitor |  |
| _ROLL_ROT | 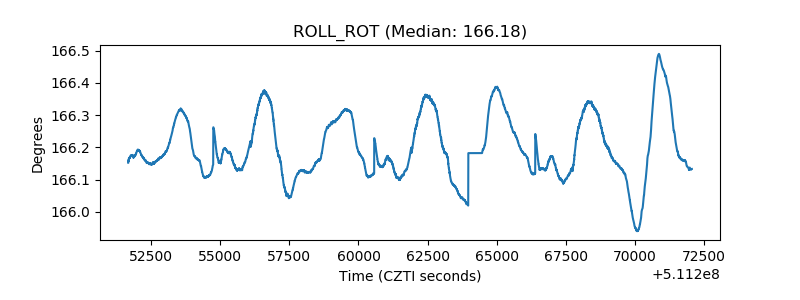 |
| _Roll_DEC | 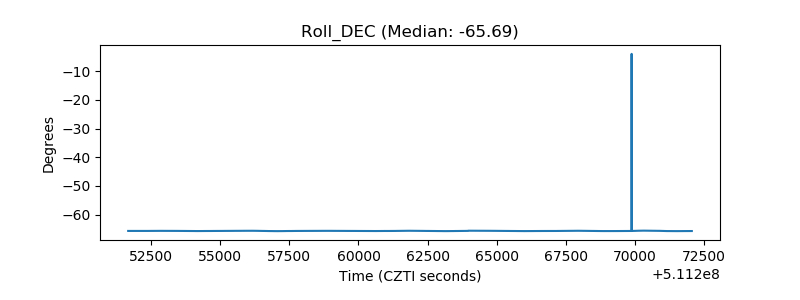 |
| _Roll_RA | 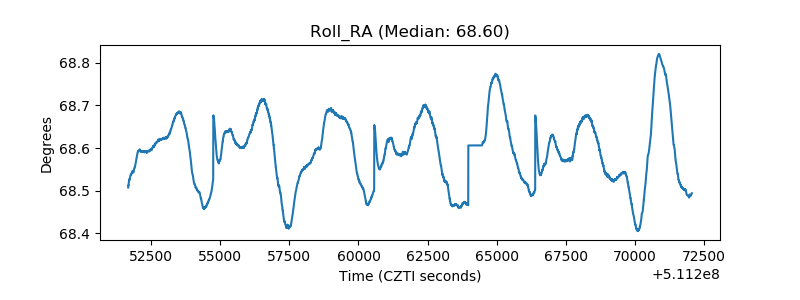 |
| Veto Counter | 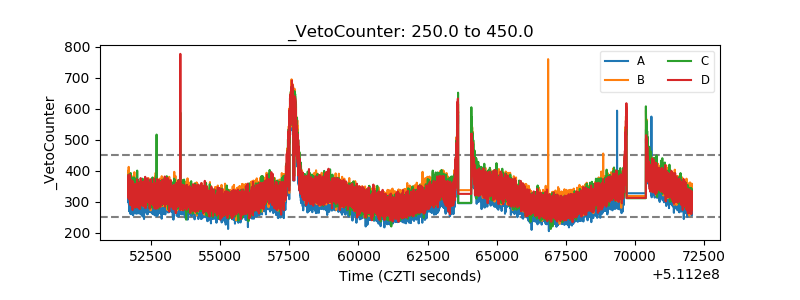 |