| Param | Original file | Final file |
|---|---|---|
| Filename | modeM0/AS1A14_083T06_9000006558_56604cztM0_level2.fits | modeM0/AS1A14_083T06_9000006558_56604cztM0_level2_quad_clean.evt |
| Size (bytes) | 390,248,640 | 86,967,360 |
| Size | 372.2 MB | 82.9 MB |
| Events in quadrant A | 2,848,550 | 569,141 |
| Events in quadrant B | 2,960,039 | 612,038 |
| Events in quadrant C | 3,044,814 | 543,056 |
| Events in quadrant D | 5,119,006 | 484,570 |
| Mode SS | |||
|---|---|---|---|
| Quadrant | BADHDUFLAG | Total packets | Discarded packets |
| A | 0 | 122 | 0 |
| B | 0 | 122 | 0 |
| C | 0 | 122 | 0 |
| D | 0 | 122 | 0 |
| Mode M9 | |||
|---|---|---|---|
| Quadrant | BADHDUFLAG | Total packets | Discarded packets |
| A | 0 | 9 | 0 |
| B | 0 | 9 | 0 |
| C | 0 | 9 | 0 |
| D | 0 | 9 | 0 |
| Mode M0 | |||
|---|---|---|---|
| Quadrant | BADHDUFLAG | Total packets | Discarded packets |
| A | 0 | 13056 | 1 |
| B | 0 | 13153 | 1 |
| C | 0 | 13596 | 1 |
| D | 0 | 19420 | 1 |
| Quadrant | Total seconds | Saturated seconds | Saturation percentage |
|---|---|---|---|
| A | 6080 | 80 | 1.315789% |
| B | 6081 | 89 | 1.463575% |
| C | 6081 | 83 | 1.364907% |
| D | 6081 | 501 | 8.238777% |
Noise dominated data is calculated using 1-second bins in cleaned event files. If a bin has >2000 counts, and if more than 50% of those come from <1% of pixels, then it is considered to be noise-dominated and hence unusable.
| Quadrant | # 1 sec bins | Bins with >0 counts | Bins with >2000 counts | High rate bins dominated by noise | Noise dominated (total time) | Noise dominated (detector-on time) | Marked lightcurve |
|---|---|---|---|---|---|---|---|
| A | 6959 | 6079 | 35 | 35 | 0.50% | 0.58% | 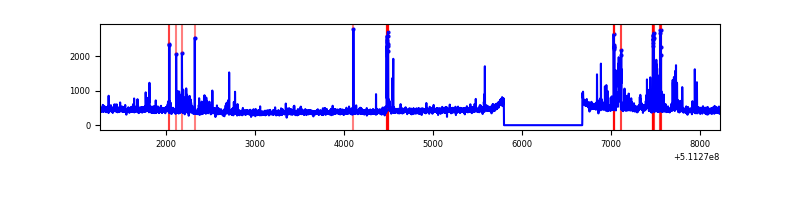 |
| B | 6960 | 6080 | 28 | 28 | 0.40% | 0.46% | 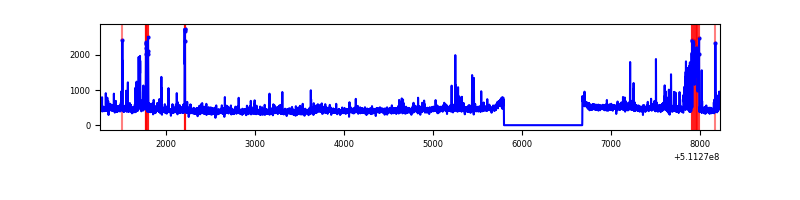 |
| C | 6960 | 6080 | 43 | 43 | 0.62% | 0.71% | 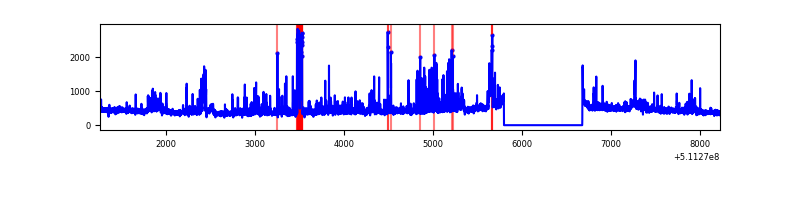 |
| D | 6960 | 6080 | 516 | 516 | 7.41% | 8.49% | 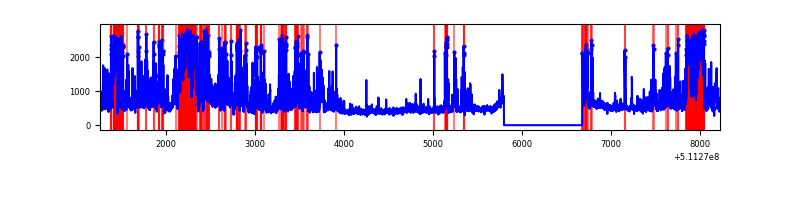 |
Top three noisy pixels from each quadrant. If the there are fewer than three noisy pixels in the level2.evt file, extra rows are filled as -1
| Pixel properties | Quadrant properties | ||||||
|---|---|---|---|---|---|---|---|
| Quadrant | DetID | PixID | Counts | Sigma | Mean | Median | Sigma |
| A | 13 | 248 | 136296 | 842.42 | 645 | 628 | 161.0 |
| A | 8 | 249 | 109857 | 678.25 | 645 | 628 | 161.0 |
| A | 4 | 95 | 33090 | 201.57 | 645 | 628 | 161.0 |
| B | 5 | 236 | 103579 | 749.75 | 638 | 616 | 137.3 |
| B | 10 | 246 | 86793 | 627.52 | 638 | 616 | 137.3 |
| B | 10 | 247 | 63596 | 458.61 | 638 | 616 | 137.3 |
| C | 12 | 252 | 203767 | 1175.54 | 622 | 616 | 172.8 |
| C | 12 | 249 | 98124 | 564.24 | 622 | 616 | 172.8 |
| C | 15 | 193 | 92291 | 530.48 | 622 | 616 | 172.8 |
| D | 10 | 199 | 915826 | 5331.81 | 605 | 577 | 171.7 |
| D | 2 | 249 | 635642 | 3699.59 | 605 | 577 | 171.7 |
| D | 6 | 239 | 252514 | 1467.66 | 605 | 577 | 171.7 |
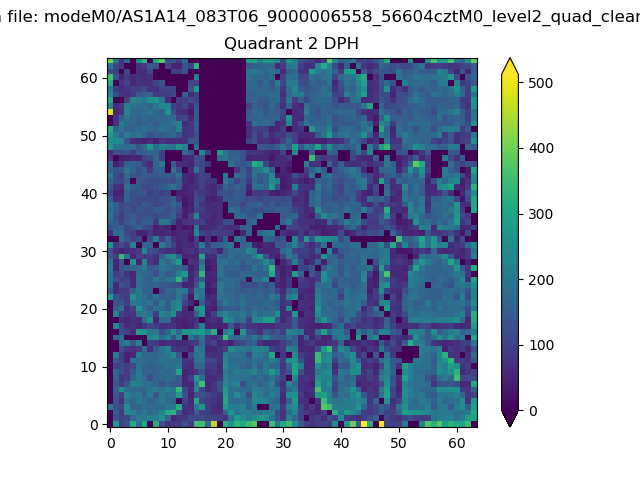
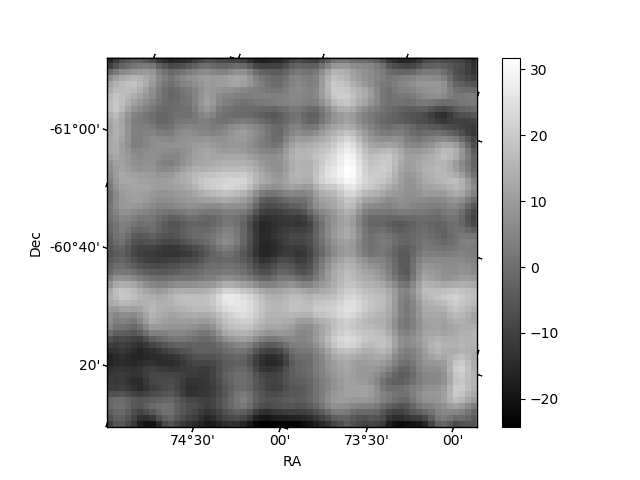
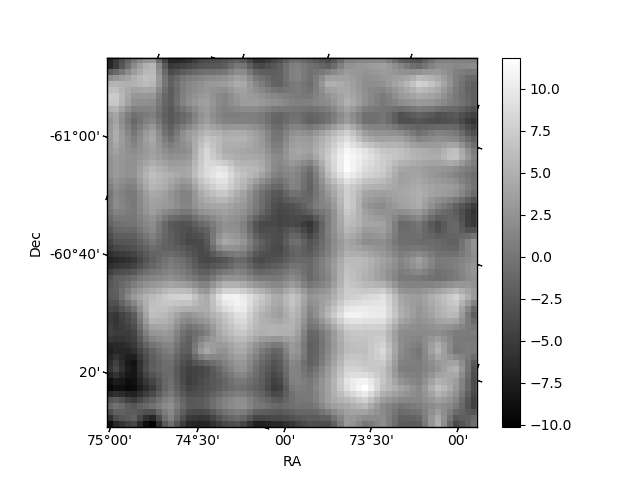
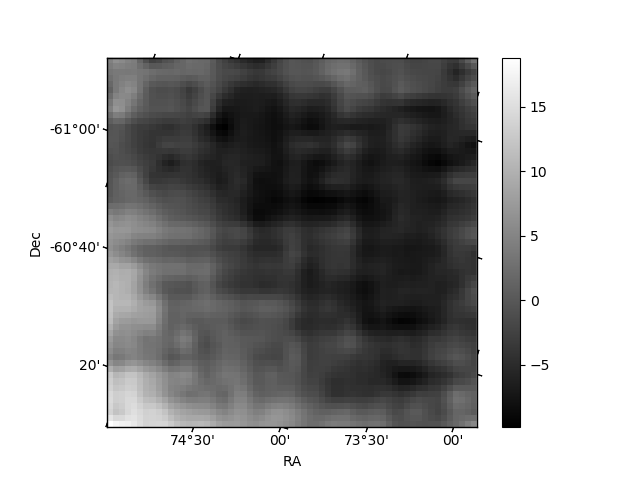
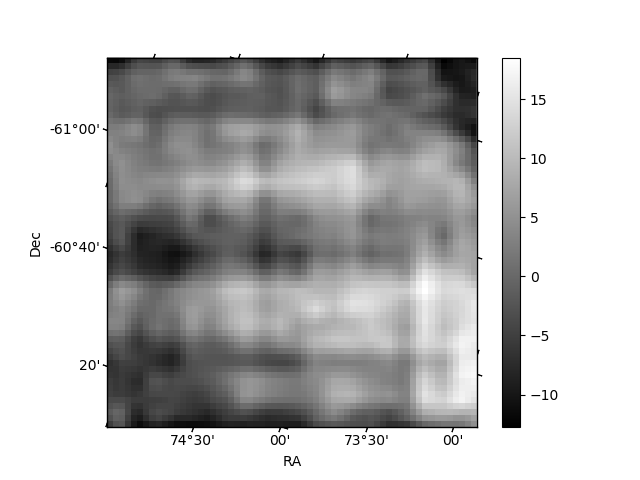
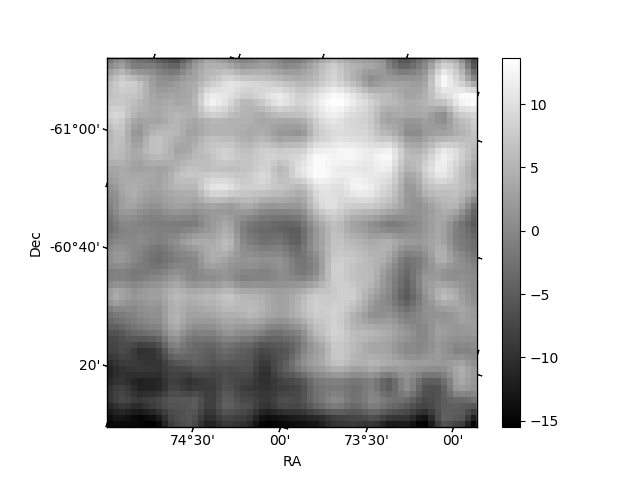
Histogram calculated using DETX and DETY for each event in the final _common_clean file
| Quadrant A | 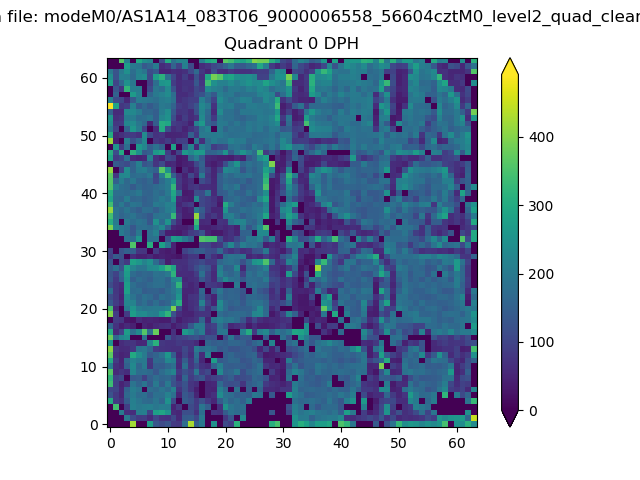 |
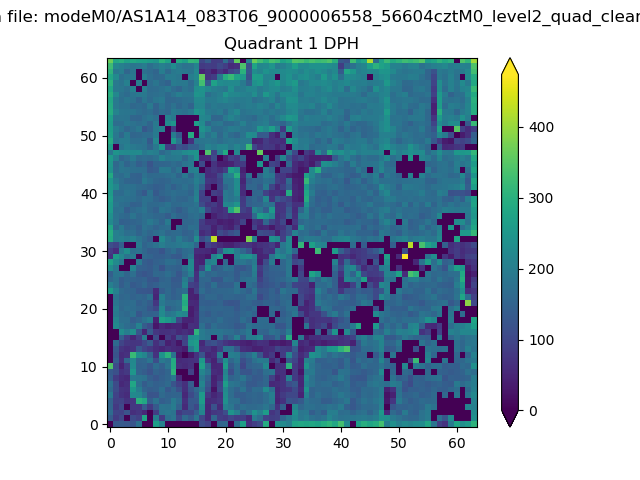 |
Quadrant B |
|---|---|---|---|
| Quadrant D | 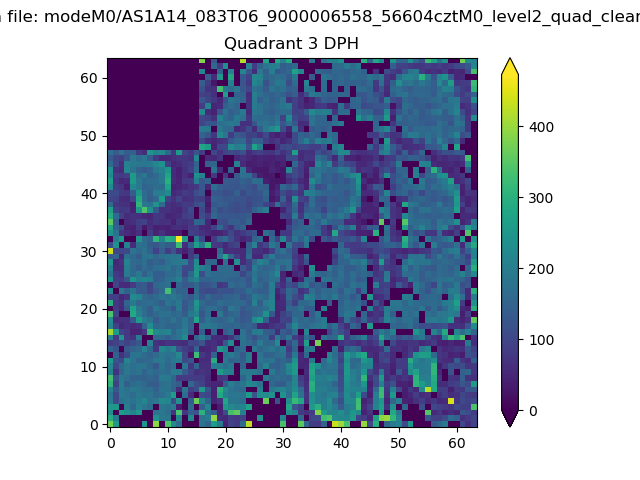 |
 |
Quadrant C |
| Plot type | Count rate plots | Images |
|---|---|---|
| Comparison with Poisson distribution Blue bars denote a histogram of data divided into 1 sec bins. Red curve is a Poisson curve with rate = median count rate of data. |
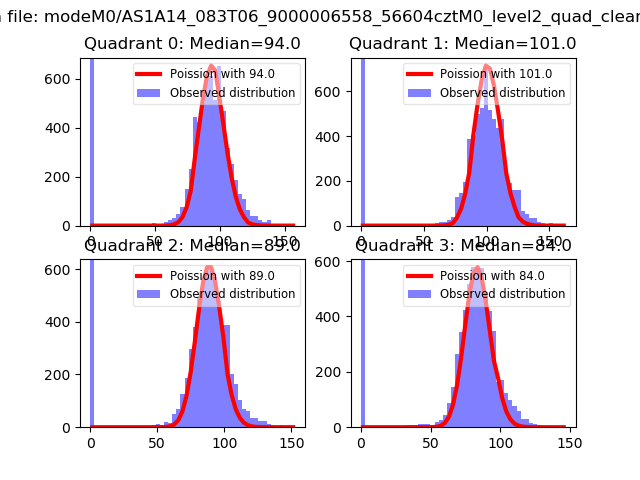 |
 |
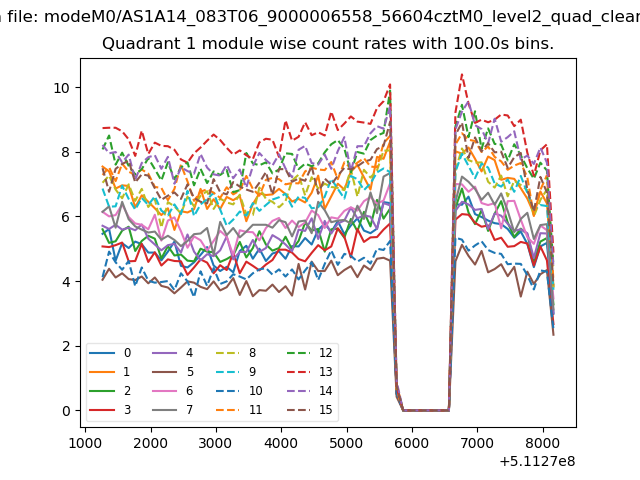
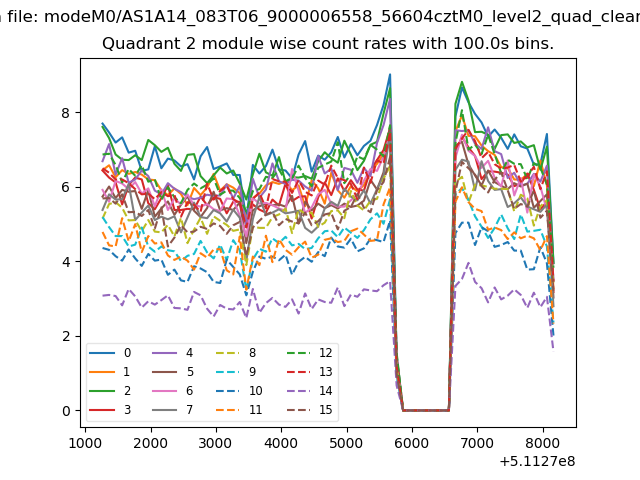
| Quadrant-wise count rates Data is divided into 100 sec bins |
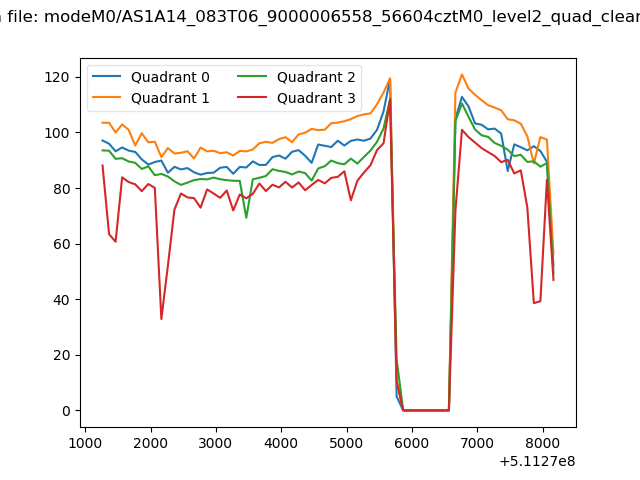 |
|
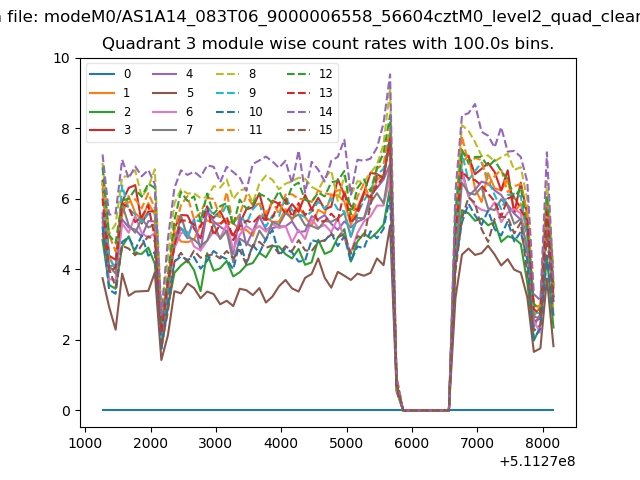
| Module-wise count rates for Quadrant A Data is divided into 100 sec bins |
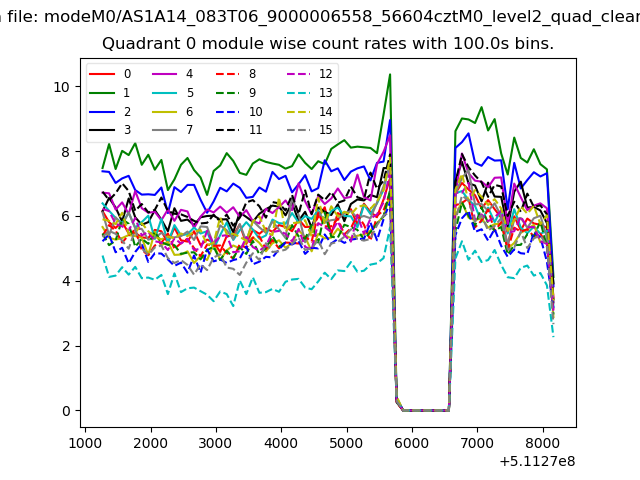 |
 |
| Module-wise count rates for Quadrant B Data is divided into 100 sec bins |
 |
 |
| Module-wise count rates for Quadrant C Data is divided into 100 sec bins |
 |
 |
| Module-wise count rates for Quadrant D Data is divided into 100 sec bins |
 |
 |
| Parameter | Plot |
|---|---|
| CZT HV Monitor | 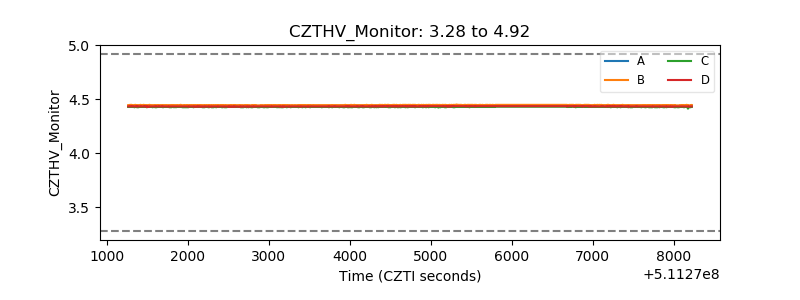 |
| D_VDD | 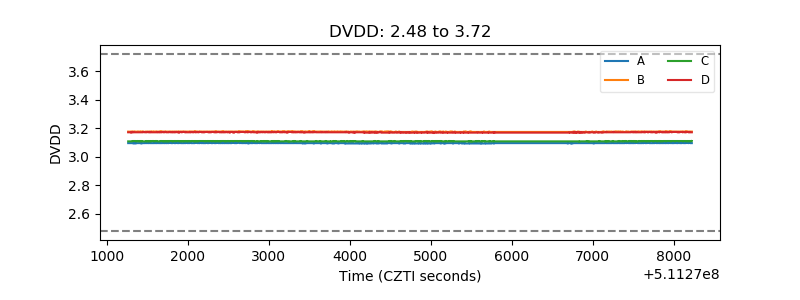 |
| Temperature 1 | 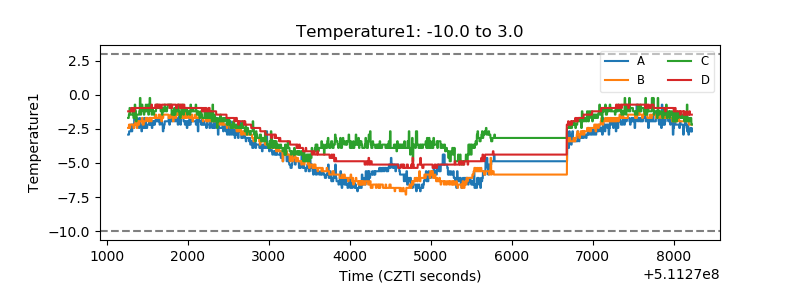 |
| Veto HV Monitor | 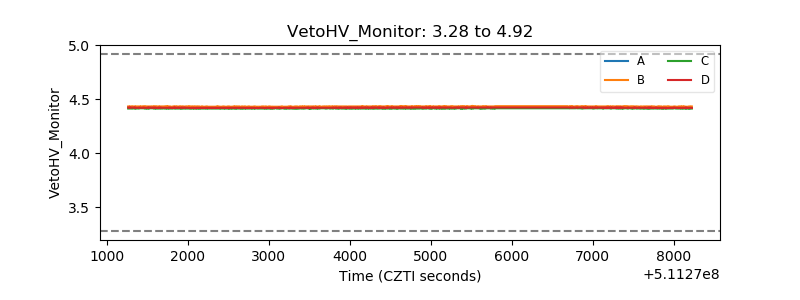 |
| Veto LLD | 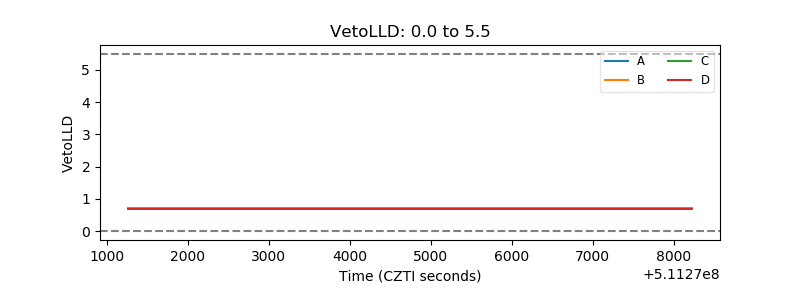 |
| Alpha Counter | 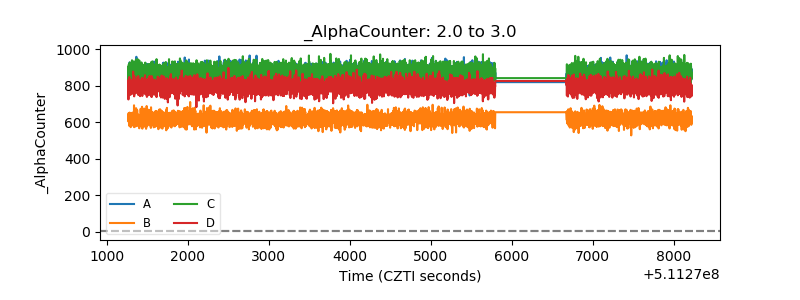 |
| _CPM_Rate | 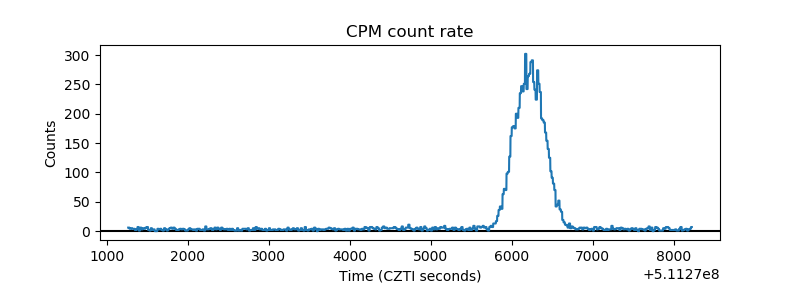 |
| CZT Counter | 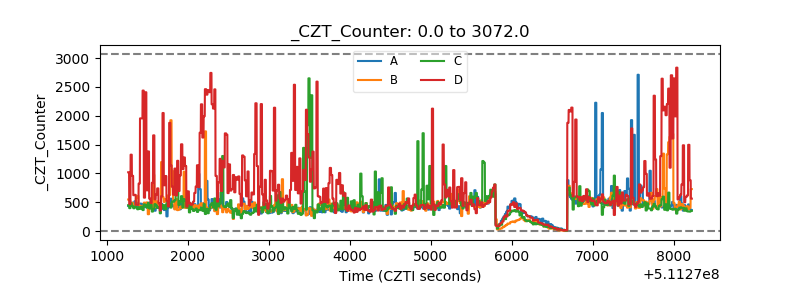 |
| +2.5 Volts monitor |  |
| +5 Volts monitor |  |
| _ROLL_ROT | 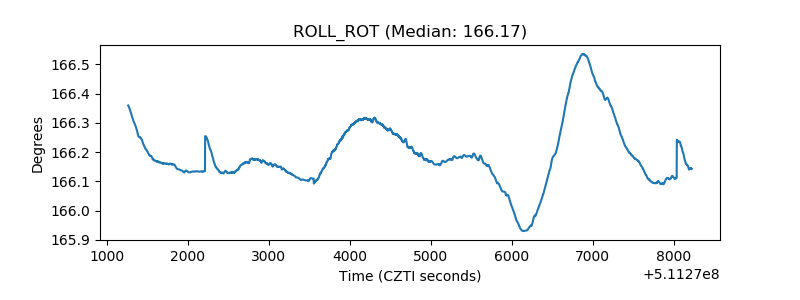 |
| _Roll_DEC | 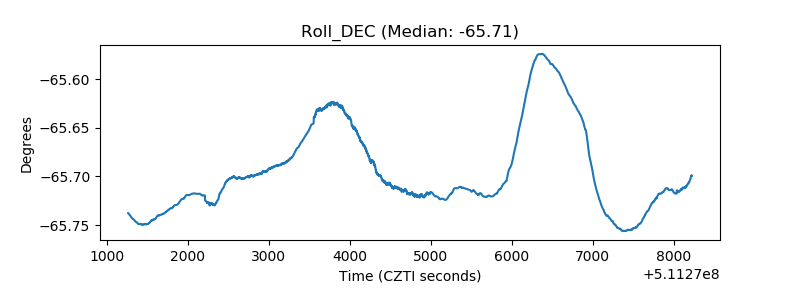 |
| _Roll_RA | 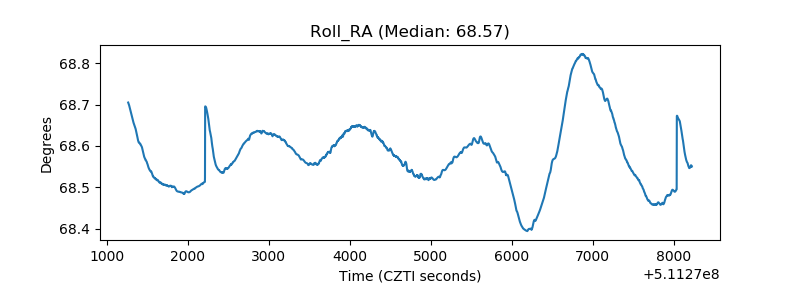 |
| Veto Counter | 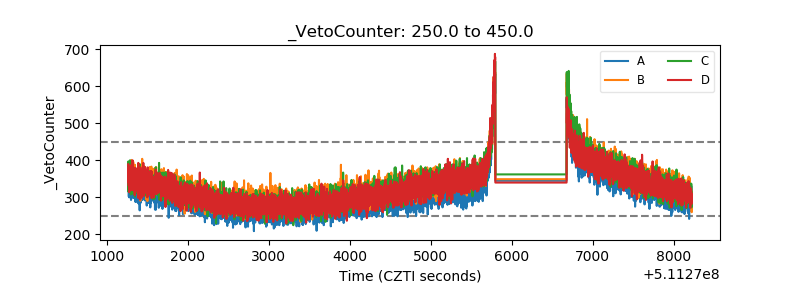 |