| Param | Original file | Final file |
|---|---|---|
| Filename | modeM0/AS1A14_083T06_9000006558_56606cztM0_level2.fits | modeM0/AS1A14_083T06_9000006558_56606cztM0_level2_quad_clean.evt |
| Size (bytes) | 418,049,280 | 95,950,080 |
| Size | 398.7 MB | 91.5 MB |
| Events in quadrant A | 3,087,844 | 633,022 |
| Events in quadrant B | 3,304,106 | 680,930 |
| Events in quadrant C | 3,038,292 | 603,692 |
| Events in quadrant D | 5,530,542 | 526,319 |
| Mode SS | |||
|---|---|---|---|
| Quadrant | BADHDUFLAG | Total packets | Discarded packets |
| A | 0 | 136 | 0 |
| B | 0 | 136 | 0 |
| C | 0 | 136 | 0 |
| D | 0 | 136 | 0 |
| Mode M9 | |||
|---|---|---|---|
| Quadrant | BADHDUFLAG | Total packets | Discarded packets |
| A | 0 | 10 | 0 |
| B | 0 | 10 | 0 |
| C | 0 | 10 | 0 |
| D | 0 | 10 | 0 |
| Mode M0 | |||
|---|---|---|---|
| Quadrant | BADHDUFLAG | Total packets | Discarded packets |
| A | 0 | 14173 | 1 |
| B | 0 | 14616 | 2 |
| C | 0 | 14070 | 1 |
| D | 0 | 20928 | 1 |
| Quadrant | Total seconds | Saturated seconds | Saturation percentage |
|---|---|---|---|
| A | 6609 | 65 | 0.983507% |
| B | 6608 | 73 | 1.104722% |
| C | 6608 | 26 | 0.393462% |
| D | 6609 | 600 | 9.078529% |
Noise dominated data is calculated using 1-second bins in cleaned event files. If a bin has >2000 counts, and if more than 50% of those come from <1% of pixels, then it is considered to be noise-dominated and hence unusable.
| Quadrant | # 1 sec bins | Bins with >0 counts | Bins with >2000 counts | High rate bins dominated by noise | Noise dominated (total time) | Noise dominated (detector-on time) | Marked lightcurve |
|---|---|---|---|---|---|---|---|
| A | 7634 | 6610 | 32 | 32 | 0.42% | 0.48% | 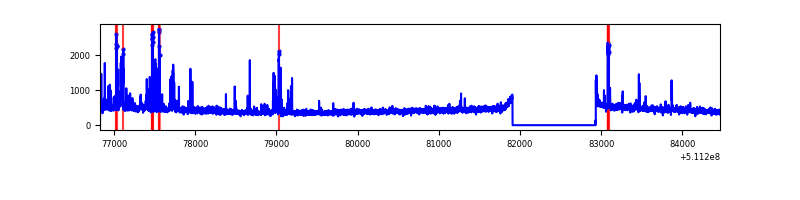 |
| B | 7633 | 6609 | 24 | 24 | 0.31% | 0.36% | 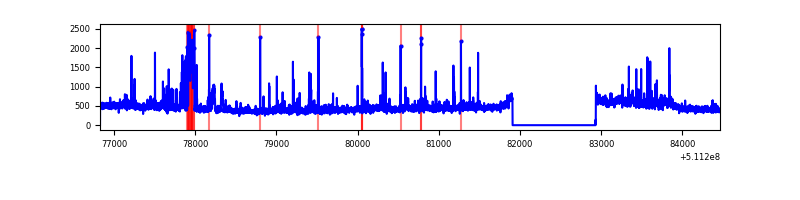 |
| C | 7633 | 6609 | 18 | 18 | 0.24% | 0.27% | 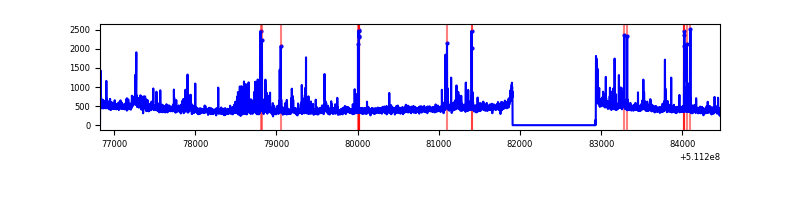 |
| D | 7634 | 6610 | 661 | 661 | 8.66% | 10.00% | 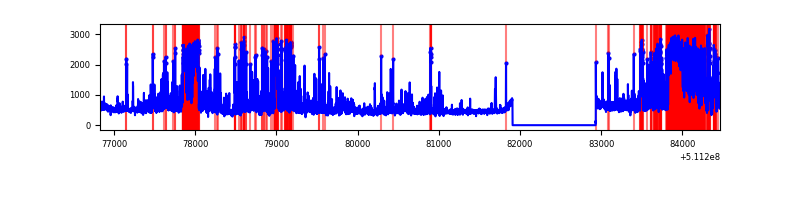 |
Top three noisy pixels from each quadrant. If the there are fewer than three noisy pixels in the level2.evt file, extra rows are filled as -1
| Pixel properties | Quadrant properties | ||||||
|---|---|---|---|---|---|---|---|
| Quadrant | DetID | PixID | Counts | Sigma | Mean | Median | Sigma |
| A | 13 | 248 | 145439 | 817.98 | 711 | 693 | 177.0 |
| A | 4 | 95 | 133190 | 748.76 | 711 | 693 | 177.0 |
| A | 7 | 64 | 16099 | 87.06 | 711 | 693 | 177.0 |
| B | 10 | 246 | 116609 | 762.11 | 704 | 679 | 152.1 |
| B | 0 | 63 | 94945 | 619.69 | 704 | 679 | 152.1 |
| B | 5 | 236 | 79837 | 520.37 | 704 | 679 | 152.1 |
| C | 13 | 3 | 114630 | 606.06 | 681 | 674 | 188.0 |
| C | 12 | 252 | 73979 | 389.86 | 681 | 674 | 188.0 |
| C | 14 | 254 | 73030 | 384.81 | 681 | 674 | 188.0 |
| D | 2 | 249 | 1083212 | 5808.52 | 657 | 627 | 186.4 |
| D | 13 | 153 | 451790 | 2420.68 | 657 | 627 | 186.4 |
| D | 6 | 239 | 384315 | 2058.64 | 657 | 627 | 186.4 |
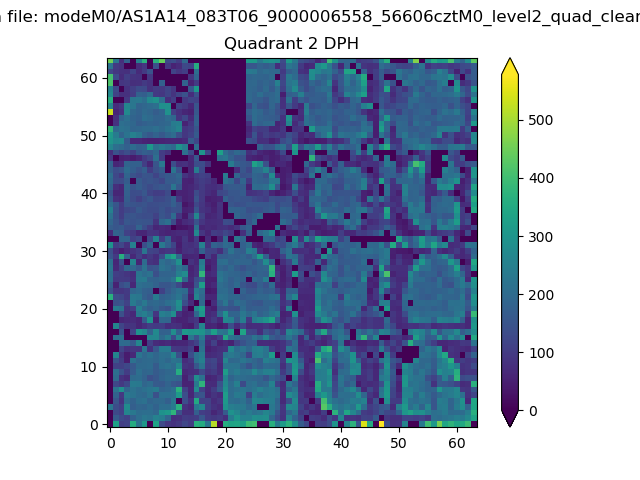
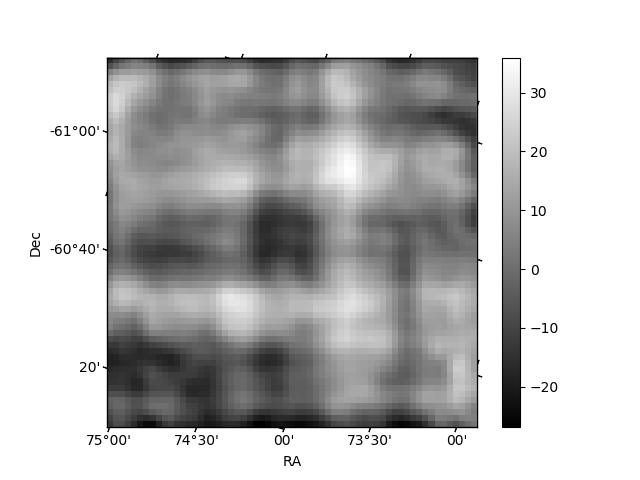
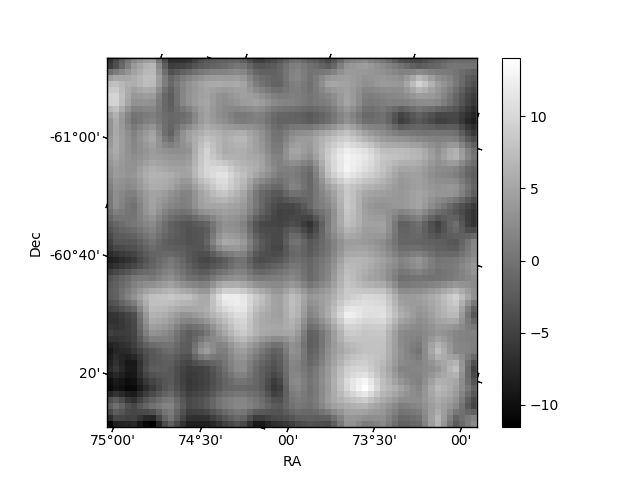
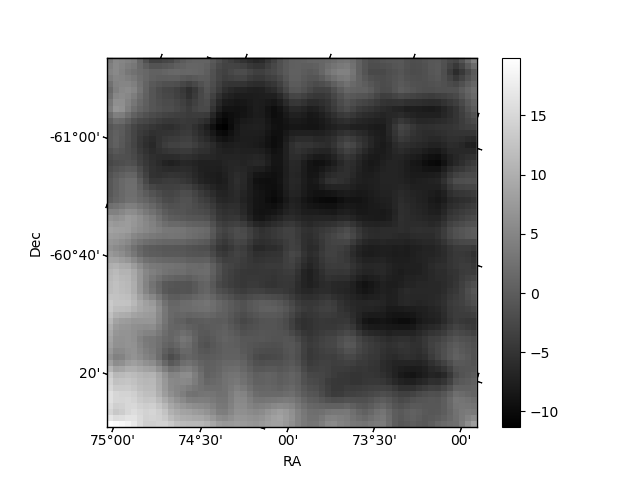
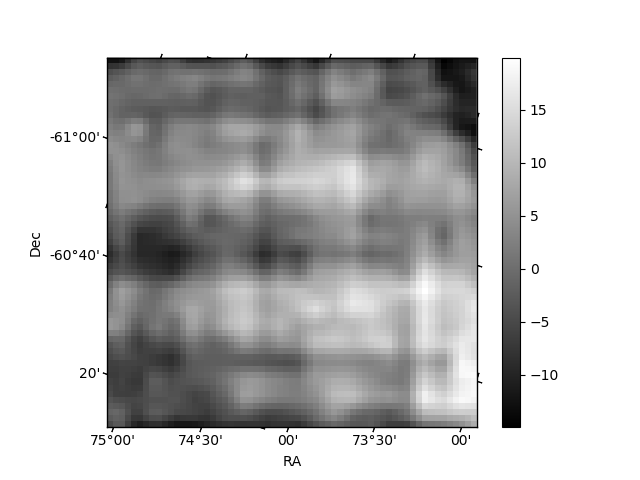
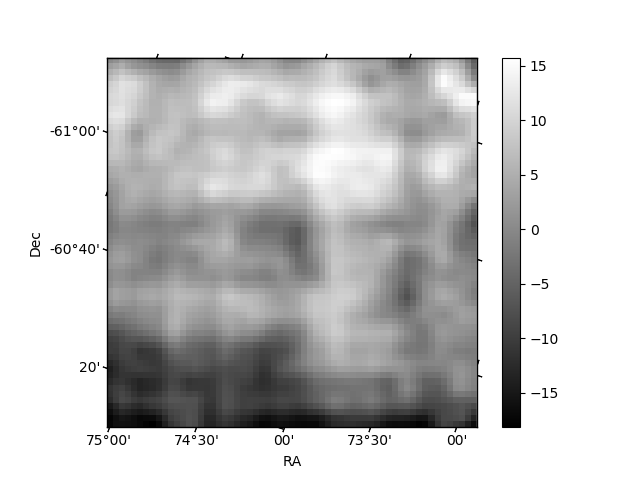
Histogram calculated using DETX and DETY for each event in the final _common_clean file
| Quadrant A | 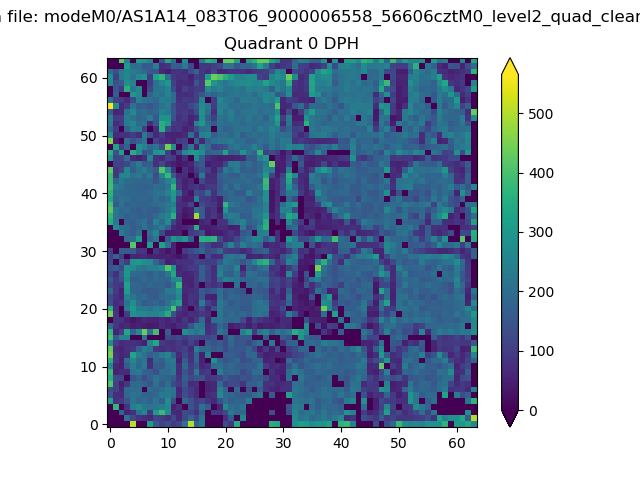 |
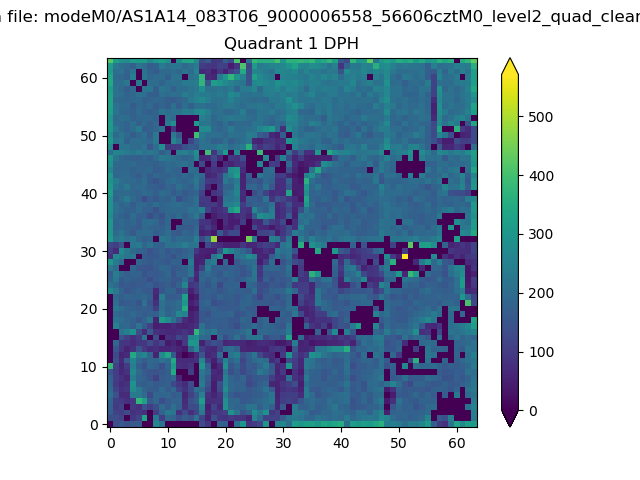 |
Quadrant B |
|---|---|---|---|
| Quadrant D | 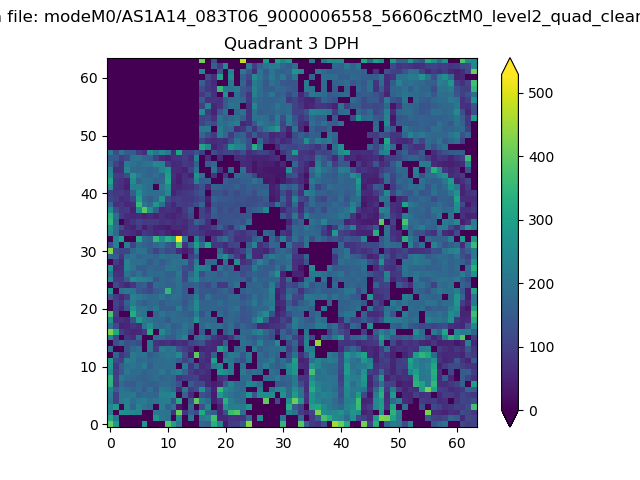 |
 |
Quadrant C |
| Plot type | Count rate plots | Images |
|---|---|---|
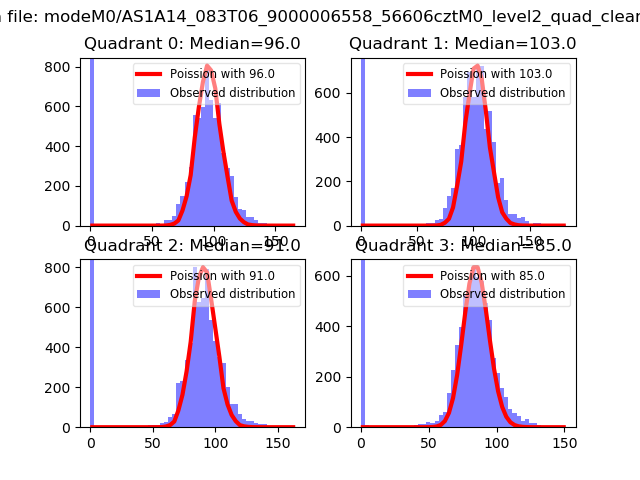
| Comparison with Poisson distribution Blue bars denote a histogram of data divided into 1 sec bins. Red curve is a Poisson curve with rate = median count rate of data. |
 |
 |
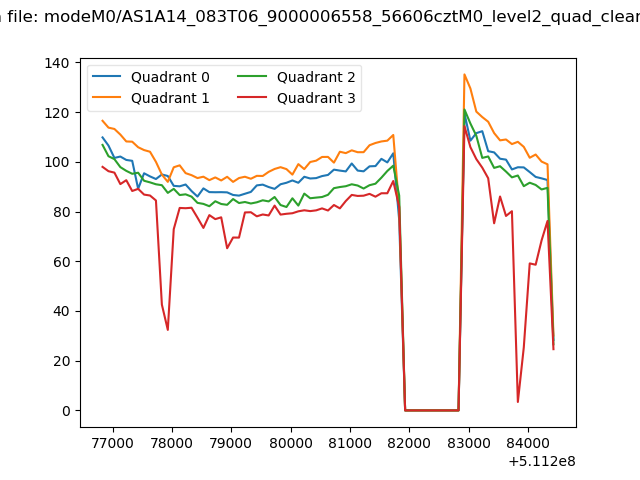
| Quadrant-wise count rates Data is divided into 100 sec bins |
 |
|
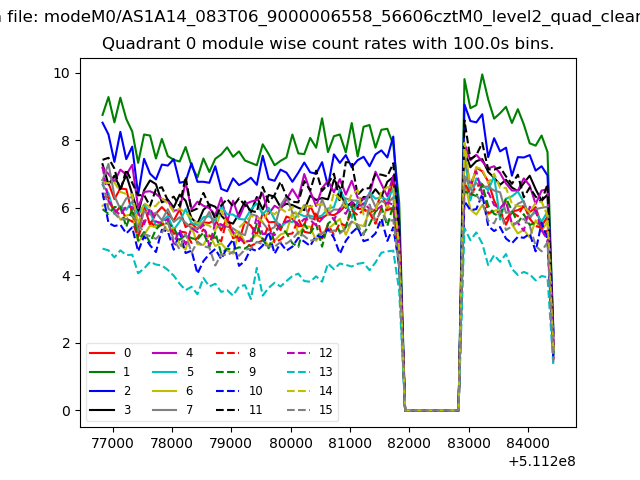
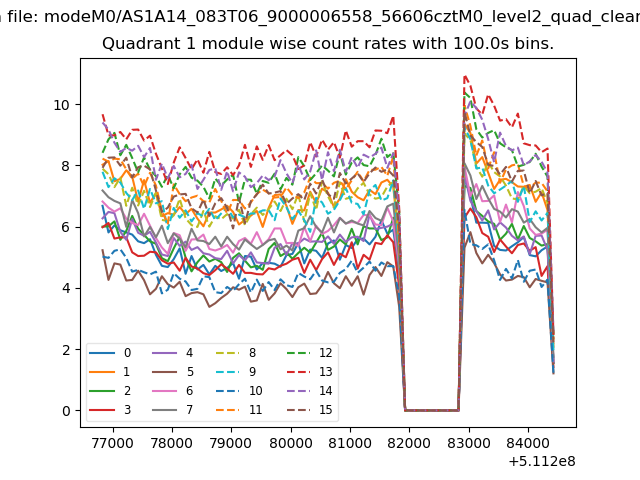
| Module-wise count rates for Quadrant A Data is divided into 100 sec bins |
 |
 |
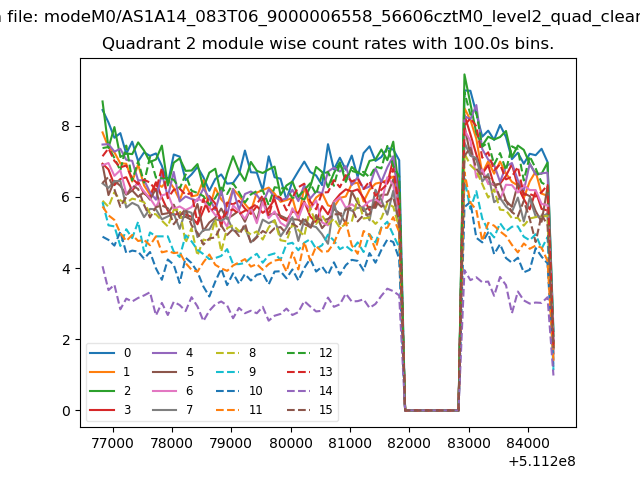
| Module-wise count rates for Quadrant B Data is divided into 100 sec bins |
 |
 |
| Module-wise count rates for Quadrant C Data is divided into 100 sec bins |
 |
 |
| Module-wise count rates for Quadrant D Data is divided into 100 sec bins |
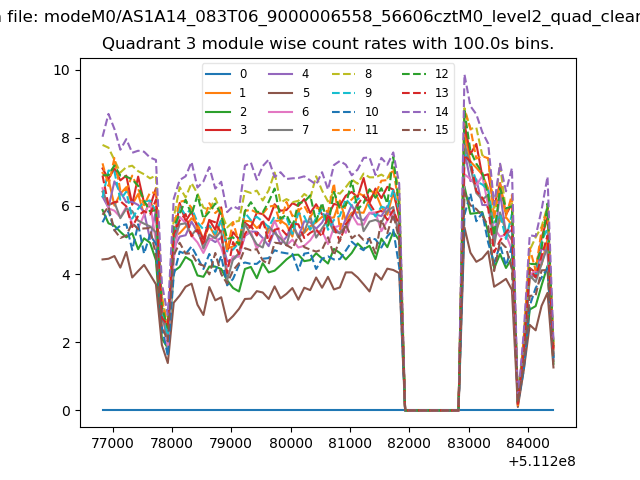 |
 |
| Parameter | Plot |
|---|---|
| CZT HV Monitor |  |
| D_VDD | 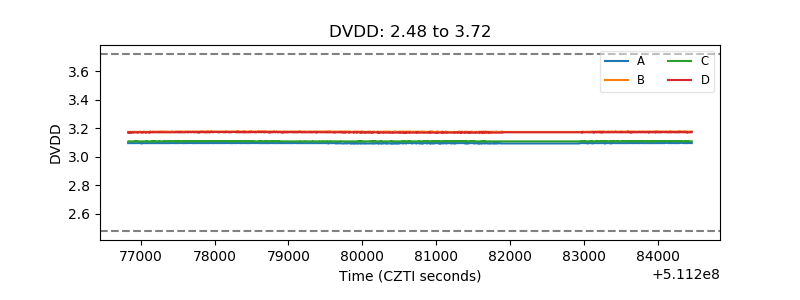 |
| Temperature 1 | 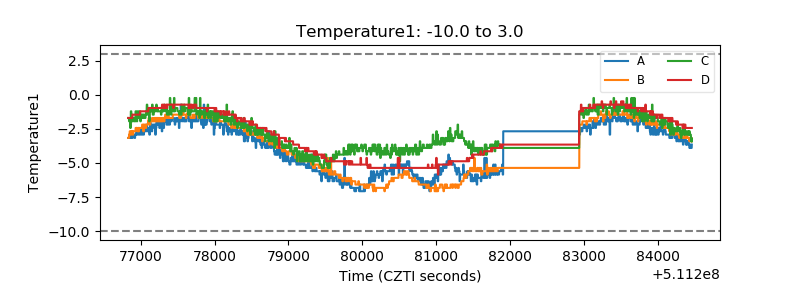 |
| Veto HV Monitor | 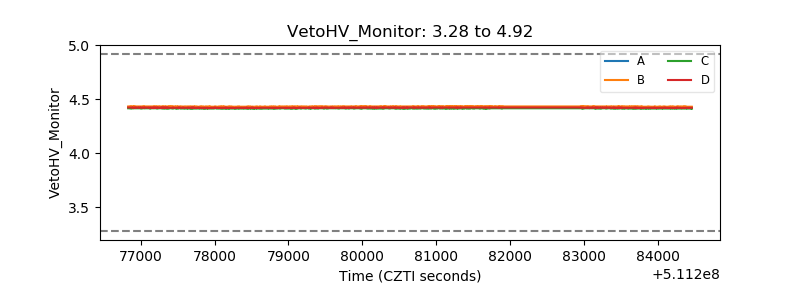 |
| Veto LLD | 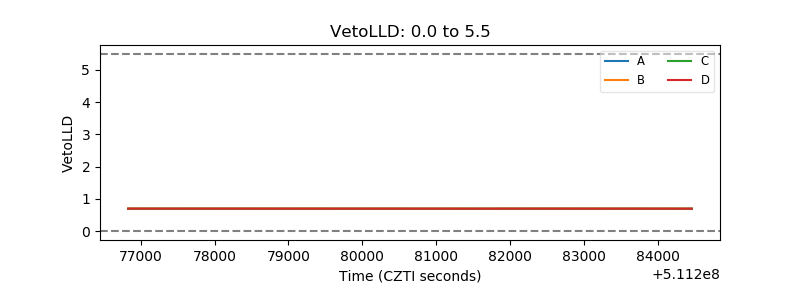 |
| Alpha Counter | 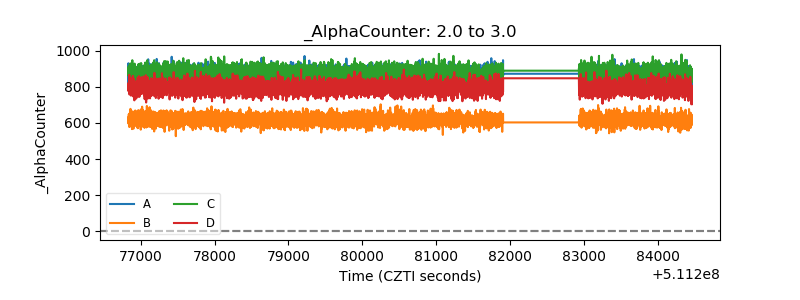 |
| _CPM_Rate | 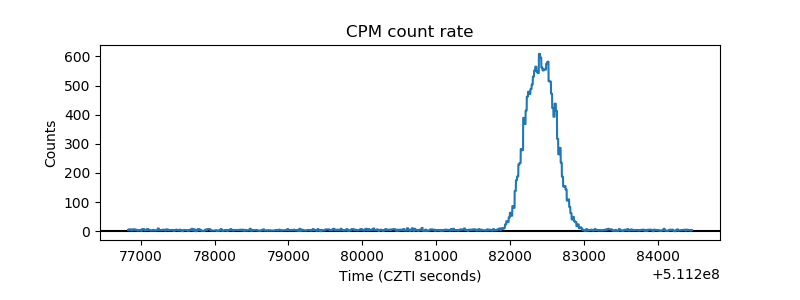 |
| CZT Counter | 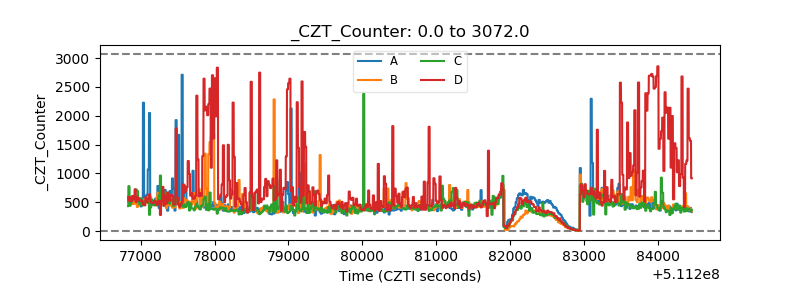 |
| +2.5 Volts monitor |  |
| +5 Volts monitor |  |
| _ROLL_ROT | 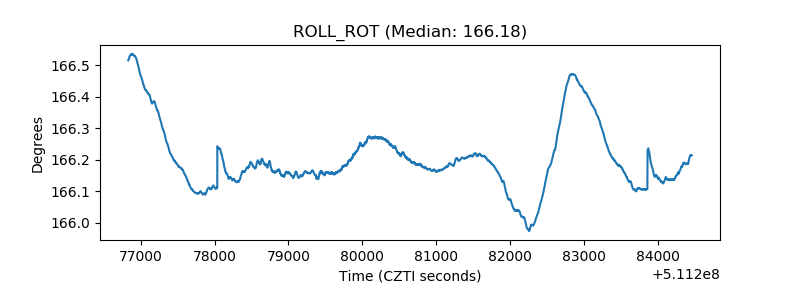 |
| _Roll_DEC | 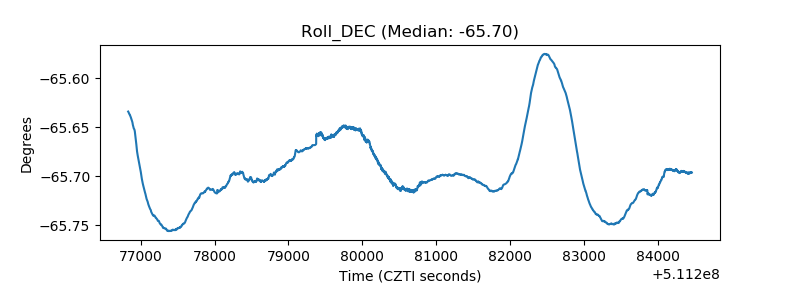 |
| _Roll_RA | 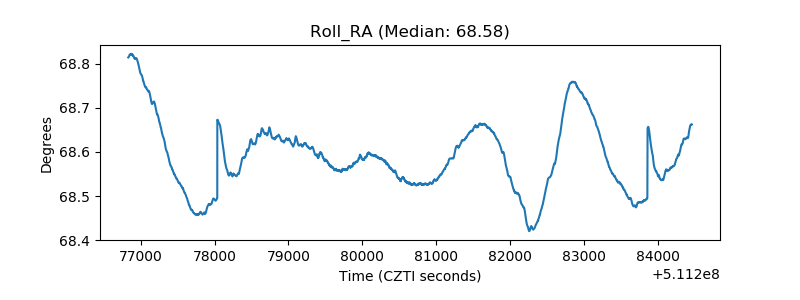 |
| Veto Counter | 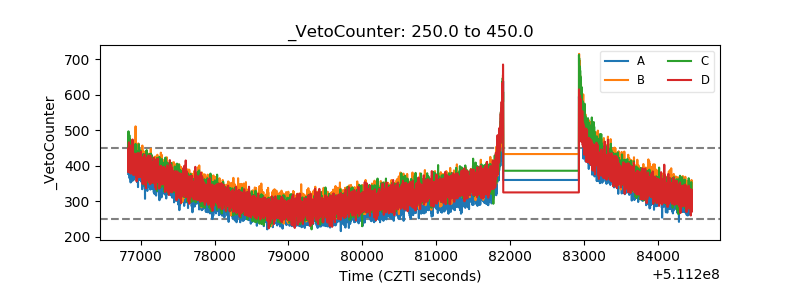 |