| Param | Original file | Final file |
|---|---|---|
| Filename | modeM0/AS1A14_083T06_9000006558_56608cztM0_level2.fits | modeM0/AS1A14_083T06_9000006558_56608cztM0_level2_quad_clean.evt |
| Size (bytes) | 437,515,200 | 94,907,520 |
| Size | 417.2 MB | 90.5 MB |
| Events in quadrant A | 3,032,845 | 636,260 |
| Events in quadrant B | 3,216,165 | 680,460 |
| Events in quadrant C | 4,586,449 | 581,278 |
| Events in quadrant D | 4,864,808 | 531,523 |
| Mode SS | |||
|---|---|---|---|
| Quadrant | BADHDUFLAG | Total packets | Discarded packets |
| A | 0 | 128 | 0 |
| B | 0 | 128 | 0 |
| C | 0 | 128 | 0 |
| D | 0 | 128 | 0 |
| Mode M9 | |||
|---|---|---|---|
| Quadrant | BADHDUFLAG | Total packets | Discarded packets |
| A | 0 | 15 | 0 |
| B | 0 | 15 | 0 |
| C | 0 | 16 | 0 |
| D | 0 | 16 | 0 |
| Mode M0 | |||
|---|---|---|---|
| Quadrant | BADHDUFLAG | Total packets | Discarded packets |
| A | 0 | 13748 | 2 |
| B | 0 | 14126 | 2 |
| C | 0 | 18240 | 2 |
| D | 0 | 18976 | 2 |
| Quadrant | Total seconds | Saturated seconds | Saturation percentage |
|---|---|---|---|
| A | 6371 | 82 | 1.287082% |
| B | 6371 | 119 | 1.867839% |
| C | 6371 | 288 | 4.520483% |
| D | 6371 | 455 | 7.141736% |
Noise dominated data is calculated using 1-second bins in cleaned event files. If a bin has >2000 counts, and if more than 50% of those come from <1% of pixels, then it is considered to be noise-dominated and hence unusable.
| Quadrant | # 1 sec bins | Bins with >0 counts | Bins with >2000 counts | High rate bins dominated by noise | Noise dominated (total time) | Noise dominated (detector-on time) | Marked lightcurve |
|---|---|---|---|---|---|---|---|
| A | 7531 | 6372 | 25 | 25 | 0.33% | 0.39% | 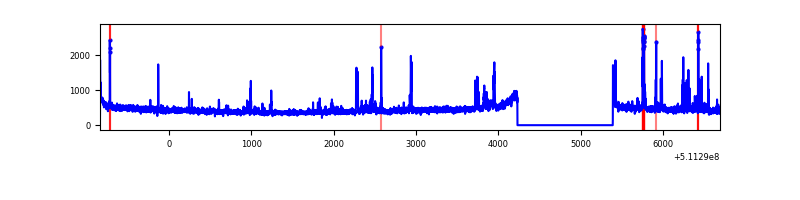 |
| B | 7531 | 6372 | 35 | 35 | 0.46% | 0.55% | 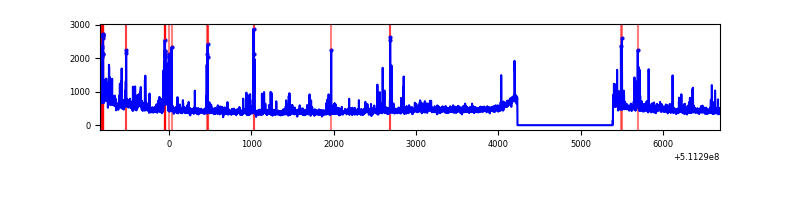 |
| C | 7531 | 6372 | 280 | 280 | 3.72% | 4.39% | 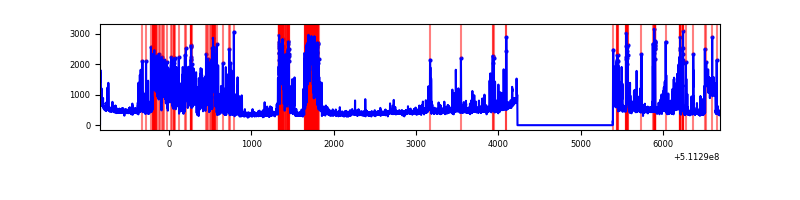 |
| D | 7531 | 6372 | 477 | 477 | 6.33% | 7.49% | 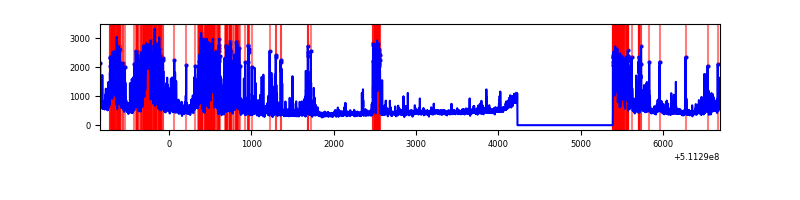 |
Top three noisy pixels from each quadrant. If the there are fewer than three noisy pixels in the level2.evt file, extra rows are filled as -1
| Pixel properties | Quadrant properties | ||||||
|---|---|---|---|---|---|---|---|
| Quadrant | DetID | PixID | Counts | Sigma | Mean | Median | Sigma |
| A | 4 | 95 | 187997 | 1079.45 | 699 | 681 | 173.5 |
| A | 0 | 8 | 45964 | 260.95 | 699 | 681 | 173.5 |
| A | 10 | 251 | 45698 | 259.42 | 699 | 681 | 173.5 |
| B | 10 | 246 | 153407 | 1042.31 | 693 | 670 | 146.5 |
| B | 10 | 247 | 74335 | 502.71 | 693 | 670 | 146.5 |
| B | 0 | 63 | 47436 | 319.14 | 693 | 670 | 146.5 |
| C | 15 | 230 | 561428 | 3112.08 | 659 | 653 | 180.2 |
| C | 15 | 215 | 524484 | 2907.05 | 659 | 653 | 180.2 |
| C | 13 | 3 | 494814 | 2742.39 | 659 | 653 | 180.2 |
| D | 2 | 249 | 1079782 | 5842.04 | 648 | 616 | 184.7 |
| D | 10 | 199 | 310363 | 1676.81 | 648 | 616 | 184.7 |
| D | 6 | 239 | 279256 | 1508.41 | 648 | 616 | 184.7 |
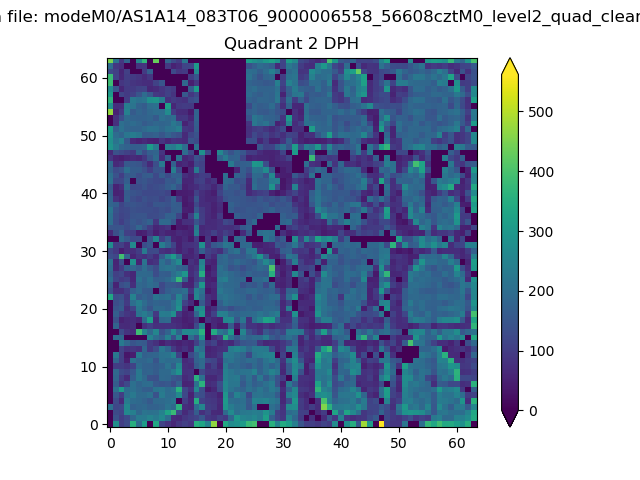
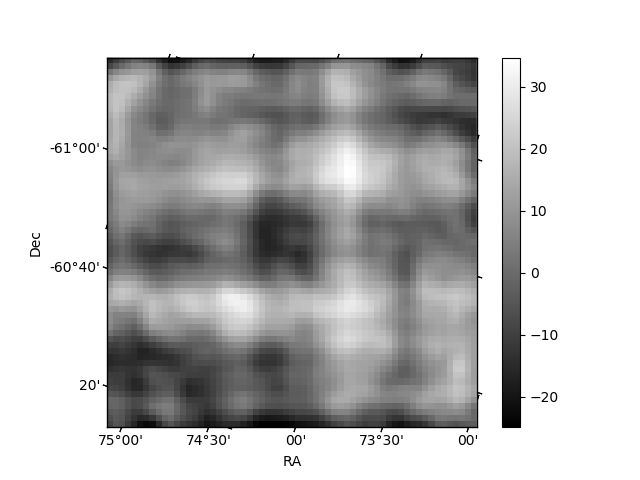
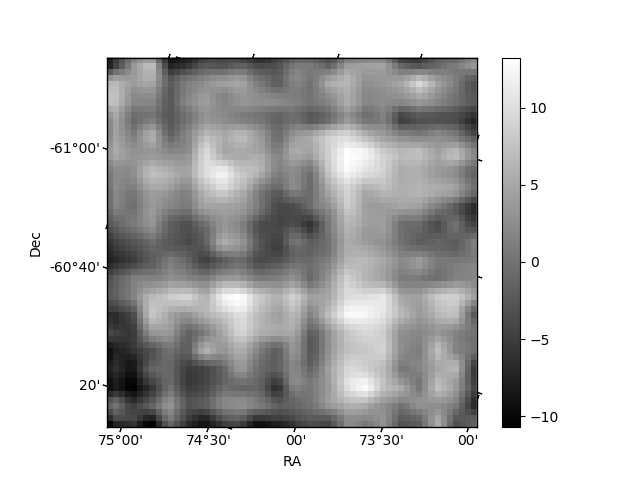
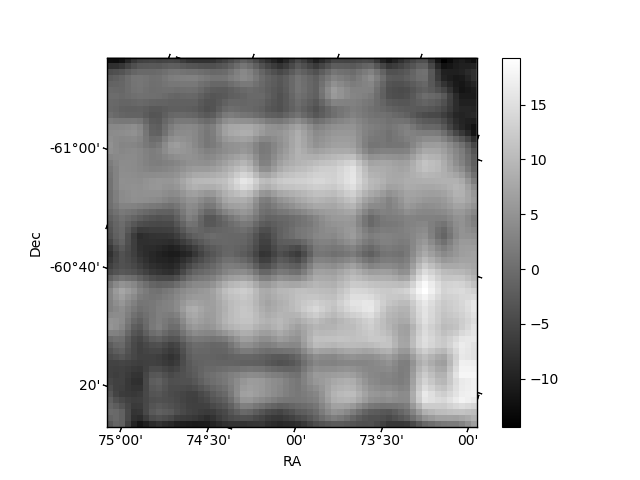
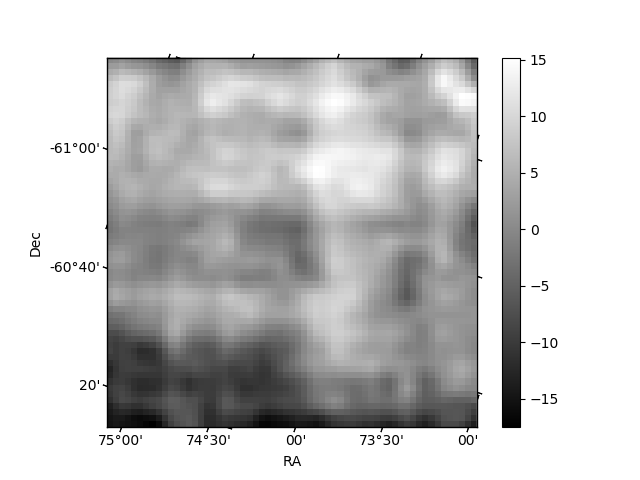
Histogram calculated using DETX and DETY for each event in the final _common_clean file
| Quadrant A | 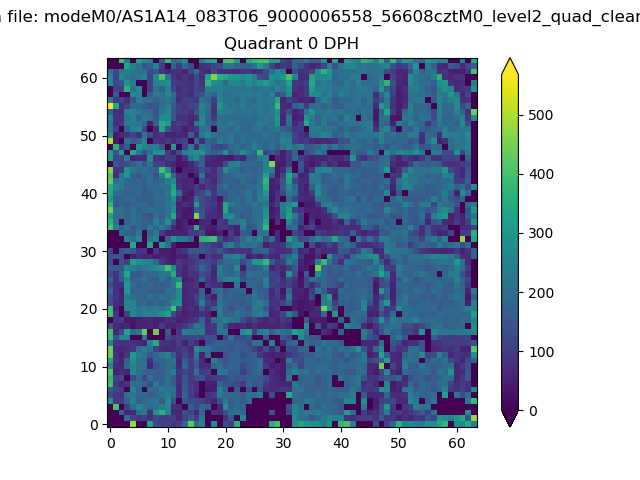 |
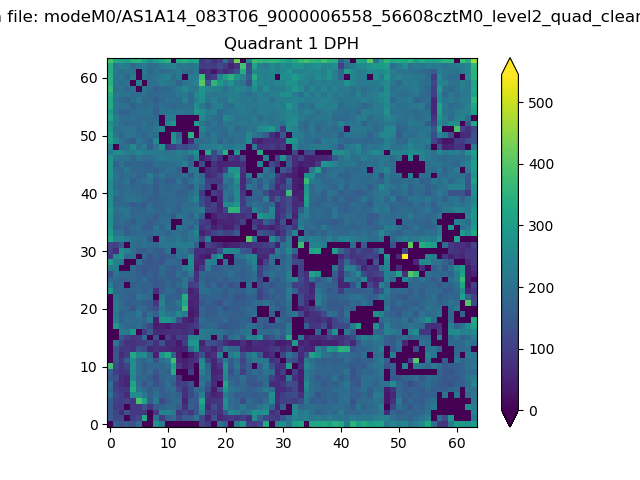 |
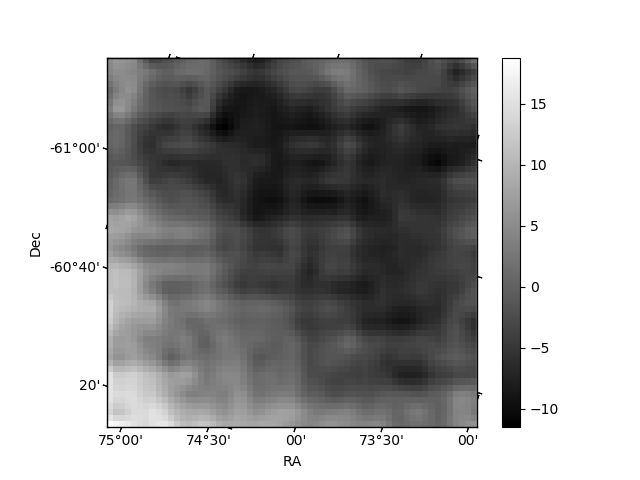
Quadrant B |
|---|---|---|---|
| Quadrant D | 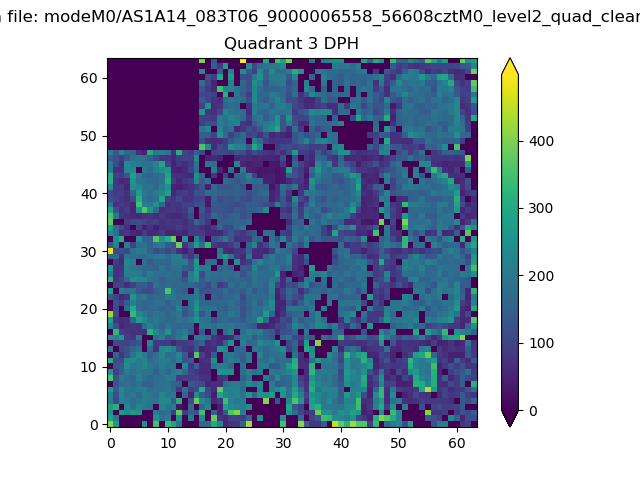 |
 |
Quadrant C |
| Plot type | Count rate plots | Images |
|---|---|---|
| Comparison with Poisson distribution Blue bars denote a histogram of data divided into 1 sec bins. Red curve is a Poisson curve with rate = median count rate of data. |
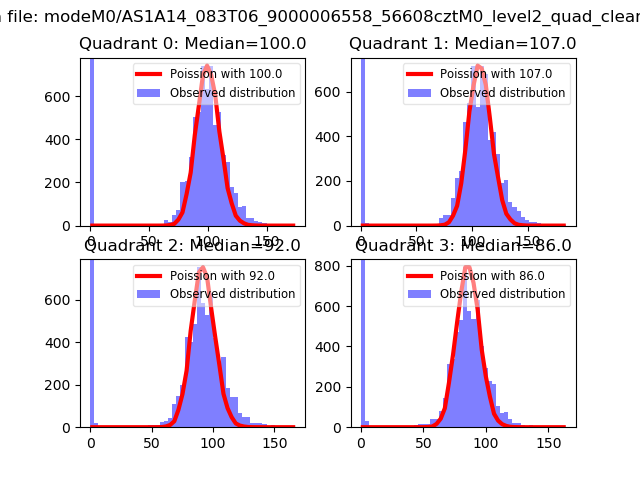 |
 |
| Quadrant-wise count rates Data is divided into 100 sec bins |
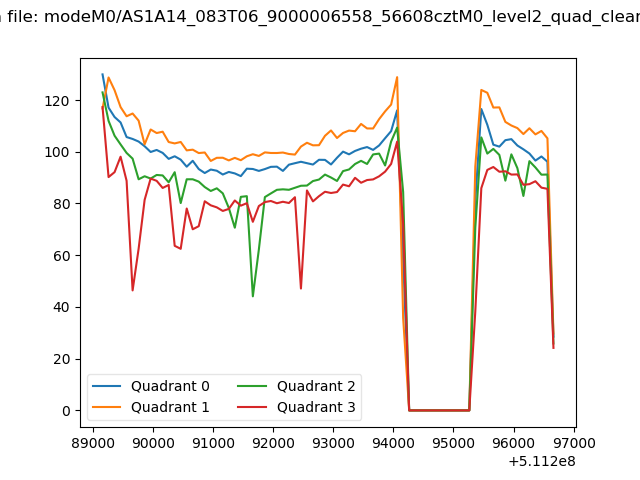 |
|
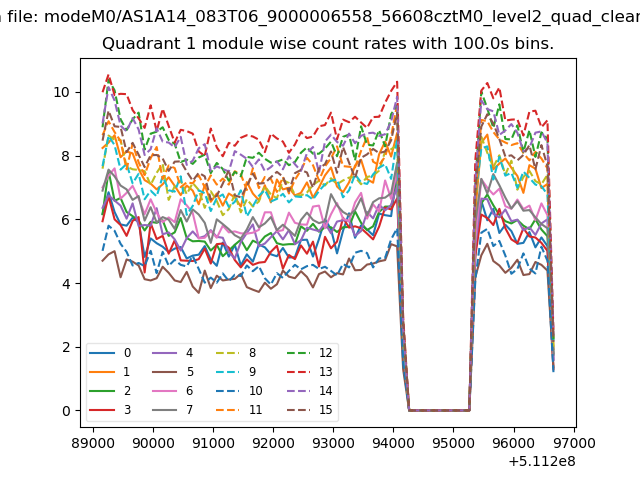
| Module-wise count rates for Quadrant A Data is divided into 100 sec bins |
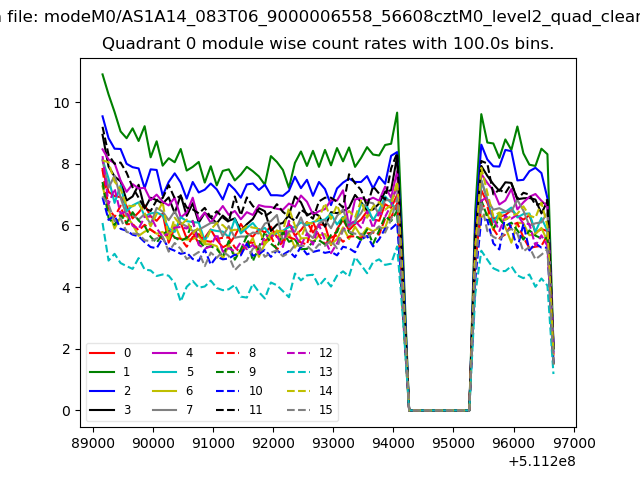 |
 |
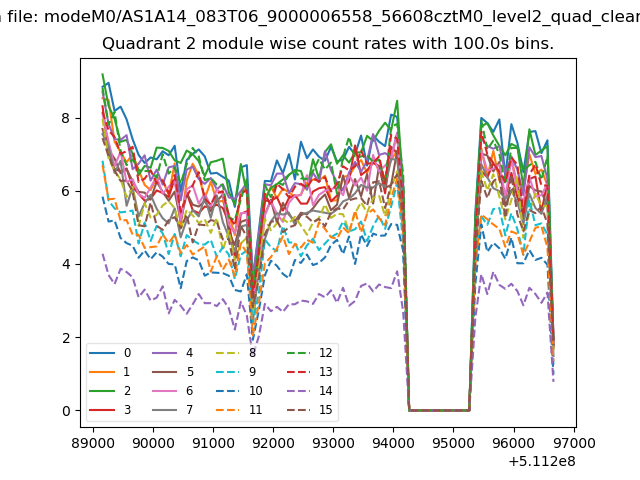
| Module-wise count rates for Quadrant B Data is divided into 100 sec bins |
 |
 |
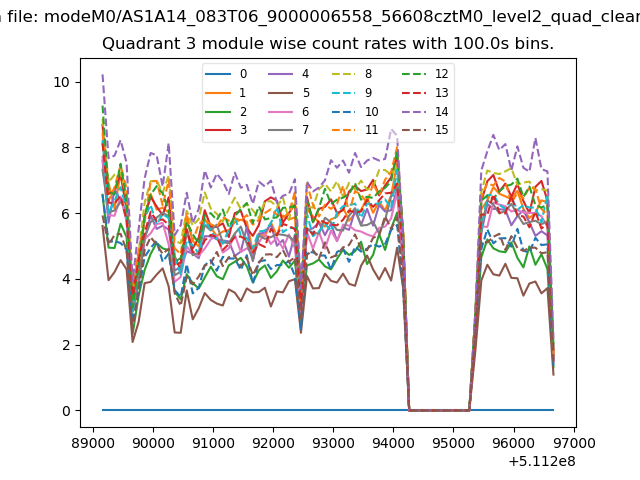
| Module-wise count rates for Quadrant C Data is divided into 100 sec bins |
 |
 |
| Module-wise count rates for Quadrant D Data is divided into 100 sec bins |
 |
 |
| Parameter | Plot |
|---|---|
| CZT HV Monitor | 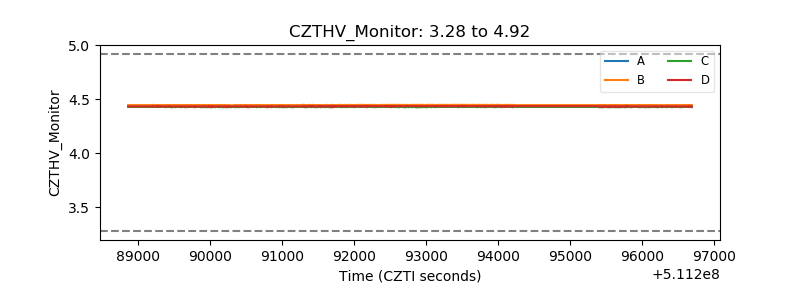 |
| D_VDD | 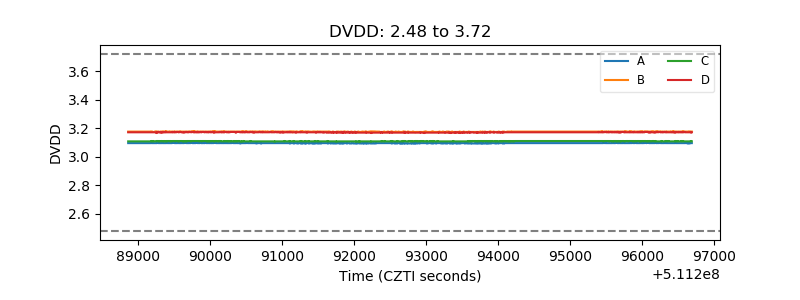 |
| Temperature 1 | 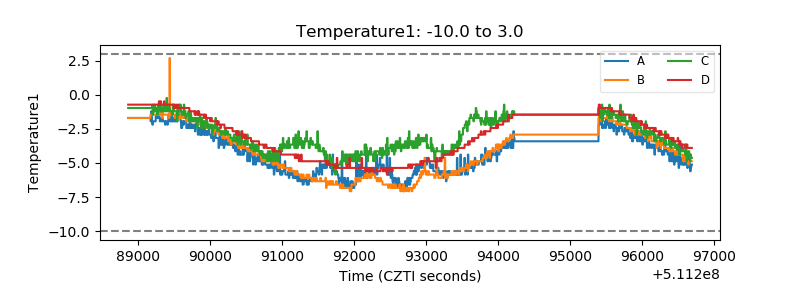 |
| Veto HV Monitor | 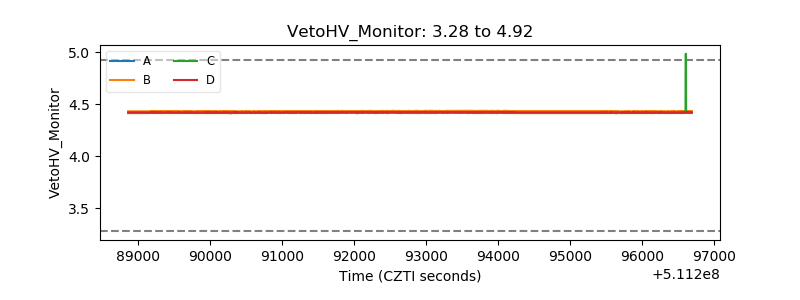 |
| Veto LLD | 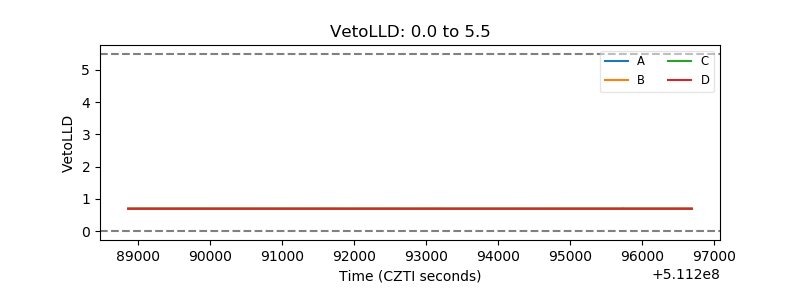 |
| Alpha Counter | 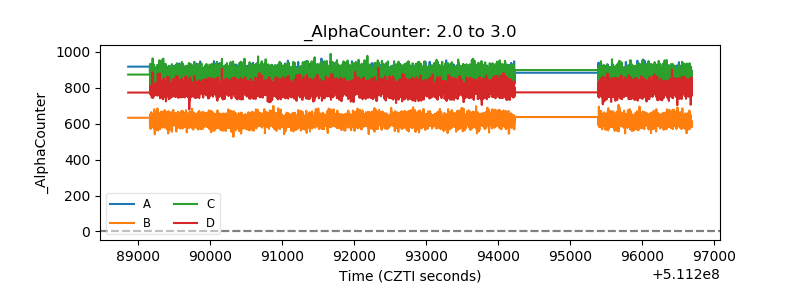 |
| _CPM_Rate | 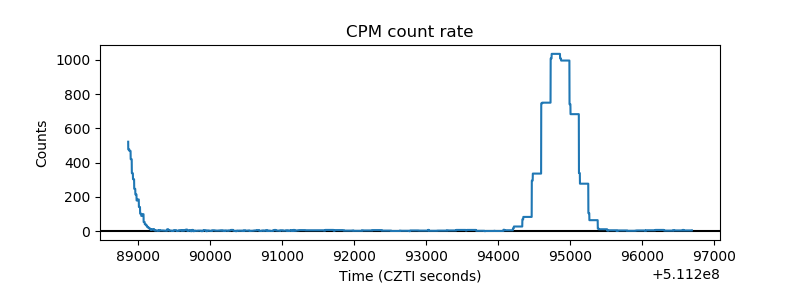 |
| CZT Counter | 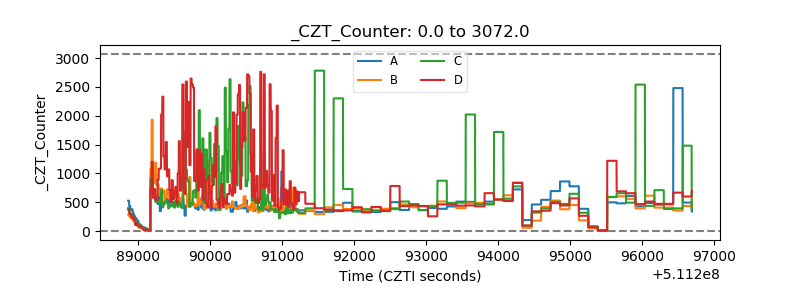 |
| +2.5 Volts monitor |  |
| +5 Volts monitor |  |
| _ROLL_ROT | 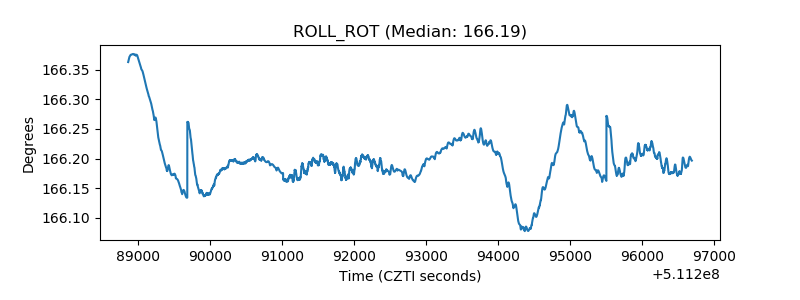 |
| _Roll_DEC | 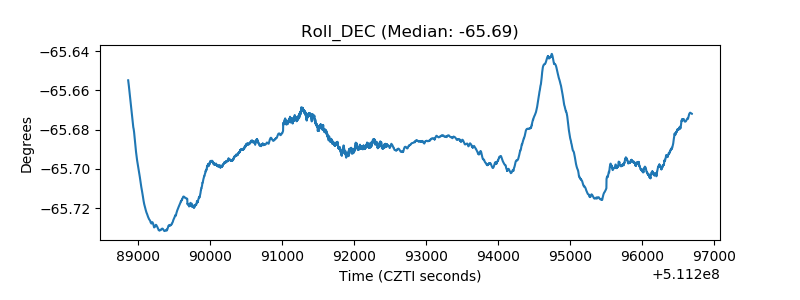 |
| _Roll_RA | 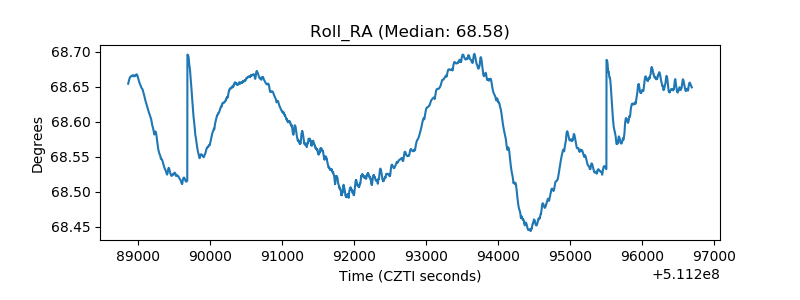 |
| Veto Counter | 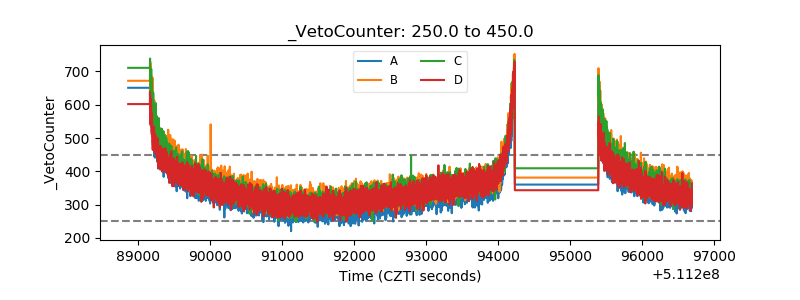 |