| Param | Original file | Final file |
|---|---|---|
| Filename | modeM0/AS1A14_083T06_9000006558_56609cztM0_level2.fits | modeM0/AS1A14_083T06_9000006558_56609cztM0_level2_quad_clean.evt |
| Size (bytes) | 400,118,400 | 93,286,080 |
| Size | 381.6 MB | 89.0 MB |
| Events in quadrant A | 2,915,053 | 625,927 |
| Events in quadrant B | 3,009,081 | 679,541 |
| Events in quadrant C | 4,693,134 | 538,642 |
| Events in quadrant D | 3,702,628 | 540,411 |
| Mode SS | |||
|---|---|---|---|
| Quadrant | BADHDUFLAG | Total packets | Discarded packets |
| A | 0 | 128 | 0 |
| B | 0 | 128 | 0 |
| C | 0 | 128 | 0 |
| D | 0 | 128 | 0 |
| Mode M9 | |||
|---|---|---|---|
| Quadrant | BADHDUFLAG | Total packets | Discarded packets |
| A | 0 | 12 | 0 |
| B | 0 | 12 | 0 |
| C | 0 | 13 | 0 |
| D | 0 | 13 | 0 |
| Mode M0 | |||
|---|---|---|---|
| Quadrant | BADHDUFLAG | Total packets | Discarded packets |
| A | 0 | 13413 | 2 |
| B | 0 | 13402 | 3 |
| C | 0 | 18625 | 2 |
| D | 0 | 15518 | 2 |
| Quadrant | Total seconds | Saturated seconds | Saturation percentage |
|---|---|---|---|
| A | 6308 | 55 | 0.871909% |
| B | 6307 | 43 | 0.681782% |
| C | 6307 | 616 | 9.766926% |
| D | 6307 | 138 | 2.188045% |
Noise dominated data is calculated using 1-second bins in cleaned event files. If a bin has >2000 counts, and if more than 50% of those come from <1% of pixels, then it is considered to be noise-dominated and hence unusable.
| Quadrant | # 1 sec bins | Bins with >0 counts | Bins with >2000 counts | High rate bins dominated by noise | Noise dominated (total time) | Noise dominated (detector-on time) | Marked lightcurve |
|---|---|---|---|---|---|---|---|
| A | 7508 | 6310 | 29 | 29 | 0.39% | 0.46% | 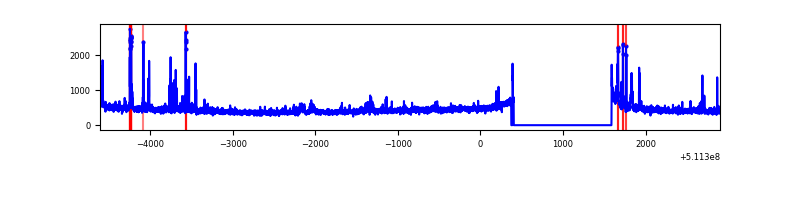 |
| B | 7507 | 6309 | 6 | 6 | 0.08% | 0.10% | 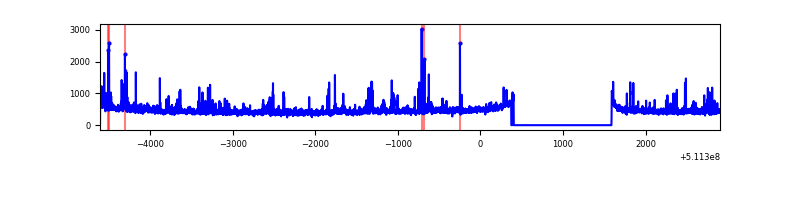 |
| C | 7507 | 6309 | 386 | 386 | 5.14% | 6.12% | 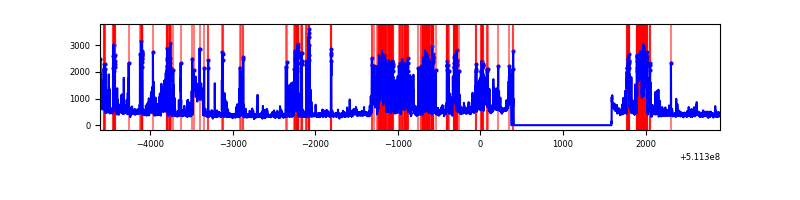 |
| D | 7507 | 6309 | 125 | 125 | 1.67% | 1.98% | 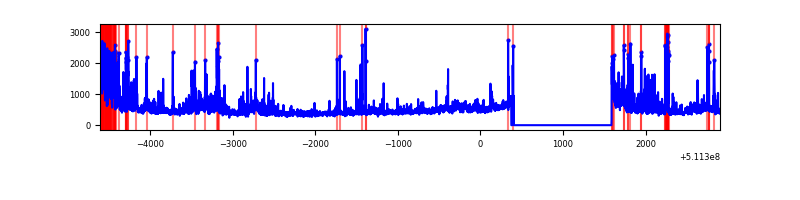 |
Top three noisy pixels from each quadrant. If the there are fewer than three noisy pixels in the level2.evt file, extra rows are filled as -1
| Pixel properties | Quadrant properties | ||||||
|---|---|---|---|---|---|---|---|
| Quadrant | DetID | PixID | Counts | Sigma | Mean | Median | Sigma |
| A | 4 | 95 | 70128 | 413.2 | 681 | 665 | 168.1 |
| A | 4 | 249 | 65909 | 388.1 | 681 | 665 | 168.1 |
| A | 10 | 251 | 34220 | 199.6 | 681 | 665 | 168.1 |
| B | 4 | 21 | 71651 | 500.76 | 679 | 656 | 141.8 |
| B | 10 | 247 | 65851 | 459.85 | 679 | 656 | 141.8 |
| B | 0 | 153 | 34292 | 237.25 | 679 | 656 | 141.8 |
| C | 15 | 219 | 954000 | 5512.35 | 628 | 622 | 173.0 |
| C | 13 | 3 | 417117 | 2408.14 | 628 | 622 | 173.0 |
| C | 15 | 230 | 330739 | 1908.71 | 628 | 622 | 173.0 |
| D | 10 | 199 | 315719 | 1744.14 | 641 | 611 | 180.7 |
| D | 2 | 249 | 224837 | 1241.1 | 641 | 611 | 180.7 |
| D | 6 | 239 | 206951 | 1142.1 | 641 | 611 | 180.7 |
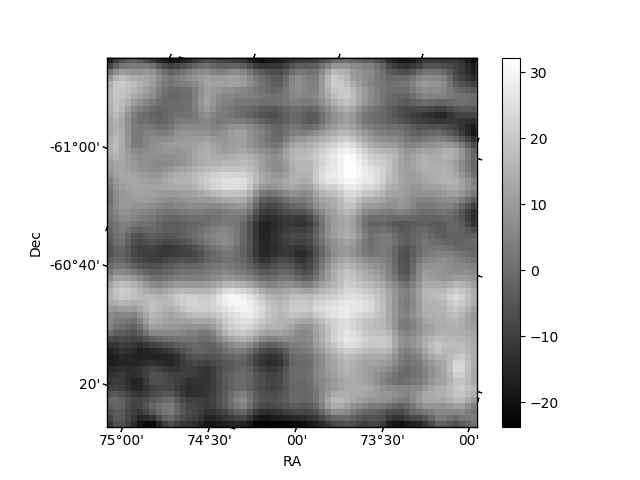
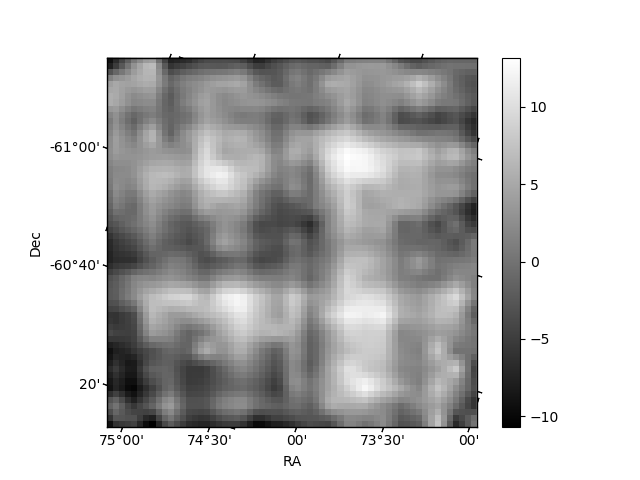
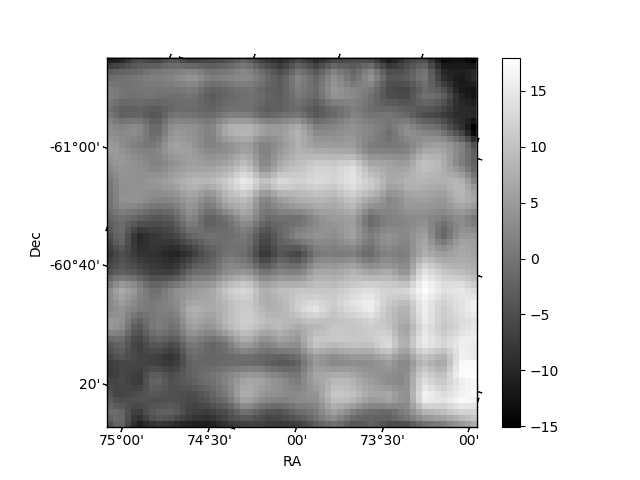
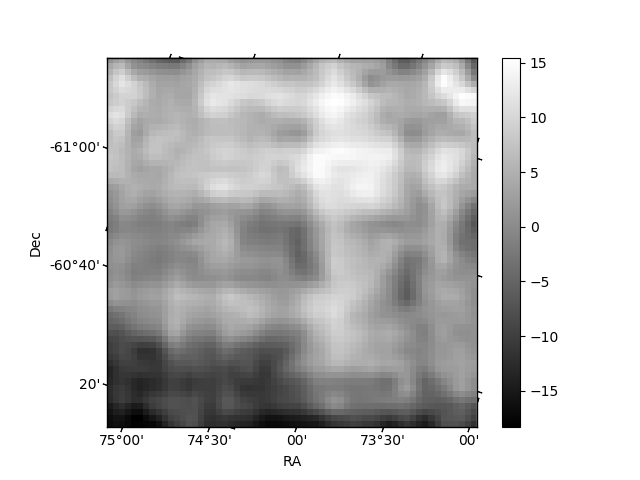
Histogram calculated using DETX and DETY for each event in the final _common_clean file
| Quadrant A | 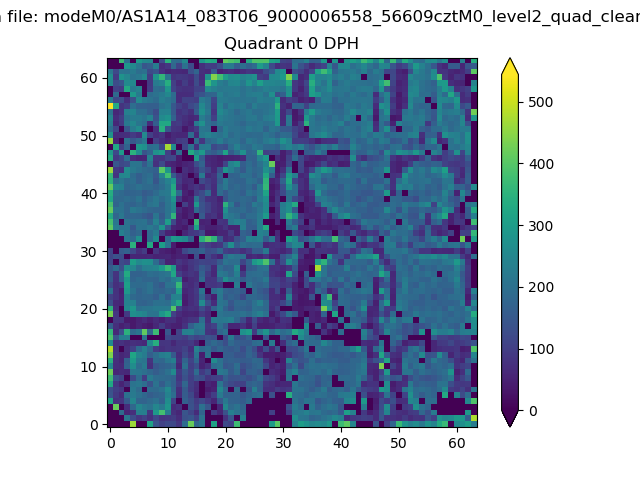 |
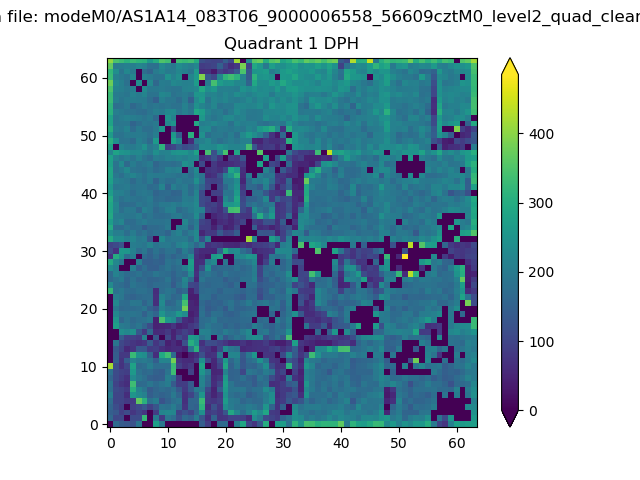 |
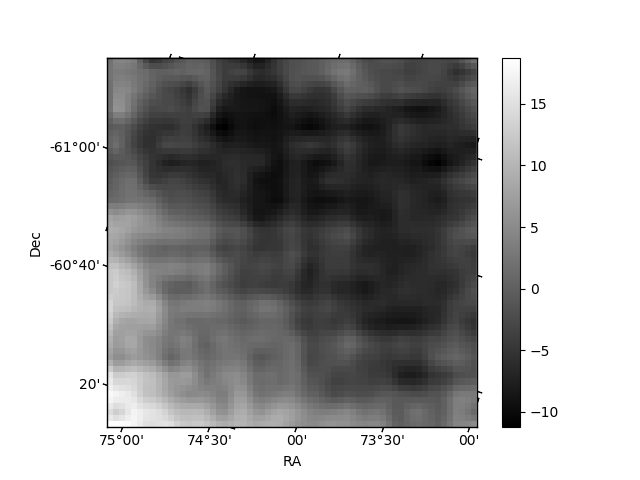
Quadrant B |
|---|---|---|---|
| Quadrant D | 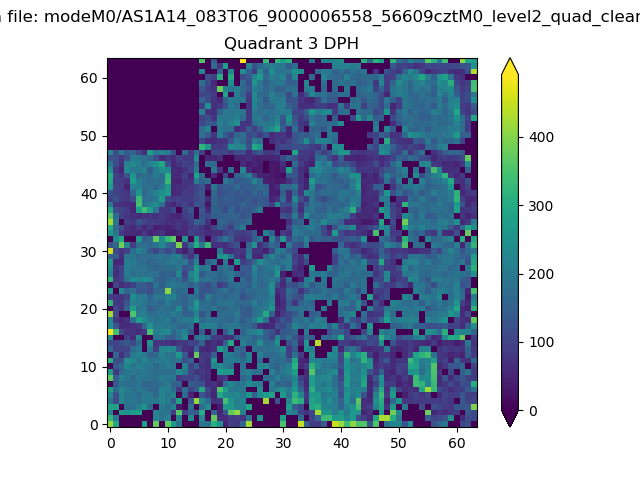 |
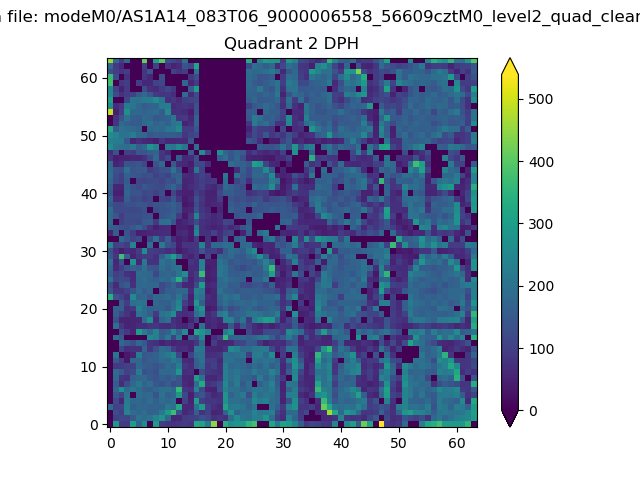 |
Quadrant C |
| Plot type | Count rate plots | Images |
|---|---|---|
| Comparison with Poisson distribution Blue bars denote a histogram of data divided into 1 sec bins. Red curve is a Poisson curve with rate = median count rate of data. |
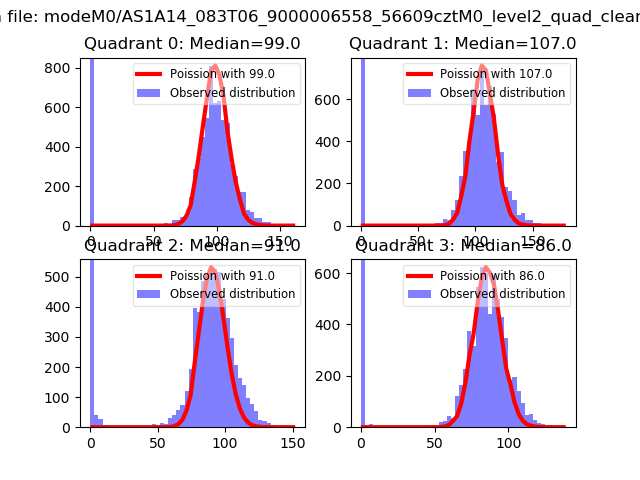 |
 |
| Quadrant-wise count rates Data is divided into 100 sec bins |
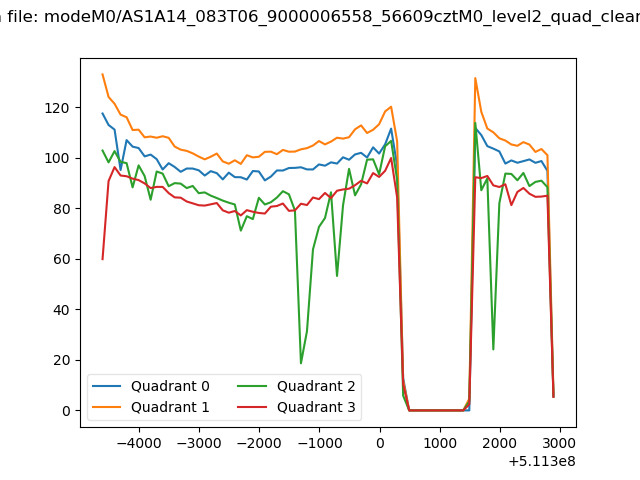 |
|
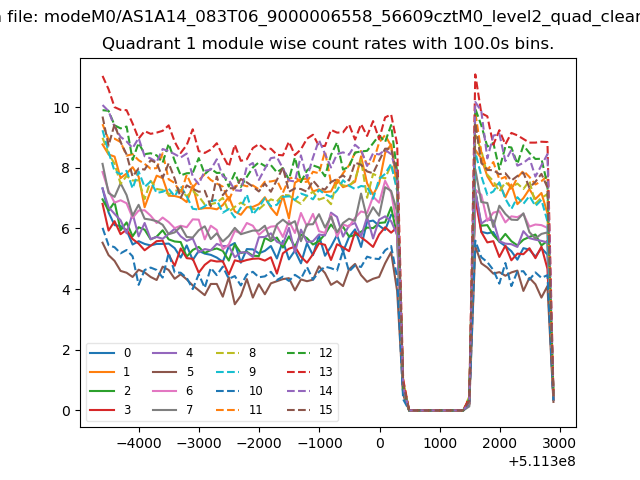
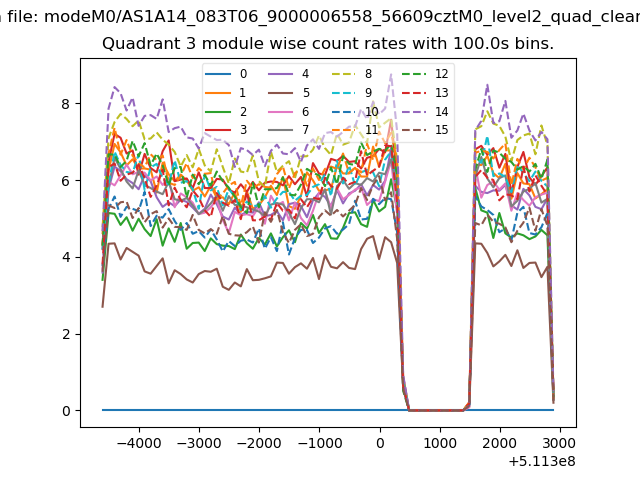
| Module-wise count rates for Quadrant A Data is divided into 100 sec bins |
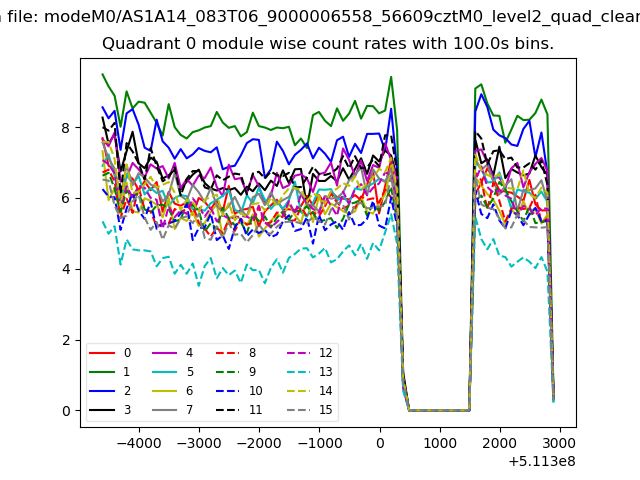 |
 |
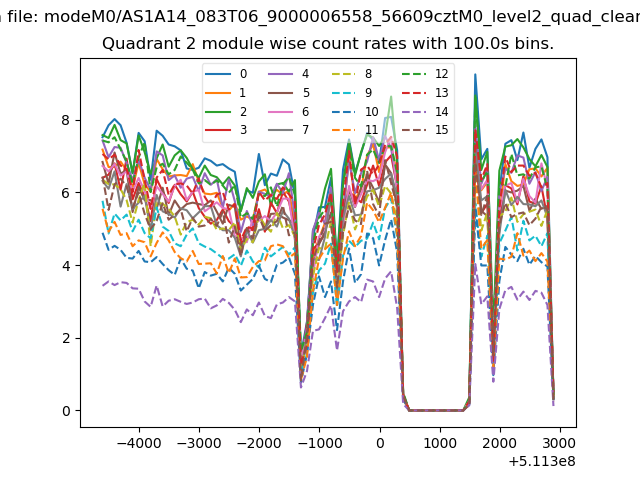
| Module-wise count rates for Quadrant B Data is divided into 100 sec bins |
 |
 |
| Module-wise count rates for Quadrant C Data is divided into 100 sec bins |
 |
 |
| Module-wise count rates for Quadrant D Data is divided into 100 sec bins |
 |
 |
| Parameter | Plot |
|---|---|
| CZT HV Monitor | 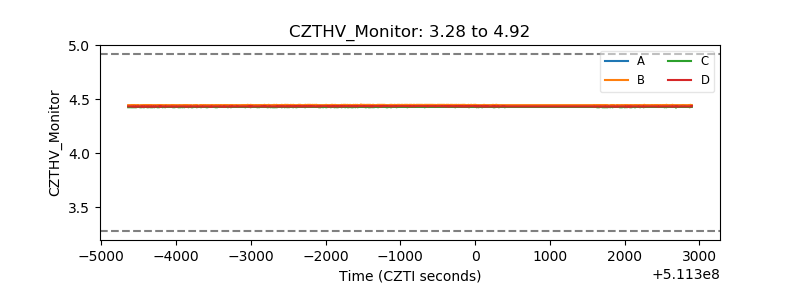 |
| D_VDD | 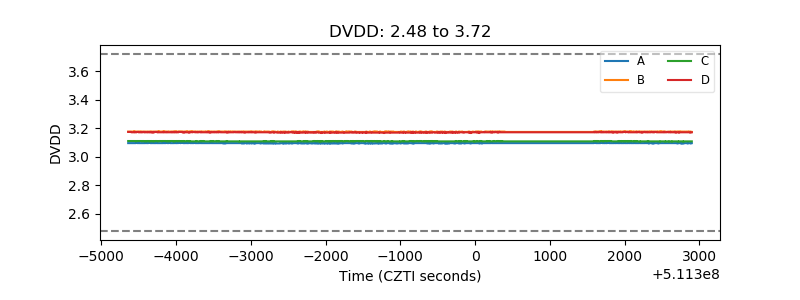 |
| Temperature 1 | 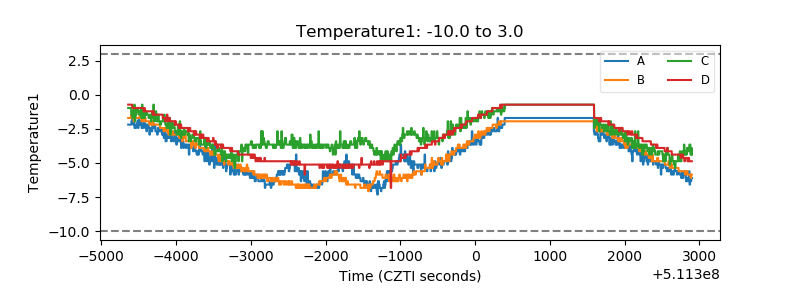 |
| Veto HV Monitor | 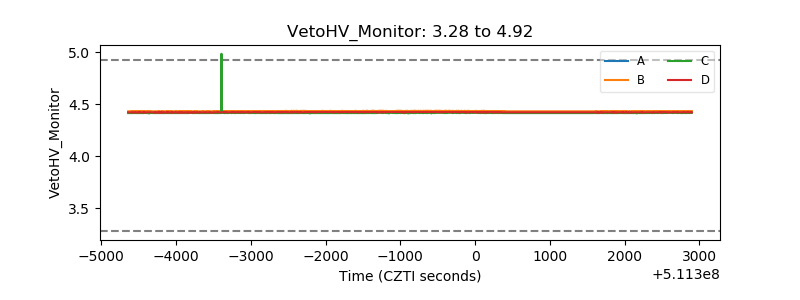 |
| Veto LLD | 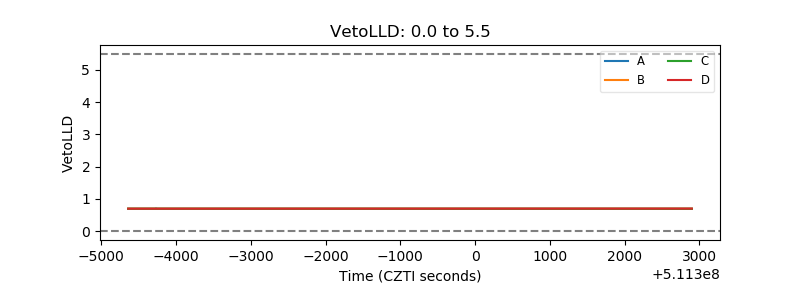 |
| Alpha Counter | 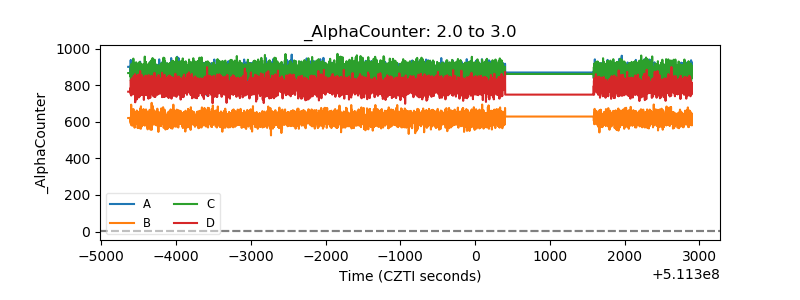 |
| _CPM_Rate | 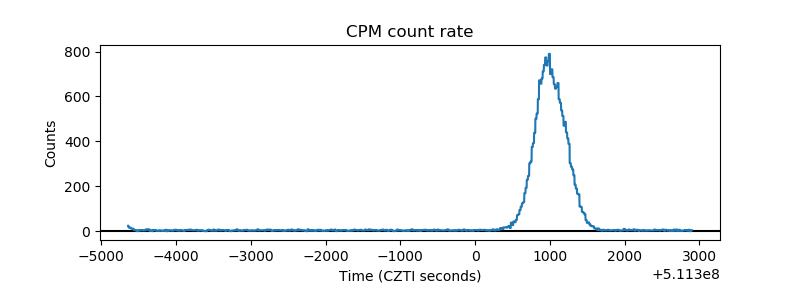 |
| CZT Counter | 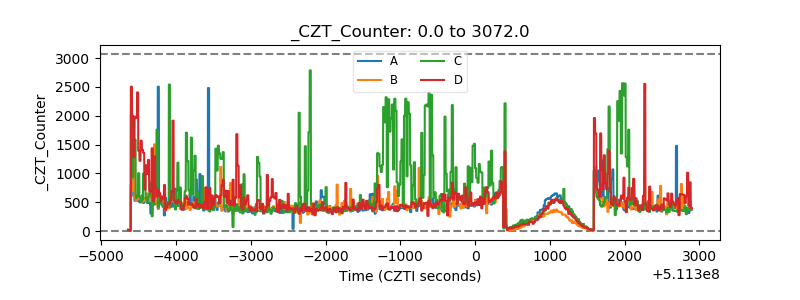 |
| +2.5 Volts monitor |  |
| +5 Volts monitor |  |
| _ROLL_ROT | 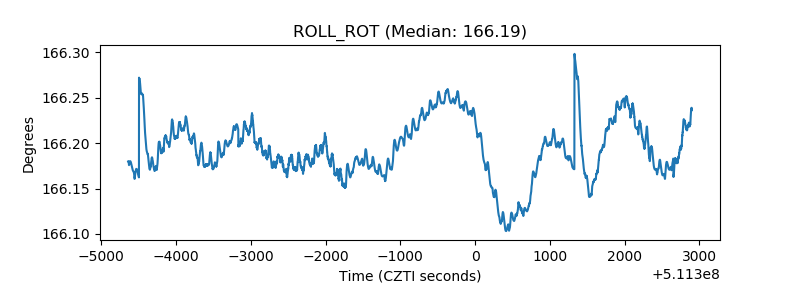 |
| _Roll_DEC | 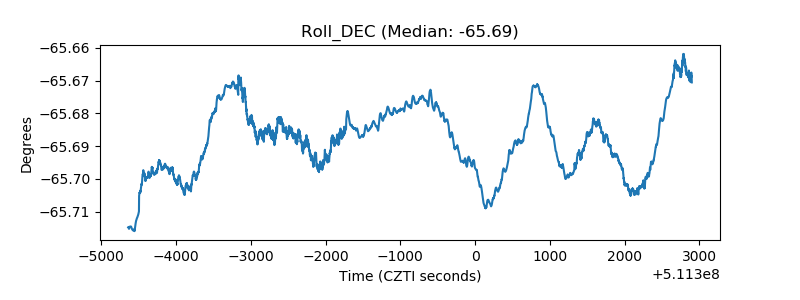 |
| _Roll_RA | 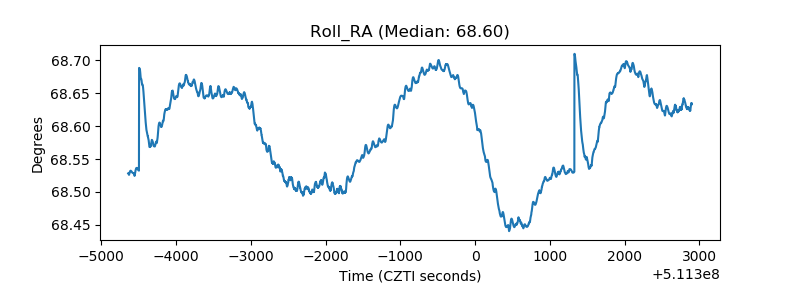 |
| Veto Counter | 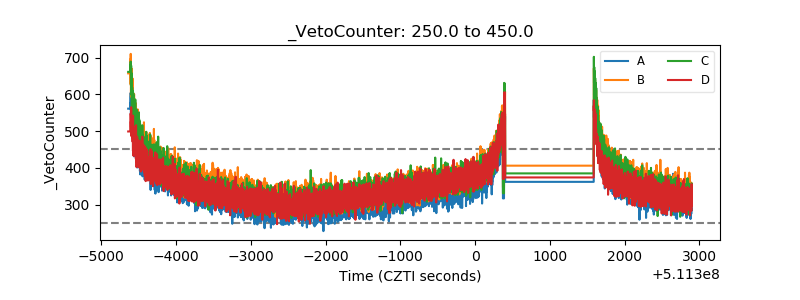 |