| Param | Original file | Final file |
|---|---|---|
| Filename | modeM0/AS1A14_083T06_9000006558_56612cztM0_level2.fits | modeM0/AS1A14_083T06_9000006558_56612cztM0_level2_quad_clean.evt |
| Size (bytes) | 520,551,360 | 109,431,360 |
| Size | 496.4 MB | 104.4 MB |
| Events in quadrant A | 3,749,446 | 726,004 |
| Events in quadrant B | 4,202,057 | 765,815 |
| Events in quadrant C | 4,458,011 | 670,330 |
| Events in quadrant D | 6,256,183 | 612,014 |
| Mode SS | |||
|---|---|---|---|
| Quadrant | BADHDUFLAG | Total packets | Discarded packets |
| A | 0 | 156 | 0 |
| B | 0 | 156 | 0 |
| C | 0 | 156 | 0 |
| D | 0 | 156 | 0 |
| Mode M9 | |||
|---|---|---|---|
| Quadrant | BADHDUFLAG | Total packets | Discarded packets |
| A | 0 | 12 | 0 |
| B | 0 | 12 | 0 |
| C | 0 | 12 | 0 |
| D | 0 | 12 | 0 |
| Mode M0 | |||
|---|---|---|---|
| Quadrant | BADHDUFLAG | Total packets | Discarded packets |
| A | 0 | 17221 | 2 |
| B | 0 | 18193 | 2 |
| C | 0 | 19219 | 2 |
| D | 0 | 24174 | 2 |
| Quadrant | Total seconds | Saturated seconds | Saturation percentage |
|---|---|---|---|
| A | 7763 | 182 | 2.344454% |
| B | 7764 | 368 | 4.739825% |
| C | 7764 | 398 | 5.126224% |
| D | 7764 | 587 | 7.560536% |
Noise dominated data is calculated using 1-second bins in cleaned event files. If a bin has >2000 counts, and if more than 50% of those come from <1% of pixels, then it is considered to be noise-dominated and hence unusable.
| Quadrant | # 1 sec bins | Bins with >0 counts | Bins with >2000 counts | High rate bins dominated by noise | Noise dominated (total time) | Noise dominated (detector-on time) | Marked lightcurve |
|---|---|---|---|---|---|---|---|
| A | 8833 | 7765 | 80 | 80 | 0.91% | 1.03% | 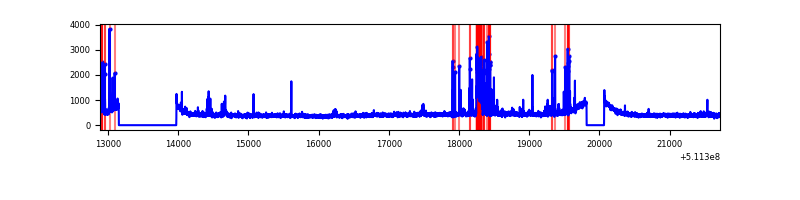 |
| B | 8834 | 7766 | 117 | 117 | 1.32% | 1.51% | 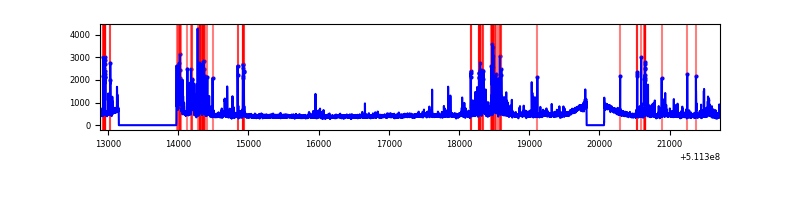 |
| C | 8834 | 7766 | 216 | 216 | 2.45% | 2.78% | 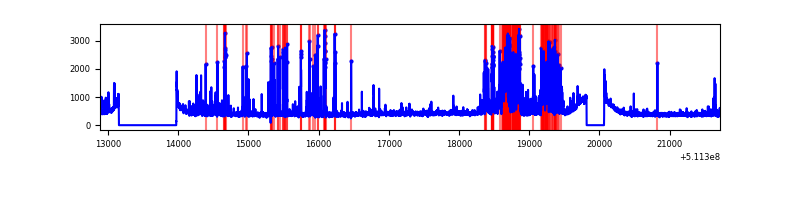 |
| D | 8834 | 7766 | 428 | 428 | 4.84% | 5.51% | 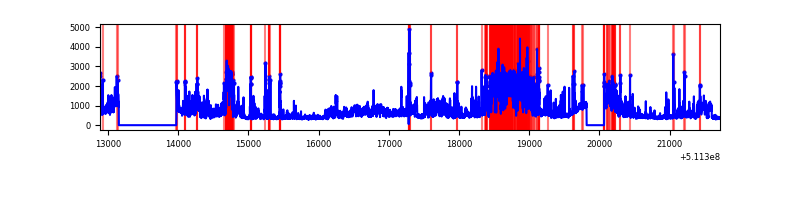 |
Top three noisy pixels from each quadrant. If the there are fewer than three noisy pixels in the level2.evt file, extra rows are filled as -1
| Pixel properties | Quadrant properties | ||||||
|---|---|---|---|---|---|---|---|
| Quadrant | DetID | PixID | Counts | Sigma | Mean | Median | Sigma |
| A | 13 | 248 | 247663 | 1189.18 | 845 | 822 | 207.6 |
| A | 0 | 8 | 102376 | 489.25 | 845 | 822 | 207.6 |
| A | 4 | 249 | 76374 | 363.98 | 845 | 822 | 207.6 |
| B | 0 | 231 | 380153 | 2138.49 | 834 | 803 | 177.4 |
| B | 10 | 247 | 143291 | 803.24 | 834 | 803 | 177.4 |
| B | 5 | 185 | 85369 | 476.72 | 834 | 803 | 177.4 |
| C | 15 | 219 | 676230 | 3081.23 | 814 | 806 | 219.2 |
| C | 12 | 252 | 252109 | 1146.42 | 814 | 806 | 219.2 |
| C | 1 | 12 | 116523 | 527.89 | 814 | 806 | 219.2 |
| D | 10 | 199 | 1370735 | 6150.4 | 798 | 760 | 222.7 |
| D | 2 | 249 | 751896 | 3372.17 | 798 | 760 | 222.7 |
| D | 6 | 239 | 264344 | 1183.34 | 798 | 760 | 222.7 |
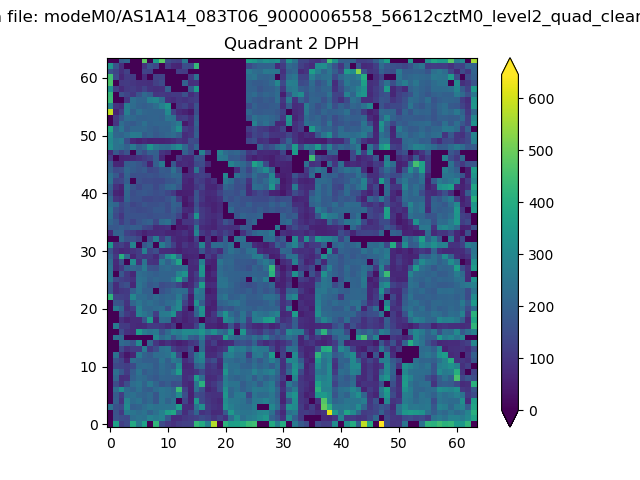
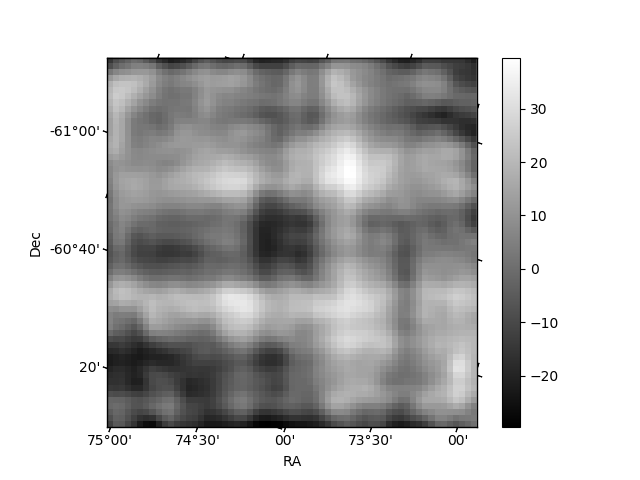
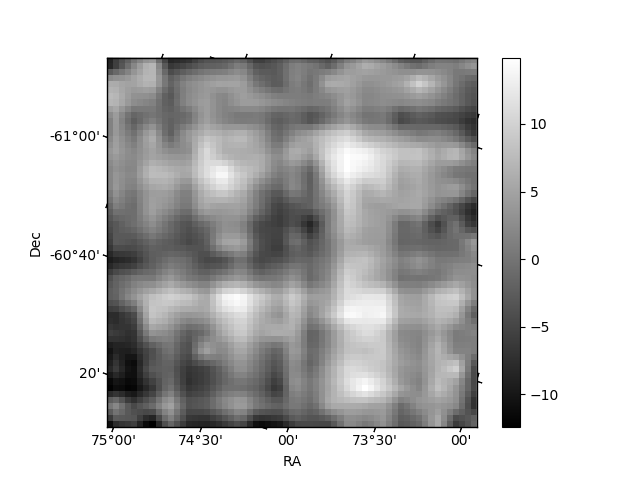
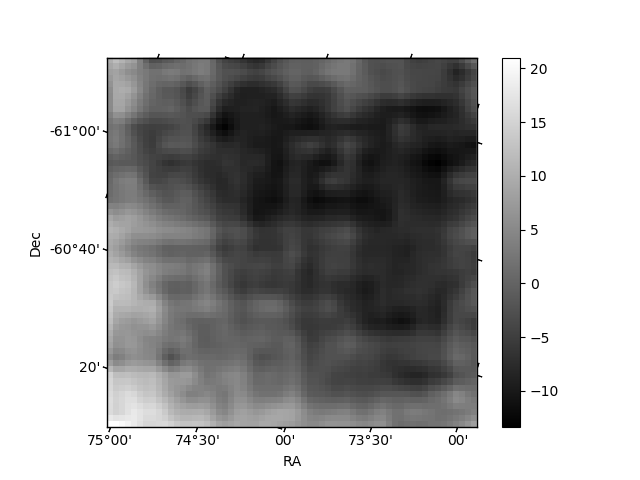
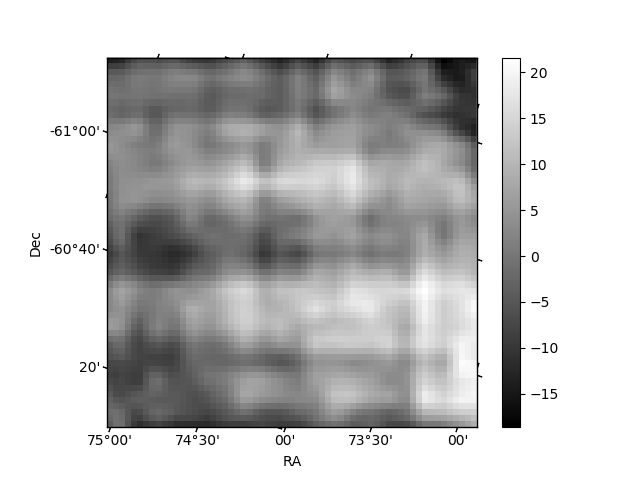
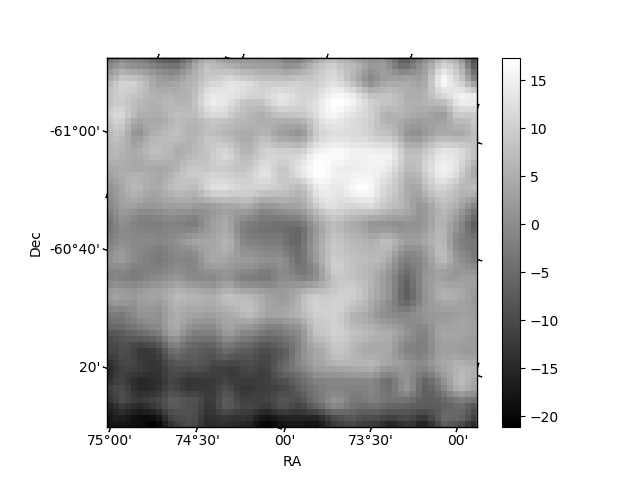
Histogram calculated using DETX and DETY for each event in the final _common_clean file
| Quadrant A | 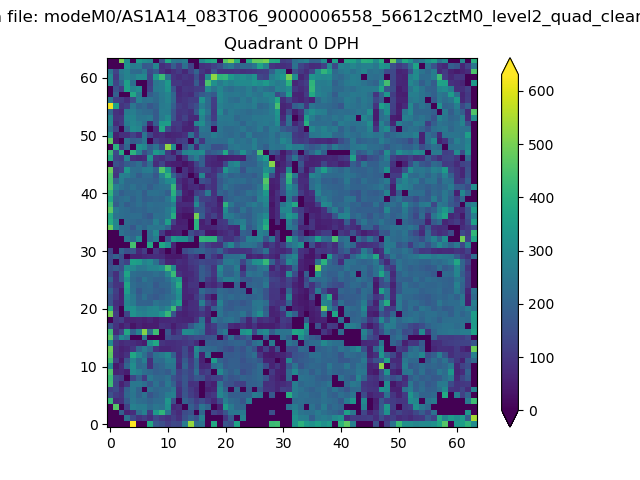 |
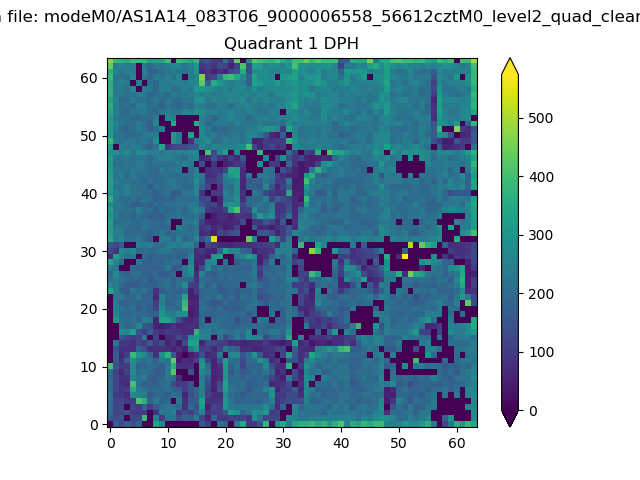 |
Quadrant B |
|---|---|---|---|
| Quadrant D | 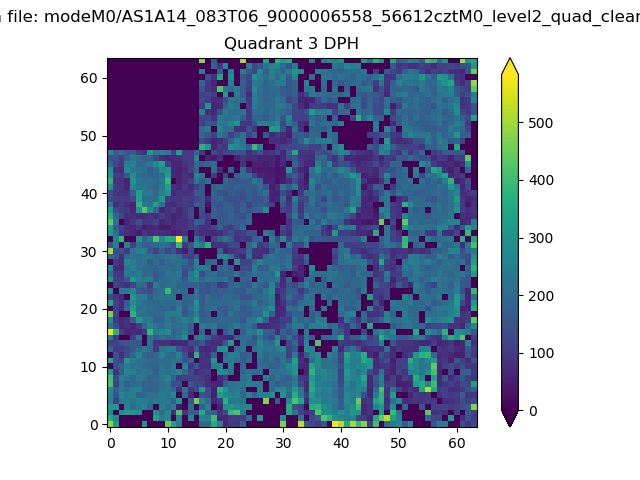 |
 |
Quadrant C |
| Plot type | Count rate plots | Images |
|---|---|---|
| Comparison with Poisson distribution Blue bars denote a histogram of data divided into 1 sec bins. Red curve is a Poisson curve with rate = median count rate of data. |
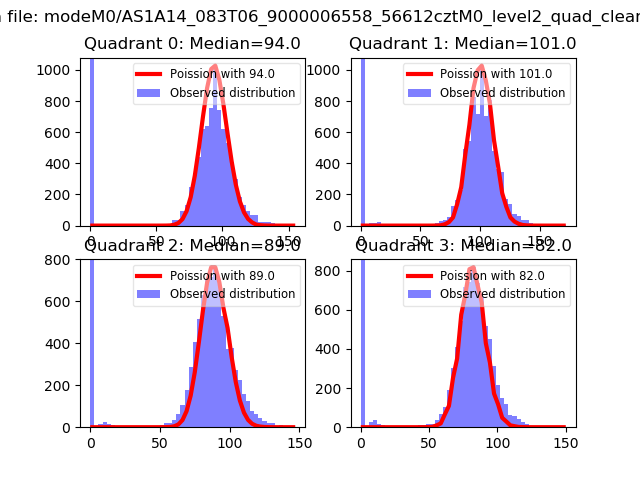 |
 |
| Quadrant-wise count rates Data is divided into 100 sec bins |
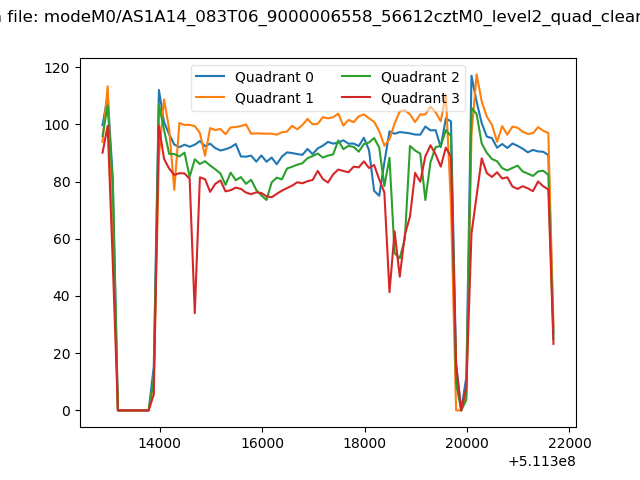 |
|
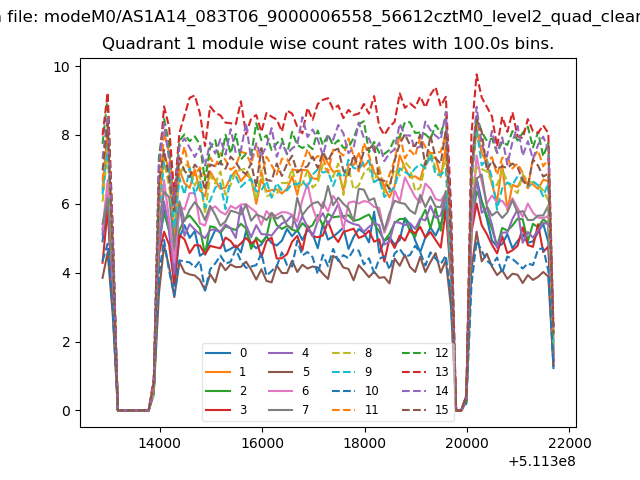
| Module-wise count rates for Quadrant A Data is divided into 100 sec bins |
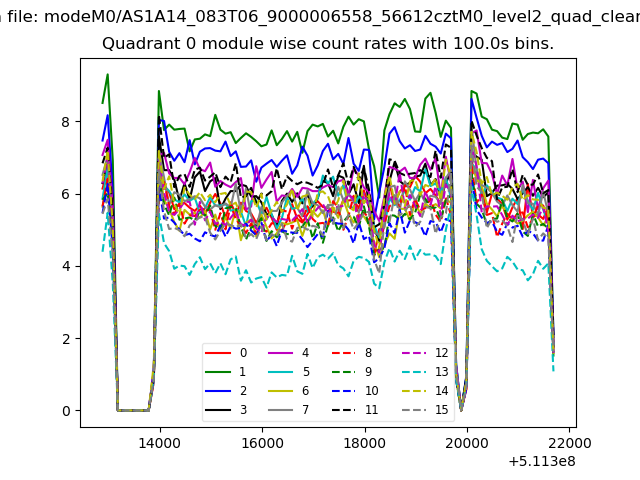 |
 |
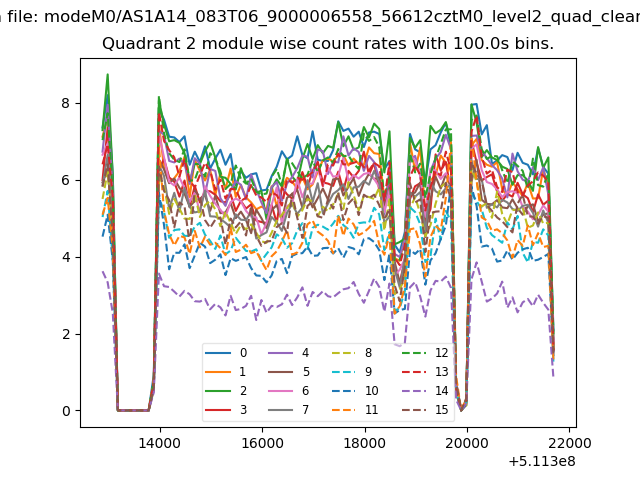
| Module-wise count rates for Quadrant B Data is divided into 100 sec bins |
 |
 |
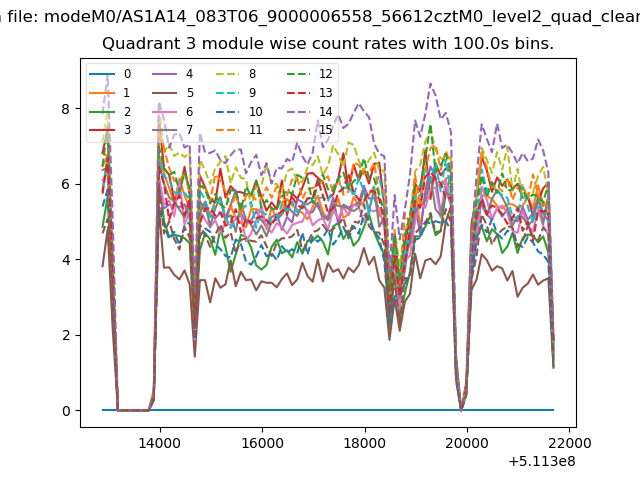
| Module-wise count rates for Quadrant C Data is divided into 100 sec bins |
 |
 |
| Module-wise count rates for Quadrant D Data is divided into 100 sec bins |
 |
 |
| Parameter | Plot |
|---|---|
| CZT HV Monitor | 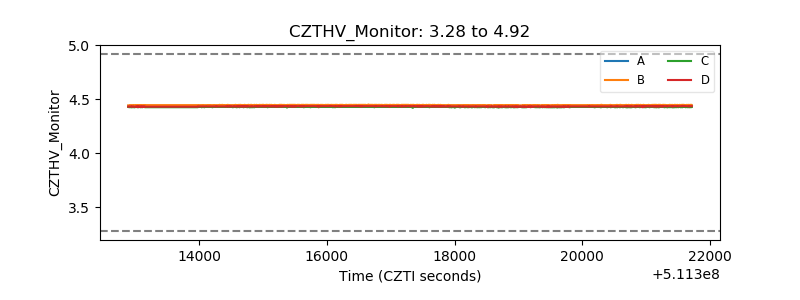 |
| D_VDD | 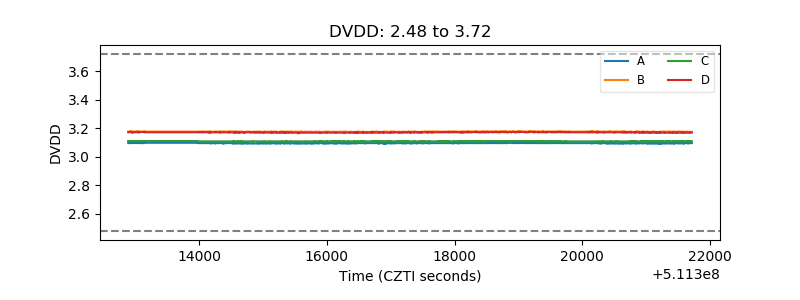 |
| Temperature 1 | 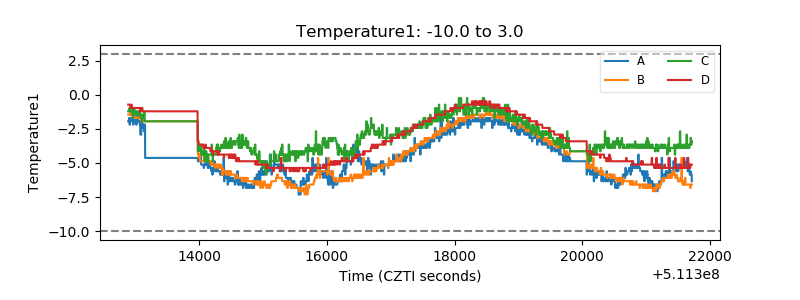 |
| Veto HV Monitor | 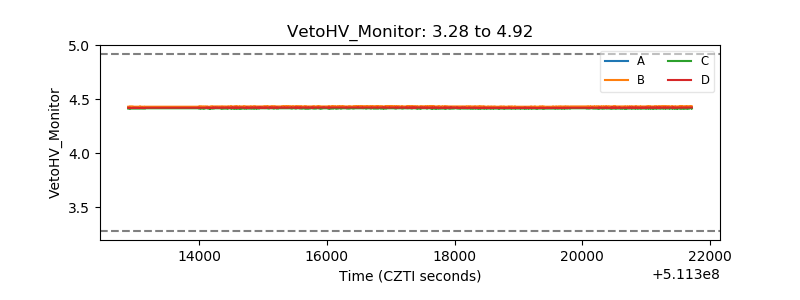 |
| Veto LLD | 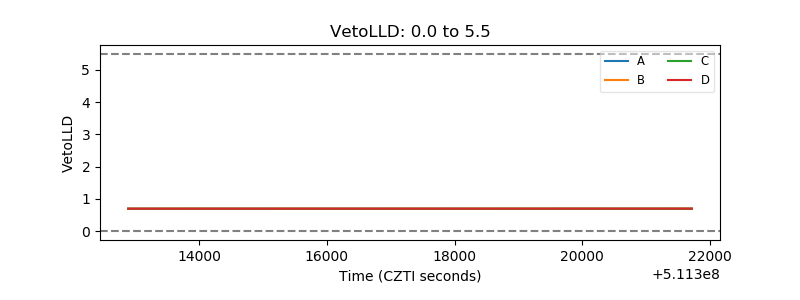 |
| Alpha Counter | 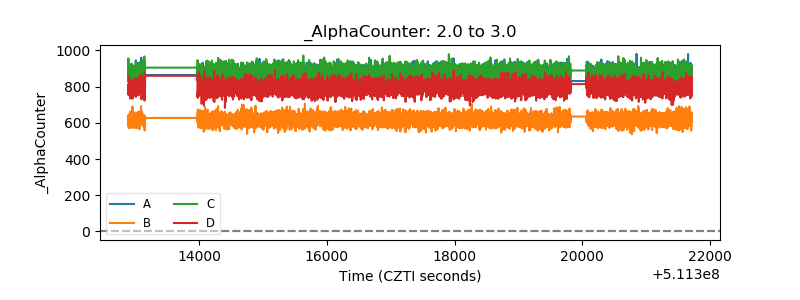 |
| _CPM_Rate | 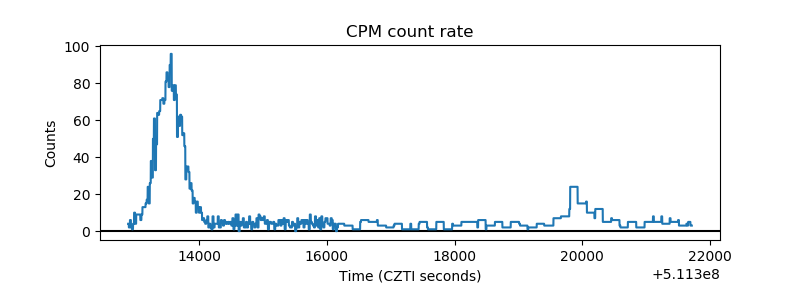 |
| CZT Counter | 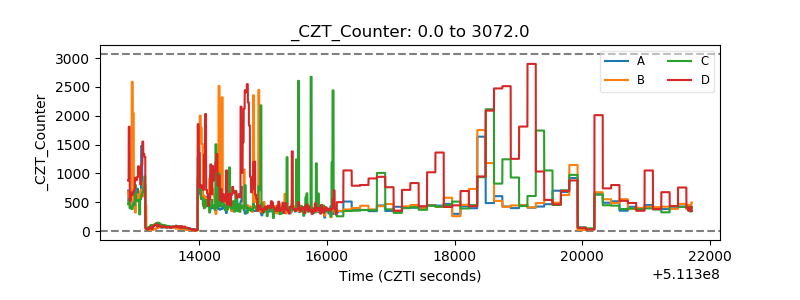 |
| +2.5 Volts monitor |  |
| +5 Volts monitor |  |
| _ROLL_ROT | 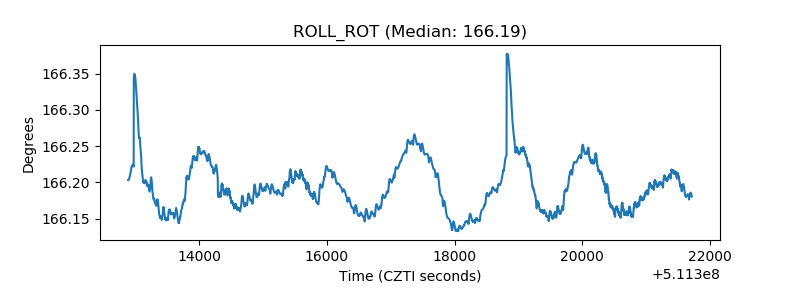 |
| _Roll_DEC | 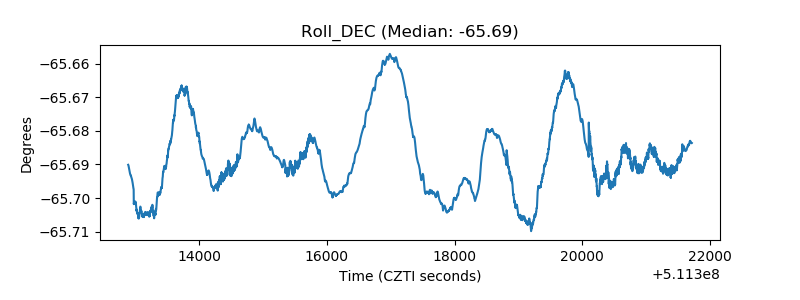 |
| _Roll_RA | 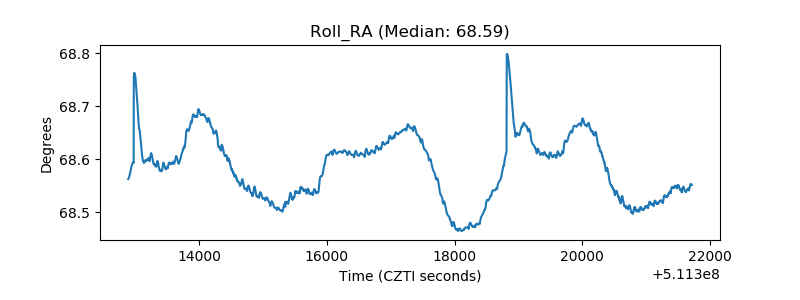 |
| Veto Counter | 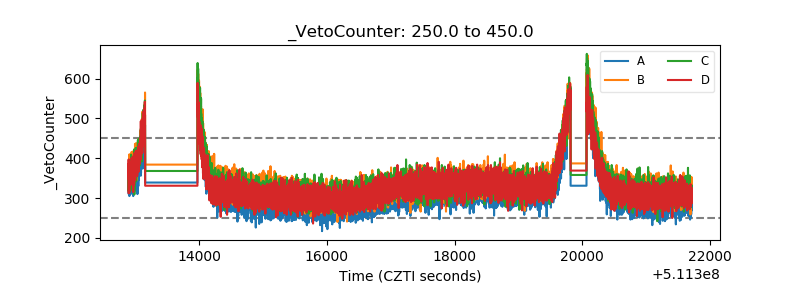 |