| Param | Original file | Final file |
|---|---|---|
| Filename | modeM0/AS1A14_083T06_9000006558_56613cztM0_level2.fits | modeM0/AS1A14_083T06_9000006558_56613cztM0_level2_quad_clean.evt |
| Size (bytes) | 564,217,920 | 124,467,840 |
| Size | 538.1 MB | 118.7 MB |
| Events in quadrant A | 4,078,705 | 822,809 |
| Events in quadrant B | 4,583,761 | 877,421 |
| Events in quadrant C | 5,070,204 | 759,888 |
| Events in quadrant D | 6,466,638 | 695,351 |
| Mode SS | |||
|---|---|---|---|
| Quadrant | BADHDUFLAG | Total packets | Discarded packets |
| A | 0 | 178 | 0 |
| B | 0 | 178 | 0 |
| C | 0 | 178 | 0 |
| D | 0 | 178 | 0 |
| Mode M9 | |||
|---|---|---|---|
| Quadrant | BADHDUFLAG | Total packets | Discarded packets |
| A | 0 | 3 | 0 |
| B | 0 | 3 | 0 |
| C | 0 | 3 | 0 |
| D | 0 | 3 | 0 |
| Mode M0 | |||
|---|---|---|---|
| Quadrant | BADHDUFLAG | Total packets | Discarded packets |
| A | 0 | 18902 | 1 |
| B | 0 | 20081 | 1 |
| C | 0 | 21695 | 1 |
| D | 0 | 25568 | 1 |
| Quadrant | Total seconds | Saturated seconds | Saturation percentage |
|---|---|---|---|
| A | 8833 | 128 | 1.449111% |
| B | 8833 | 257 | 2.909544% |
| C | 8834 | 360 | 4.075164% |
| D | 8834 | 577 | 6.531583% |
Noise dominated data is calculated using 1-second bins in cleaned event files. If a bin has >2000 counts, and if more than 50% of those come from <1% of pixels, then it is considered to be noise-dominated and hence unusable.
| Quadrant | # 1 sec bins | Bins with >0 counts | Bins with >2000 counts | High rate bins dominated by noise | Noise dominated (total time) | Noise dominated (detector-on time) | Marked lightcurve |
|---|---|---|---|---|---|---|---|
| A | 9083 | 8834 | 56 | 56 | 0.62% | 0.63% | 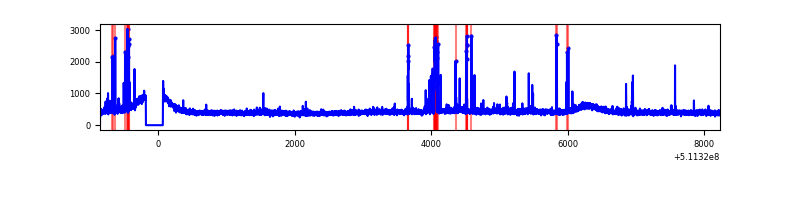 |
| B | 9083 | 8834 | 74 | 74 | 0.81% | 0.84% | 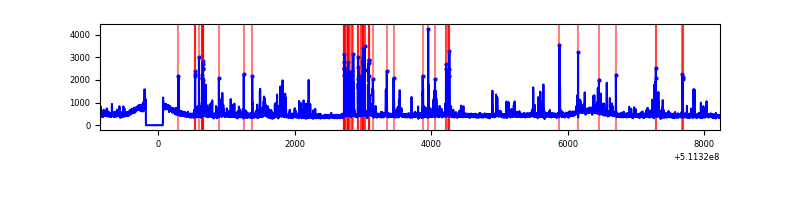 |
| C | 9084 | 8835 | 186 | 186 | 2.05% | 2.11% | 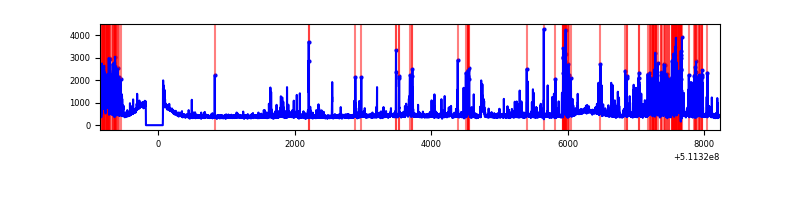 |
| D | 9084 | 8835 | 479 | 479 | 5.27% | 5.42% | 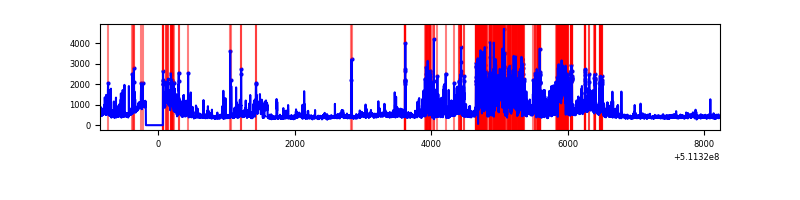 |
Top three noisy pixels from each quadrant. If the there are fewer than three noisy pixels in the level2.evt file, extra rows are filled as -1
| Pixel properties | Quadrant properties | ||||||
|---|---|---|---|---|---|---|---|
| Quadrant | DetID | PixID | Counts | Sigma | Mean | Median | Sigma |
| A | 13 | 248 | 171244 | 723.66 | 959 | 935 | 235.3 |
| A | 0 | 8 | 93086 | 391.56 | 959 | 935 | 235.3 |
| A | 8 | 249 | 21202 | 86.12 | 959 | 935 | 235.3 |
| B | 5 | 185 | 263146 | 1294.17 | 954 | 921 | 202.6 |
| B | 10 | 247 | 181619 | 891.8 | 954 | 921 | 202.6 |
| B | 0 | 231 | 155189 | 761.36 | 954 | 921 | 202.6 |
| C | 15 | 219 | 704078 | 2812.57 | 924 | 914 | 250.0 |
| C | 13 | 3 | 181061 | 720.57 | 924 | 914 | 250.0 |
| C | 12 | 249 | 157002 | 624.33 | 924 | 914 | 250.0 |
| D | 6 | 239 | 769264 | 3048.98 | 906 | 865 | 252.0 |
| D | 8 | 129 | 624733 | 2475.48 | 906 | 865 | 252.0 |
| D | 10 | 199 | 480403 | 1902.79 | 906 | 865 | 252.0 |
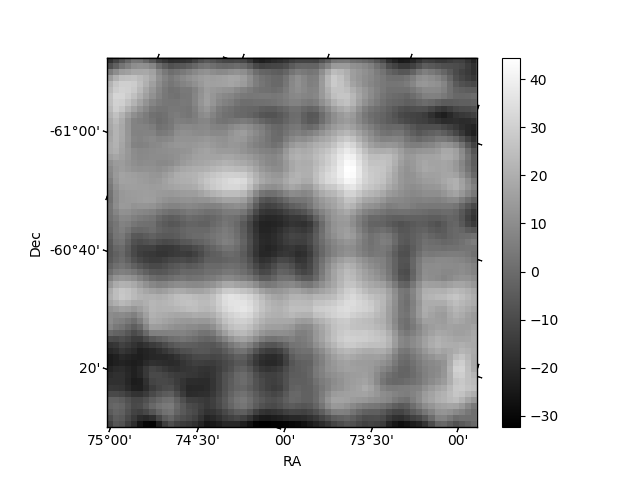
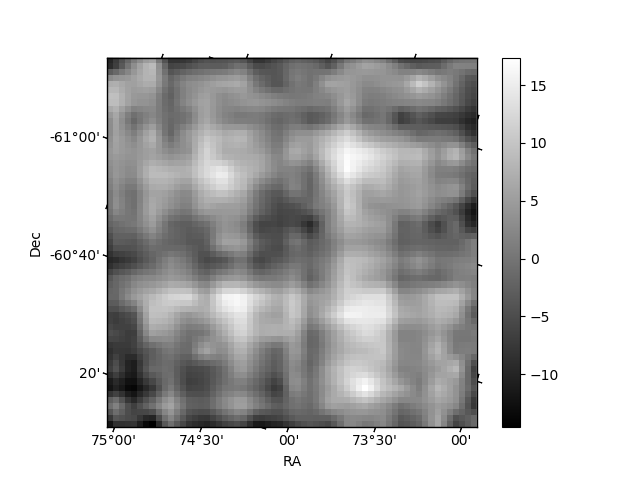
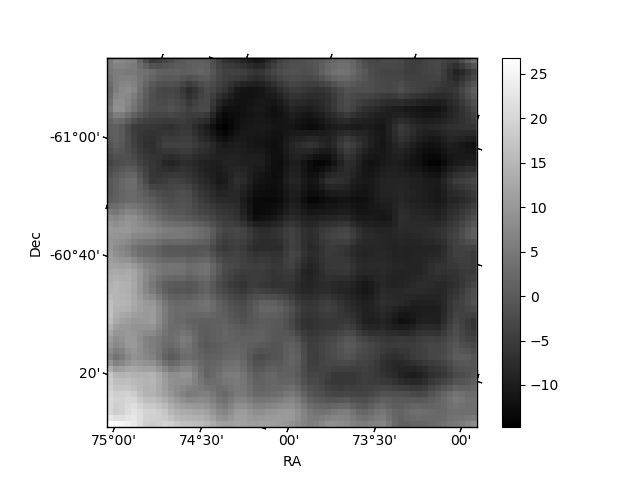
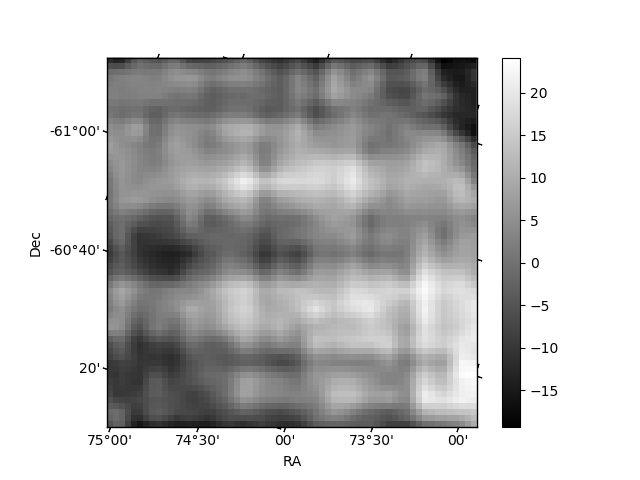
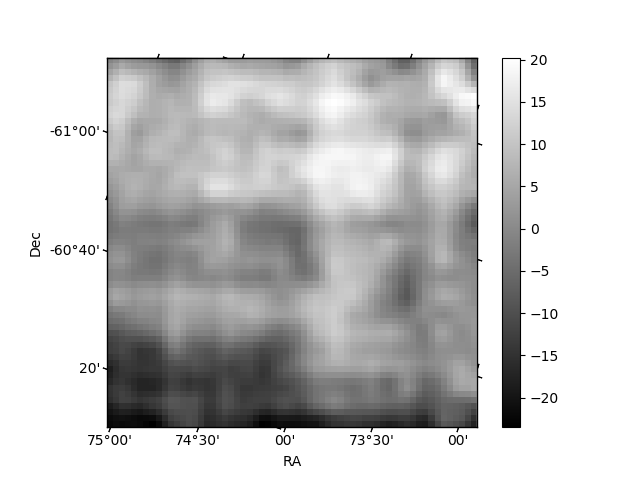
Histogram calculated using DETX and DETY for each event in the final _common_clean file
| Quadrant A | 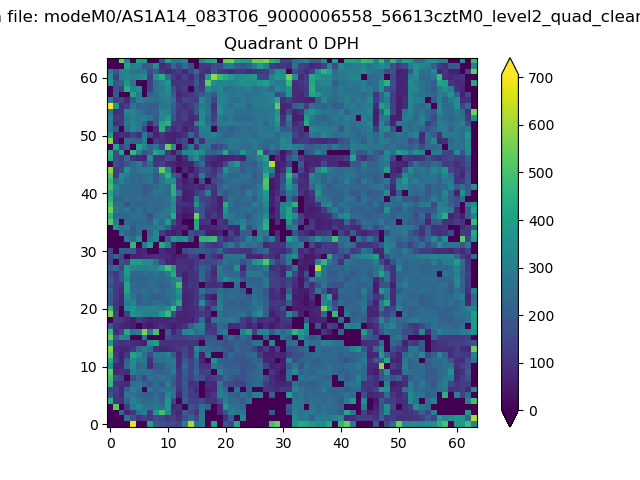 |
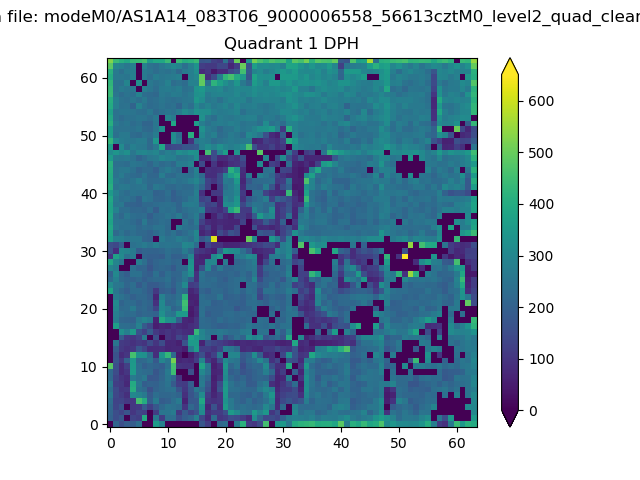 |
Quadrant B |
|---|---|---|---|
| Quadrant D | 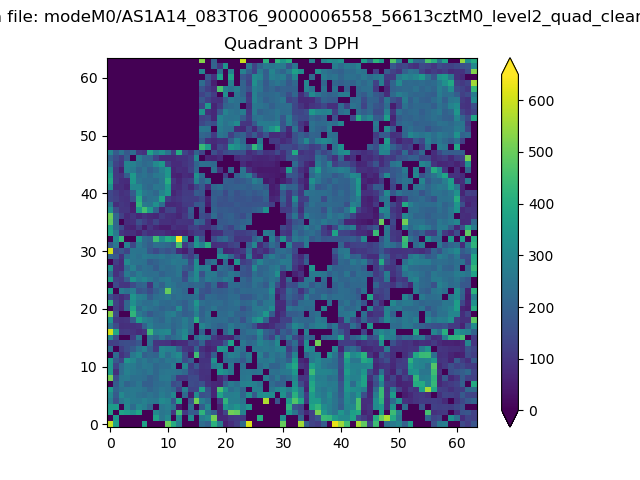 |
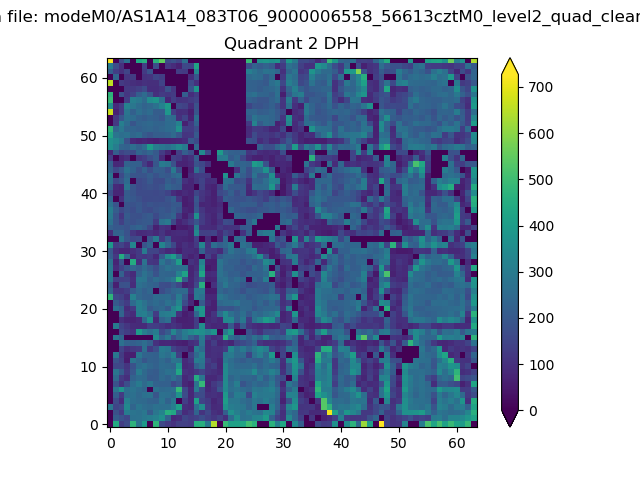 |
Quadrant C |
| Plot type | Count rate plots | Images |
|---|---|---|
| Comparison with Poisson distribution Blue bars denote a histogram of data divided into 1 sec bins. Red curve is a Poisson curve with rate = median count rate of data. |
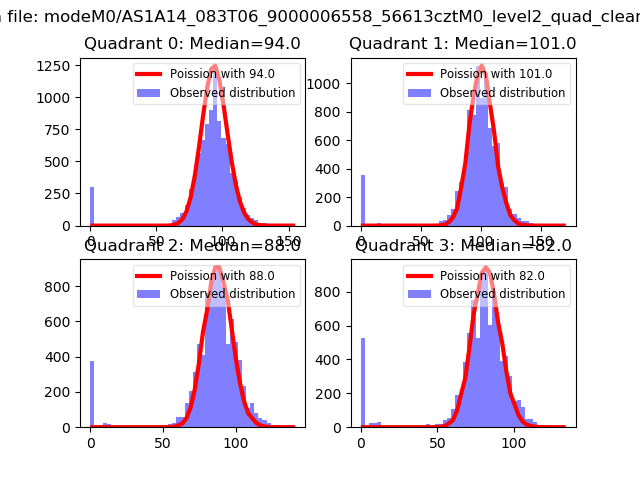 |
 |
| Quadrant-wise count rates Data is divided into 100 sec bins |
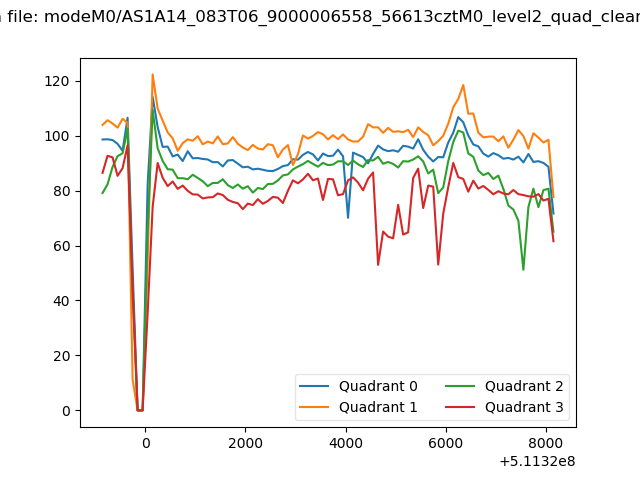 |
|
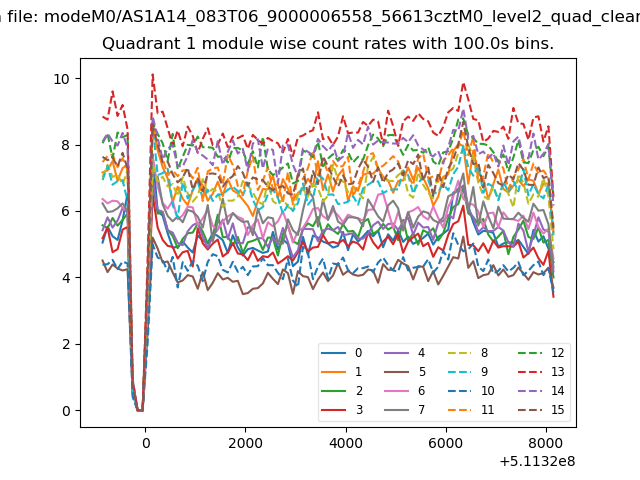
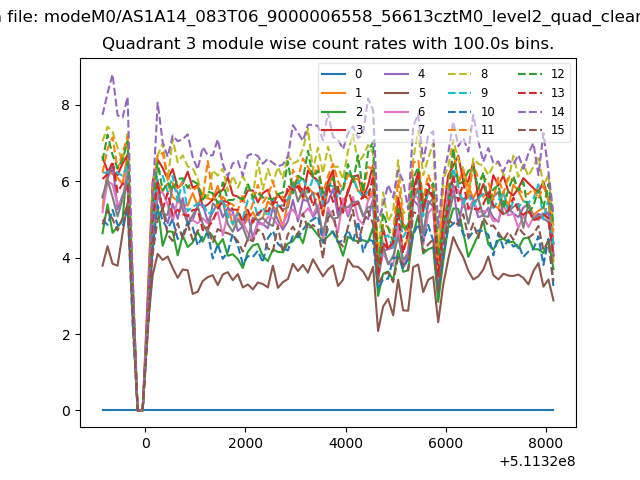
| Module-wise count rates for Quadrant A Data is divided into 100 sec bins |
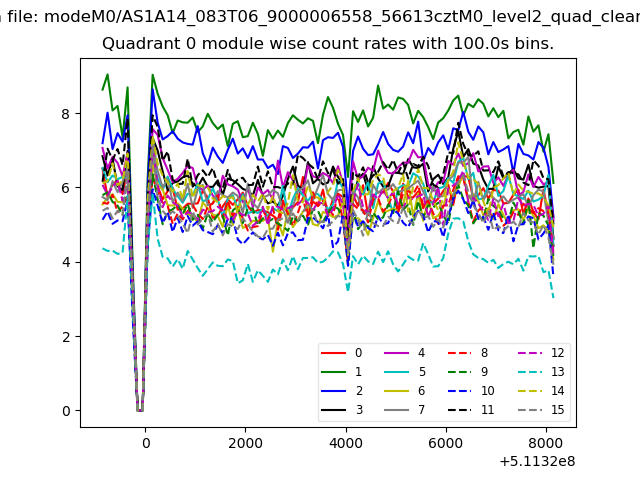 |
 |
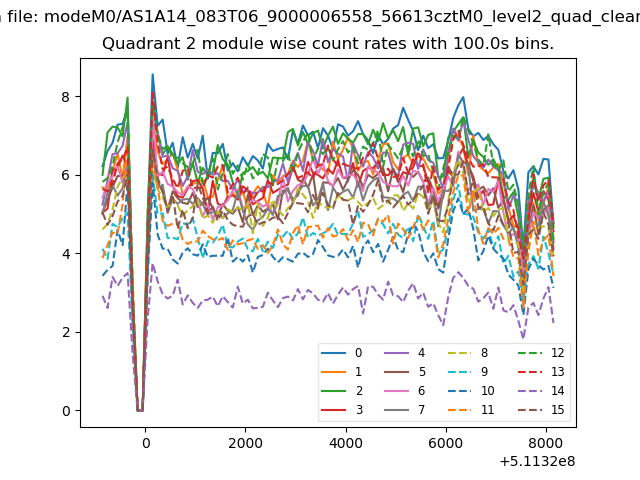
| Module-wise count rates for Quadrant B Data is divided into 100 sec bins |
 |
 |
| Module-wise count rates for Quadrant C Data is divided into 100 sec bins |
 |
 |
| Module-wise count rates for Quadrant D Data is divided into 100 sec bins |
 |
 |
| Parameter | Plot |
|---|---|
| CZT HV Monitor | 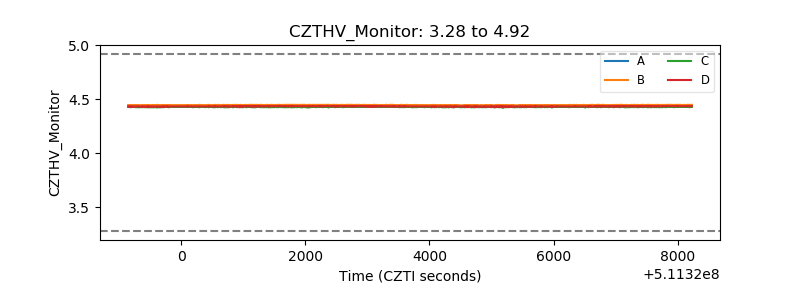 |
| D_VDD | 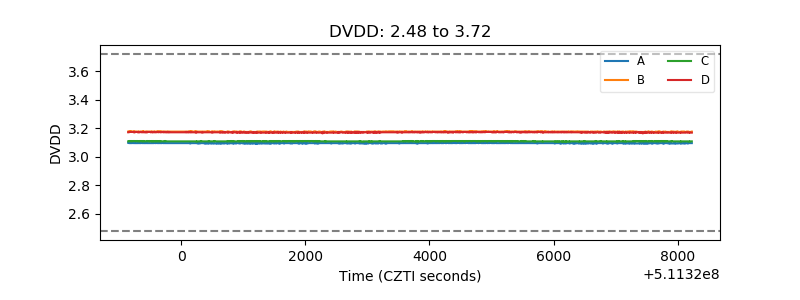 |
| Temperature 1 | 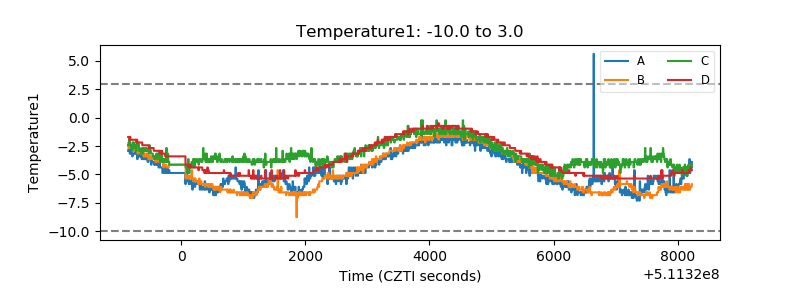 |
| Veto HV Monitor | 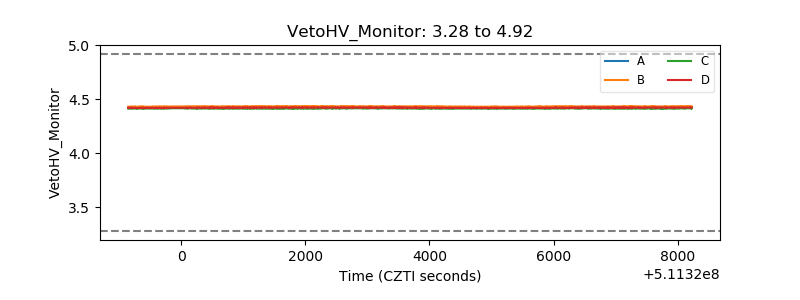 |
| Veto LLD | 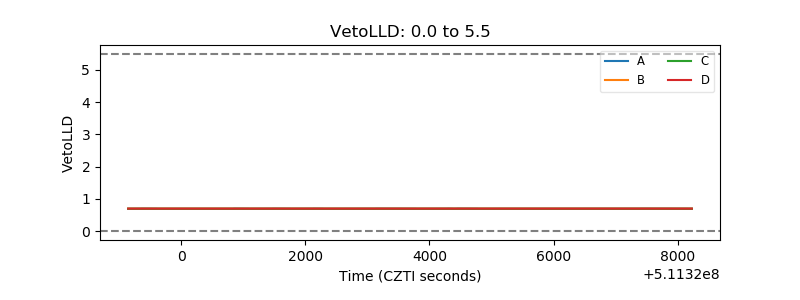 |
| Alpha Counter | 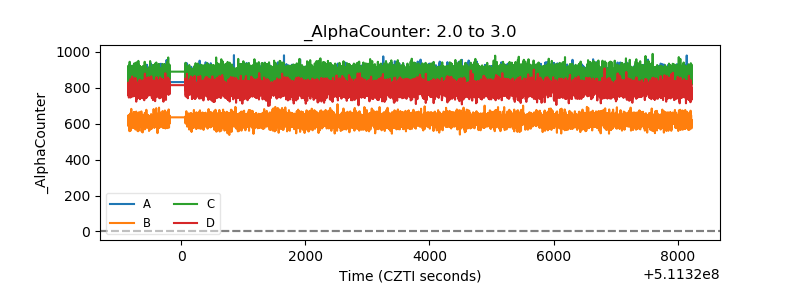 |
| _CPM_Rate | 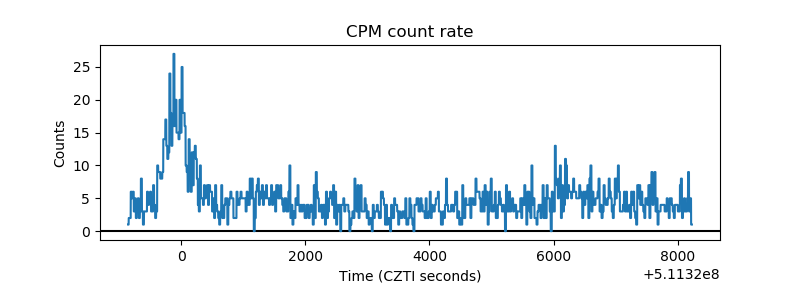 |
| CZT Counter | 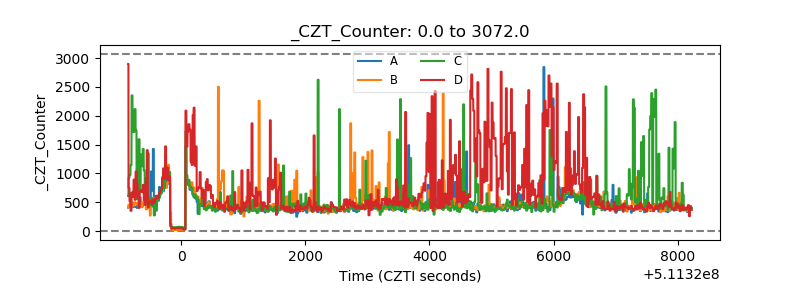 |
| +2.5 Volts monitor |  |
| +5 Volts monitor |  |
| _ROLL_ROT | 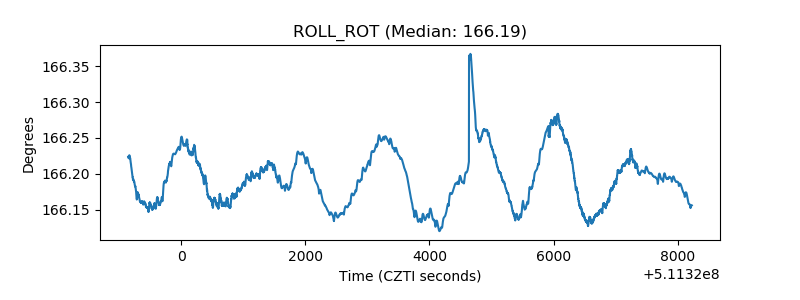 |
| _Roll_DEC | 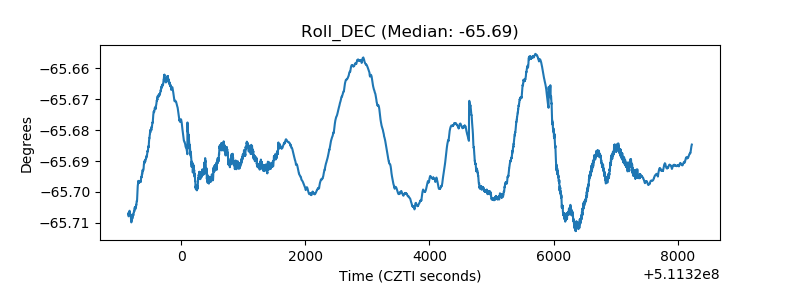 |
| _Roll_RA | 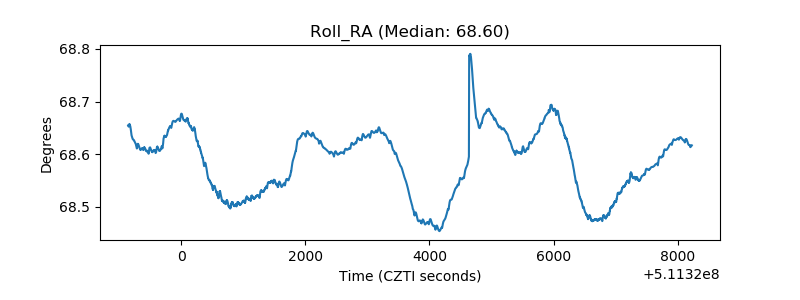 |
| Veto Counter | 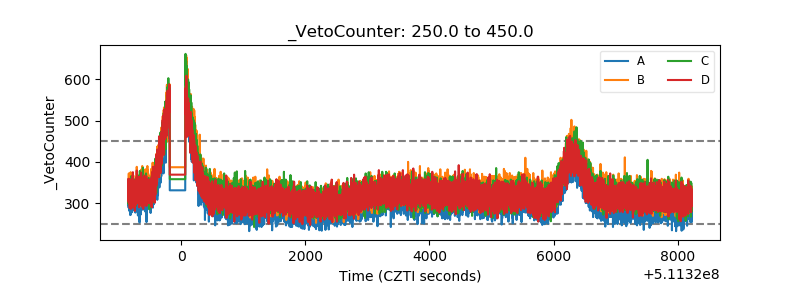 |