| Param | Original file | Final file |
|---|---|---|
| Filename | modeM0/AS1A14_083T06_9000006558_56614cztM0_level2.fits | modeM0/AS1A14_083T06_9000006558_56614cztM0_level2_quad_clean.evt |
| Size (bytes) | 442,944,000 | 98,991,360 |
| Size | 422.4 MB | 94.4 MB |
| Events in quadrant A | 3,020,837 | 651,138 |
| Events in quadrant B | 3,617,951 | 700,503 |
| Events in quadrant C | 4,543,575 | 596,848 |
| Events in quadrant D | 4,667,698 | 559,190 |
| Mode SS | |||
|---|---|---|---|
| Quadrant | BADHDUFLAG | Total packets | Discarded packets |
| A | 0 | 142 | 0 |
| B | 0 | 142 | 0 |
| C | 0 | 142 | 0 |
| D | 0 | 142 | 0 |
| Mode M0 | |||
|---|---|---|---|
| Quadrant | BADHDUFLAG | Total packets | Discarded packets |
| A | 0 | 14473 | 0 |
| B | 0 | 15781 | 0 |
| C | 0 | 18492 | 0 |
| D | 0 | 18806 | 0 |
| Quadrant | Total seconds | Saturated seconds | Saturation percentage |
|---|---|---|---|
| A | 7024 | 22 | 0.313212% |
| B | 7024 | 78 | 1.110478% |
| C | 7024 | 302 | 4.299544% |
| D | 7024 | 284 | 4.043280% |
Noise dominated data is calculated using 1-second bins in cleaned event files. If a bin has >2000 counts, and if more than 50% of those come from <1% of pixels, then it is considered to be noise-dominated and hence unusable.
| Quadrant | # 1 sec bins | Bins with >0 counts | Bins with >2000 counts | High rate bins dominated by noise | Noise dominated (total time) | Noise dominated (detector-on time) | Marked lightcurve |
|---|---|---|---|---|---|---|---|
| A | 7024 | 7024 | 13 | 13 | 0.19% | 0.19% | 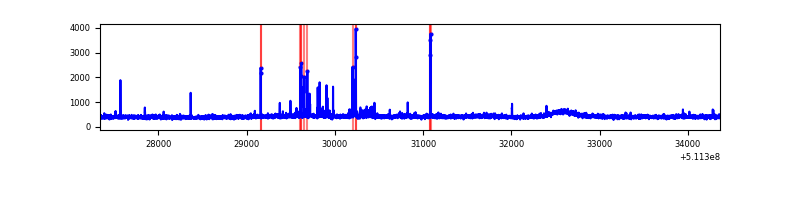 |
| B | 7024 | 7024 | 55 | 55 | 0.78% | 0.78% | 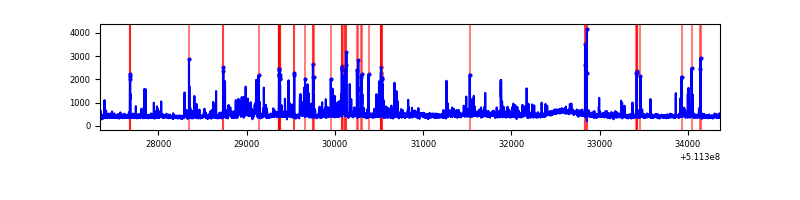 |
| C | 7024 | 7024 | 184 | 184 | 2.62% | 2.62% | 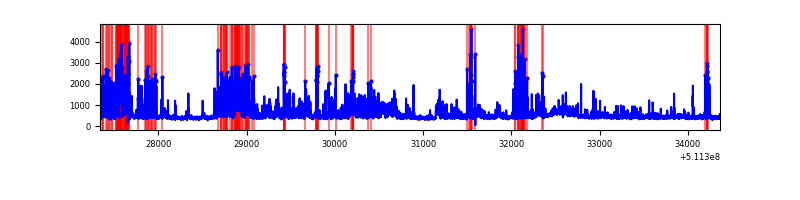 |
| D | 7024 | 7024 | 328 | 328 | 4.67% | 4.67% | 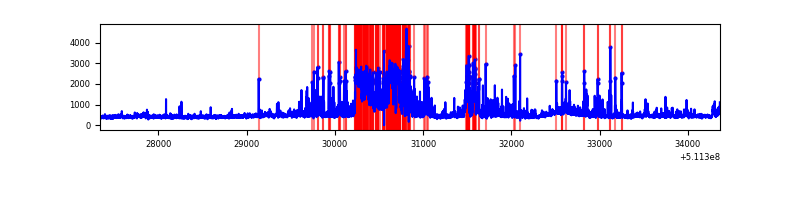 |
Top three noisy pixels from each quadrant. If the there are fewer than three noisy pixels in the level2.evt file, extra rows are filled as -1
| Pixel properties | Quadrant properties | ||||||
|---|---|---|---|---|---|---|---|
| Quadrant | DetID | PixID | Counts | Sigma | Mean | Median | Sigma |
| A | 13 | 248 | 114822 | 630.79 | 736 | 721 | 180.9 |
| A | 13 | 254 | 14993 | 78.9 | 736 | 721 | 180.9 |
| A | 3 | 62 | 11275 | 58.35 | 736 | 721 | 180.9 |
| B | 0 | 231 | 344121 | 2169.91 | 735 | 707 | 158.3 |
| B | 8 | 128 | 112258 | 704.85 | 735 | 707 | 158.3 |
| B | 0 | 213 | 44720 | 278.1 | 735 | 707 | 158.3 |
| C | 15 | 219 | 938286 | 4806.76 | 708 | 701 | 195.1 |
| C | 9 | 38 | 153289 | 782.28 | 708 | 701 | 195.1 |
| C | 12 | 252 | 122405 | 623.95 | 708 | 701 | 195.1 |
| D | 5 | 32 | 845417 | 4247.65 | 702 | 671 | 198.9 |
| D | 2 | 249 | 258651 | 1297.2 | 702 | 671 | 198.9 |
| D | 6 | 239 | 214493 | 1075.16 | 702 | 671 | 198.9 |
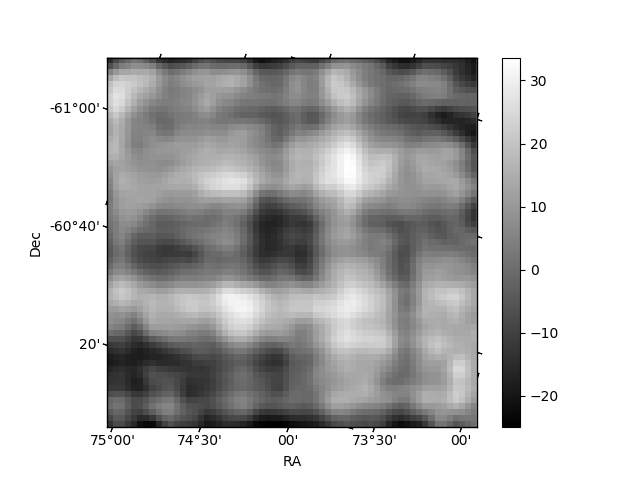
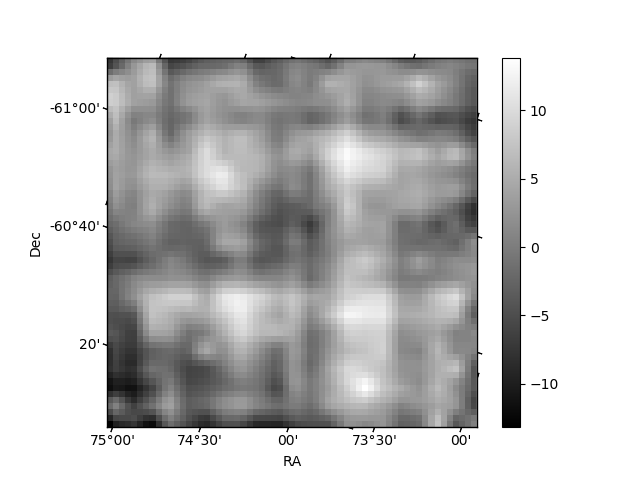
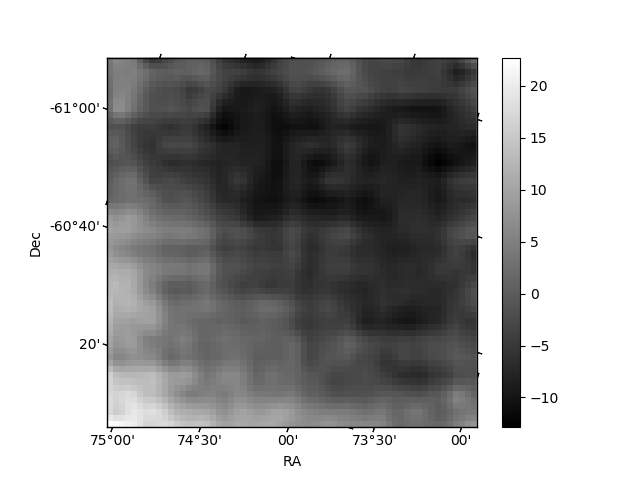
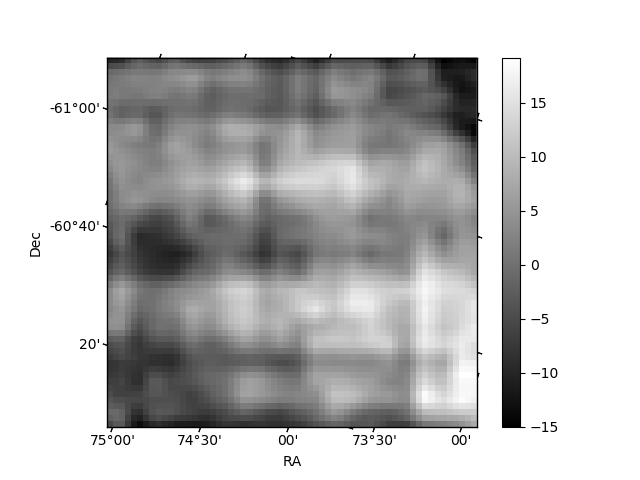
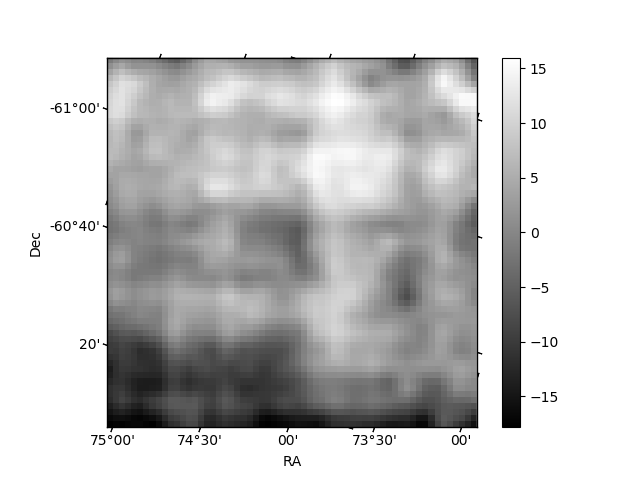
Histogram calculated using DETX and DETY for each event in the final _common_clean file
| Quadrant A | 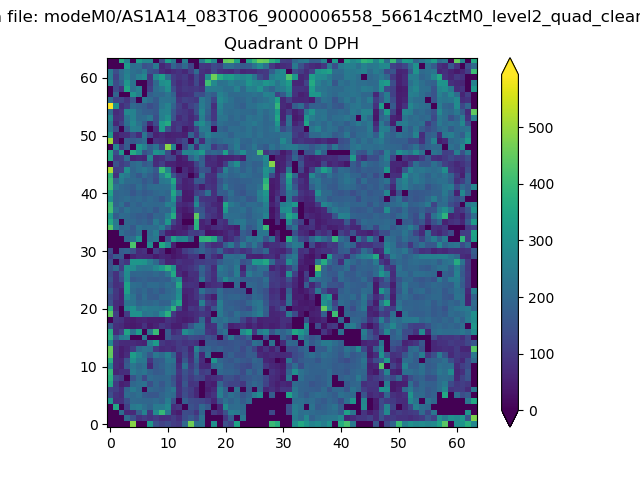 |
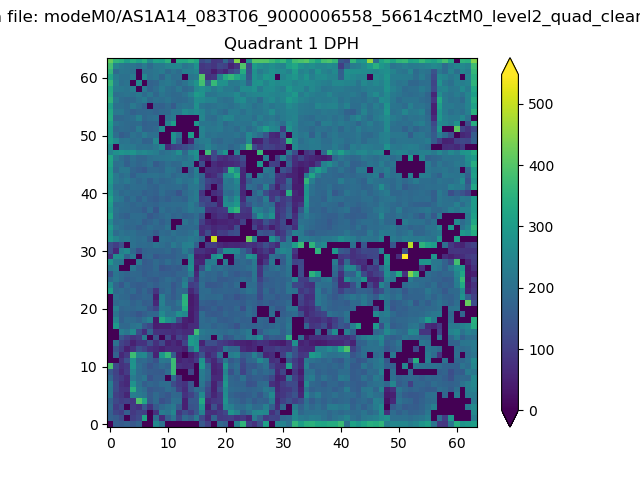 |
Quadrant B |
|---|---|---|---|
| Quadrant D | 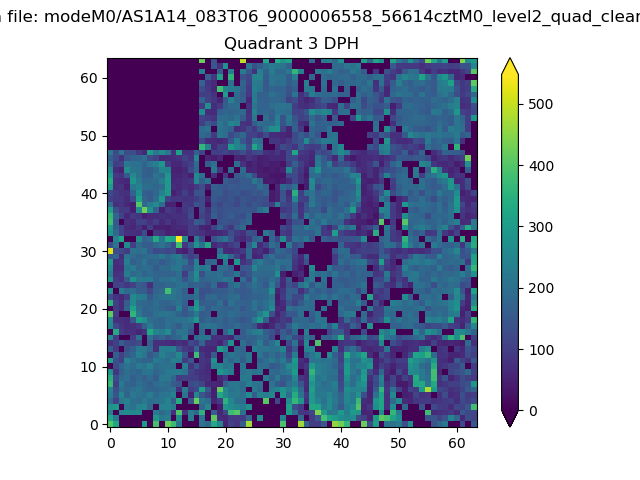 |
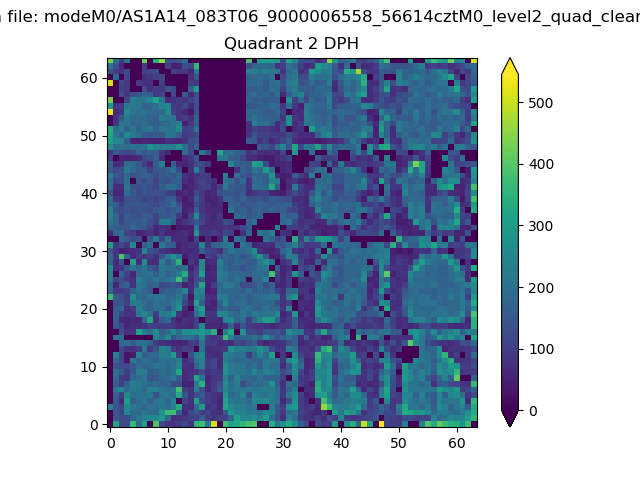 |
Quadrant C |
| Plot type | Count rate plots | Images |
|---|---|---|
| Comparison with Poisson distribution Blue bars denote a histogram of data divided into 1 sec bins. Red curve is a Poisson curve with rate = median count rate of data. |
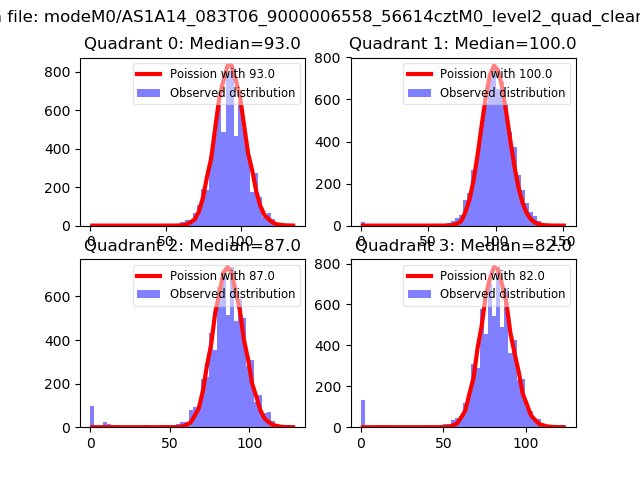 |
 |
| Quadrant-wise count rates Data is divided into 100 sec bins |
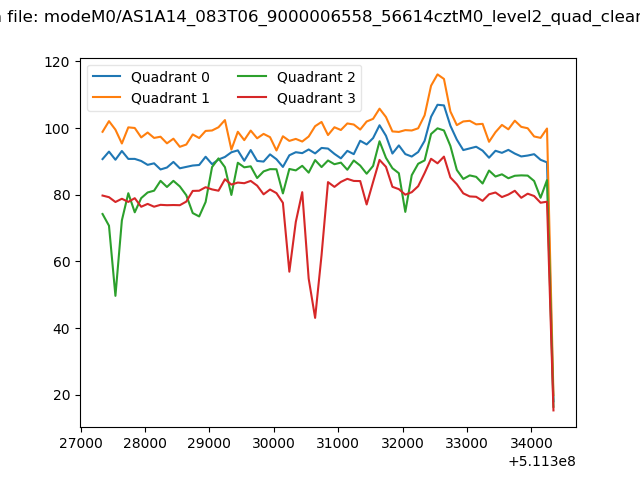 |
|
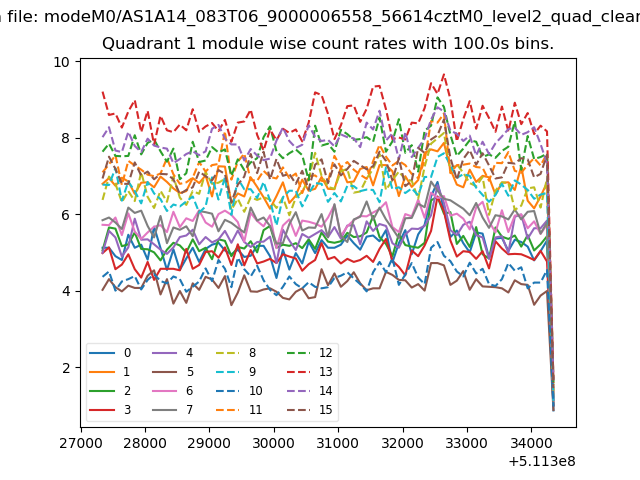
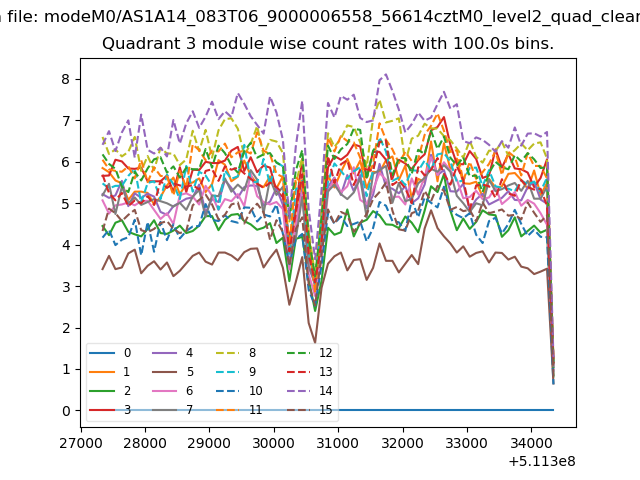
| Module-wise count rates for Quadrant A Data is divided into 100 sec bins |
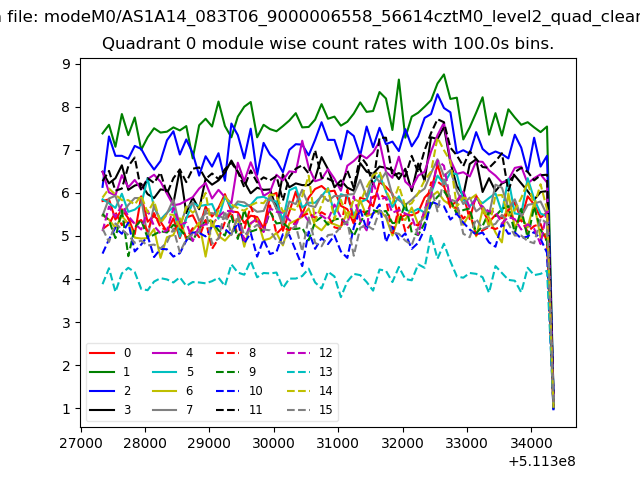 |
 |
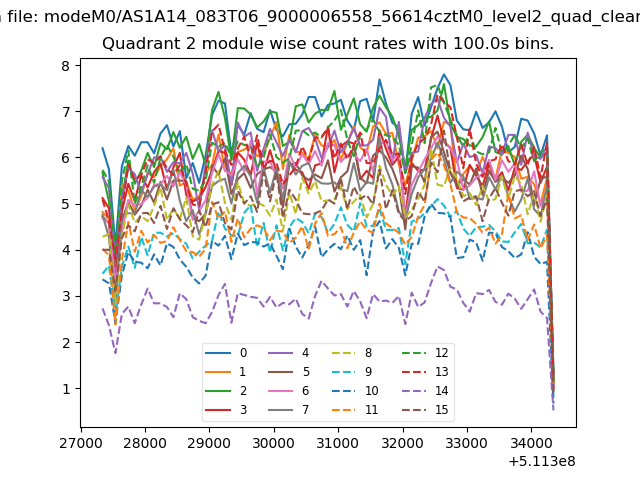
| Module-wise count rates for Quadrant B Data is divided into 100 sec bins |
 |
 |
| Module-wise count rates for Quadrant C Data is divided into 100 sec bins |
 |
 |
| Module-wise count rates for Quadrant D Data is divided into 100 sec bins |
 |
 |
| Parameter | Plot |
|---|---|
| CZT HV Monitor | 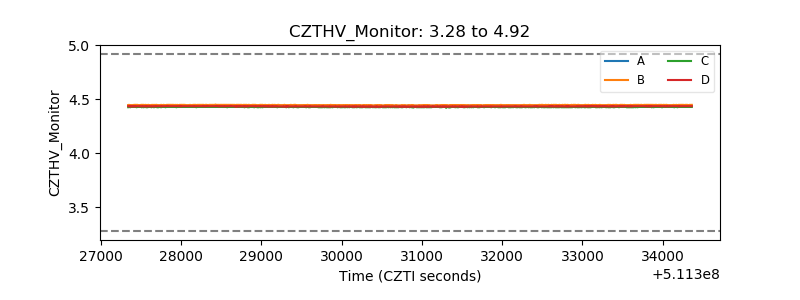 |
| D_VDD | 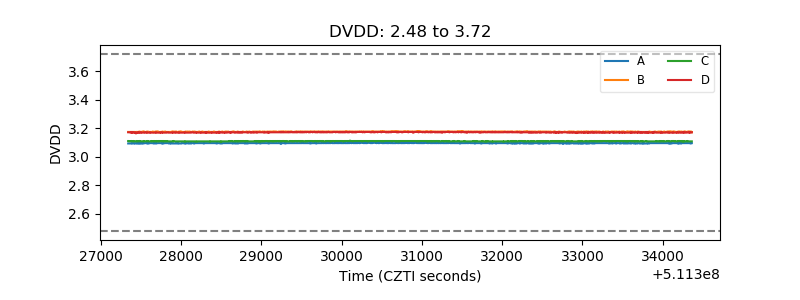 |
| Temperature 1 | 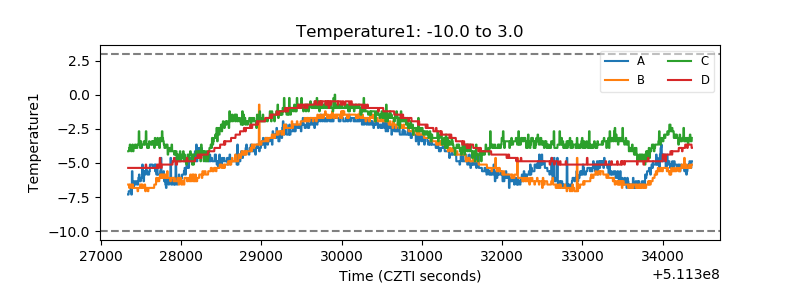 |
| Veto HV Monitor | 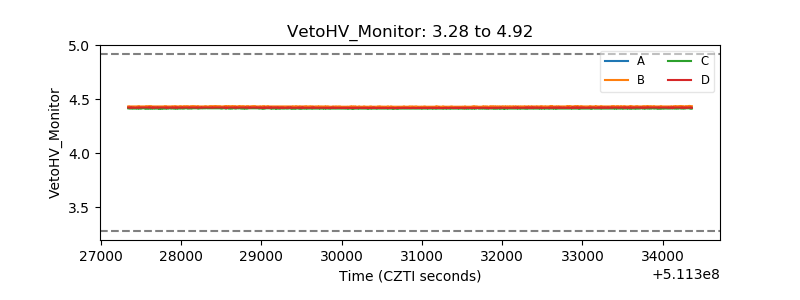 |
| Veto LLD | 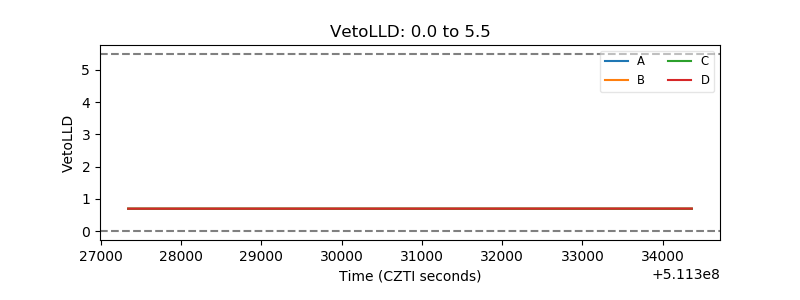 |
| Alpha Counter | 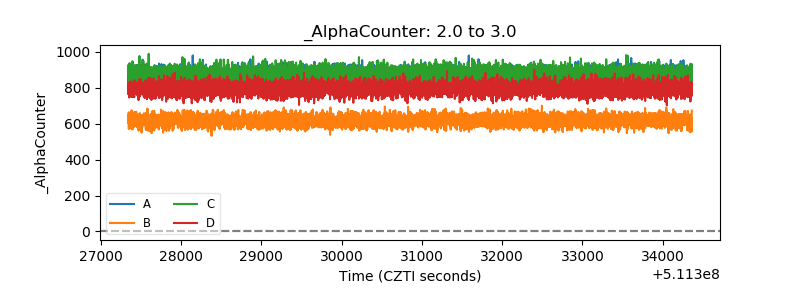 |
| _CPM_Rate | 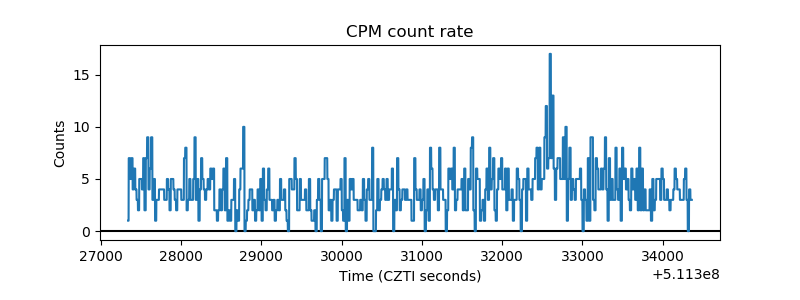 |
| CZT Counter | 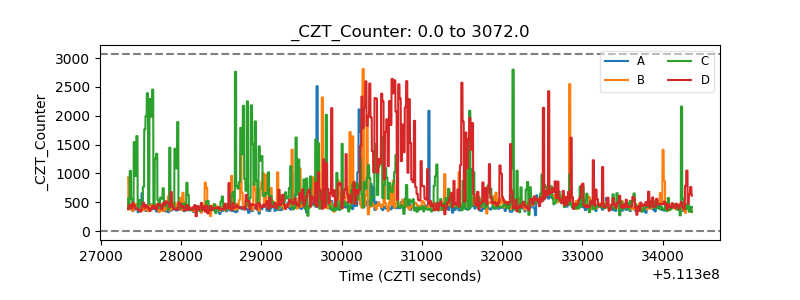 |
| +2.5 Volts monitor |  |
| +5 Volts monitor |  |
| _ROLL_ROT | 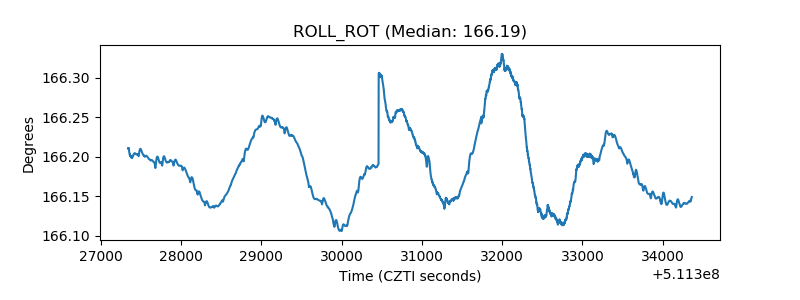 |
| _Roll_DEC | 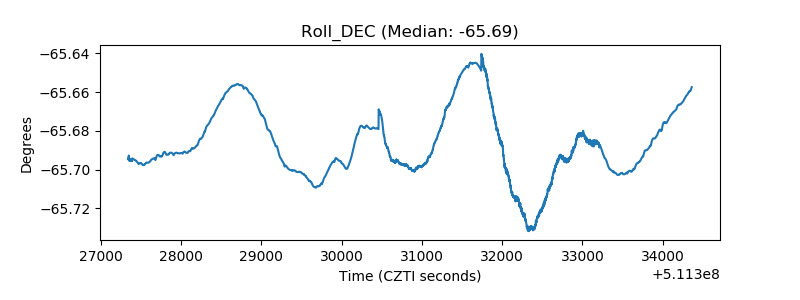 |
| _Roll_RA | 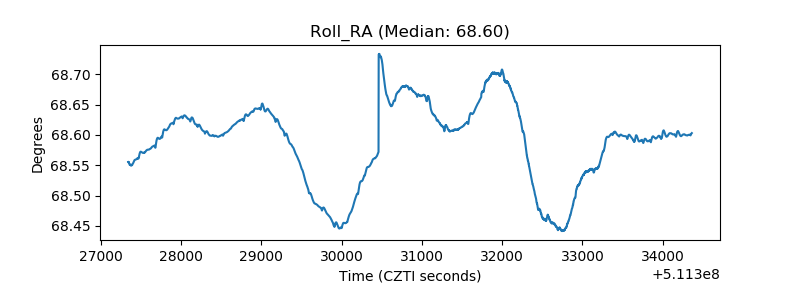 |
| Veto Counter | 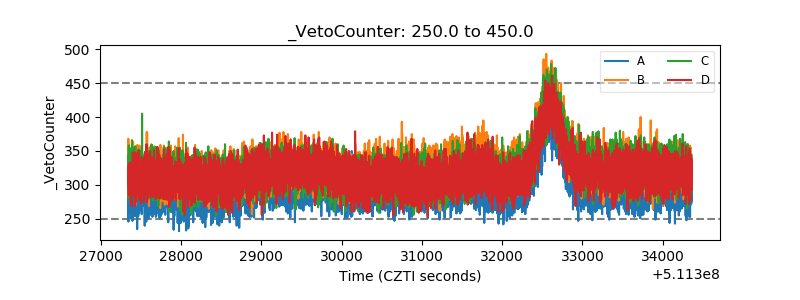 |