| Param | Original file | Final file |
|---|---|---|
| Filename | modeM0/AS1A14_083T06_9000006558_56617cztM0_level2.fits | modeM0/AS1A14_083T06_9000006558_56617cztM0_level2_quad_clean.evt |
| Size (bytes) | 1,147,861,440 | 261,777,600 |
| Size | 1.1 GB | 249.7 MB |
| Events in quadrant A | 9,314,673 | 1,707,714 |
| Events in quadrant B | 10,031,164 | 1,802,470 |
| Events in quadrant C | 10,135,520 | 1,625,185 |
| Events in quadrant D | 11,561,196 | 1,502,840 |
| Mode SS | |||
|---|---|---|---|
| Quadrant | BADHDUFLAG | Total packets | Discarded packets |
| A | 0 | 378 | 0 |
| B | 0 | 378 | 0 |
| C | 0 | 378 | 0 |
| D | 0 | 378 | 0 |
| Mode M9 | |||
|---|---|---|---|
| Quadrant | BADHDUFLAG | Total packets | Discarded packets |
| A | 0 | 10 | 0 |
| B | 0 | 10 | 0 |
| C | 0 | 10 | 0 |
| D | 0 | 10 | 0 |
| Mode M0 | |||
|---|---|---|---|
| Quadrant | BADHDUFLAG | Total packets | Discarded packets |
| A | 0 | 41277 | 2 |
| B | 0 | 42947 | 2 |
| C | 0 | 43462 | 2 |
| D | 0 | 47382 | 2 |
| Quadrant | Total seconds | Saturated seconds | Saturation percentage |
|---|---|---|---|
| A | 18682 | 396 | 2.119687% |
| B | 18683 | 691 | 3.698549% |
| C | 18683 | 411 | 2.199861% |
| D | 18683 | 660 | 3.532623% |
Noise dominated data is calculated using 1-second bins in cleaned event files. If a bin has >2000 counts, and if more than 50% of those come from <1% of pixels, then it is considered to be noise-dominated and hence unusable.
| Quadrant | # 1 sec bins | Bins with >0 counts | Bins with >2000 counts | High rate bins dominated by noise | Noise dominated (total time) | Noise dominated (detector-on time) | Marked lightcurve |
|---|---|---|---|---|---|---|---|
| A | 19672 | 18683 | 139 | 139 | 0.71% | 0.74% | 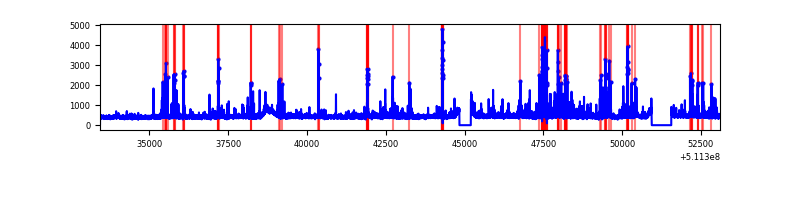 |
| B | 19673 | 18684 | 266 | 266 | 1.35% | 1.42% | 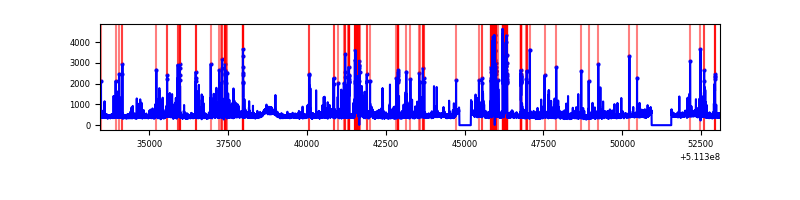 |
| C | 19673 | 18684 | 175 | 175 | 0.89% | 0.94% | 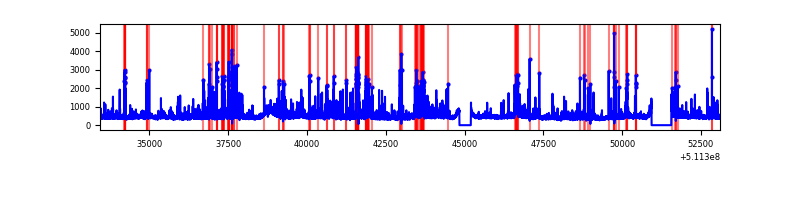 |
| D | 19673 | 18684 | 480 | 480 | 2.44% | 2.57% | 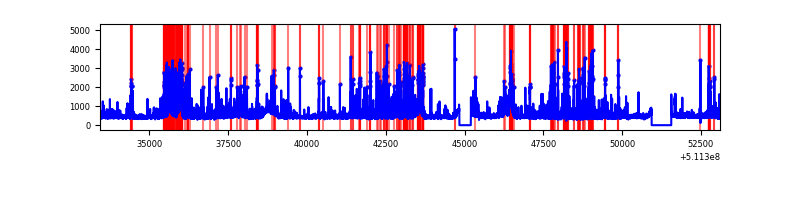 |
Top three noisy pixels from each quadrant. If the there are fewer than three noisy pixels in the level2.evt file, extra rows are filled as -1
| Pixel properties | Quadrant properties | ||||||
|---|---|---|---|---|---|---|---|
| Quadrant | DetID | PixID | Counts | Sigma | Mean | Median | Sigma |
| A | 4 | 249 | 834468 | 1706.64 | 1995 | 1944 | 487.8 |
| A | 10 | 251 | 245335 | 498.94 | 1995 | 1944 | 487.8 |
| A | 8 | 249 | 174402 | 353.53 | 1995 | 1944 | 487.8 |
| B | 8 | 128 | 673641 | 1600.32 | 1971 | 1896 | 419.8 |
| B | 0 | 231 | 632586 | 1502.52 | 1971 | 1896 | 419.8 |
| B | 4 | 21 | 186077 | 438.78 | 1971 | 1896 | 419.8 |
| C | 13 | 3 | 525529 | 986.72 | 1943 | 1927 | 530.6 |
| C | 15 | 178 | 394598 | 739.98 | 1943 | 1927 | 530.6 |
| C | 12 | 252 | 314811 | 589.62 | 1943 | 1927 | 530.6 |
| D | 2 | 249 | 945089 | 1754.53 | 1925 | 1837 | 537.6 |
| D | 3 | 12 | 585359 | 1085.4 | 1925 | 1837 | 537.6 |
| D | 2 | 31 | 442501 | 819.67 | 1925 | 1837 | 537.6 |
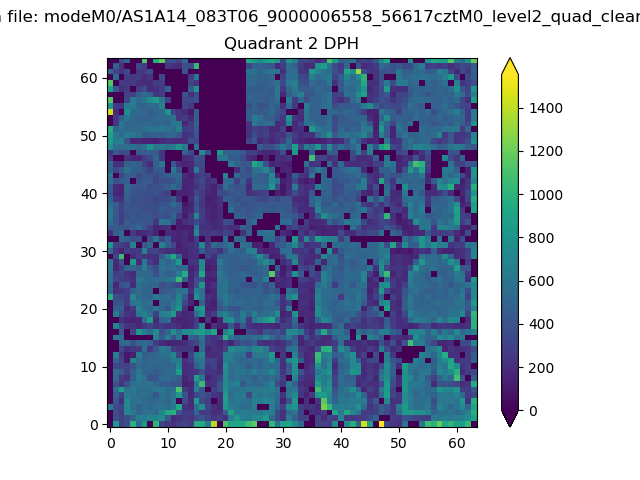
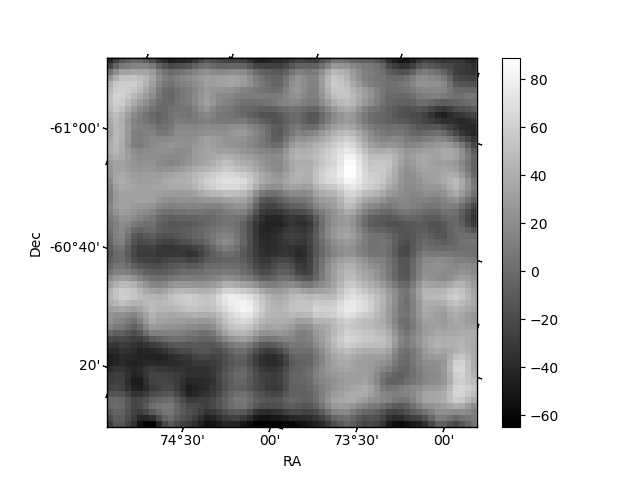
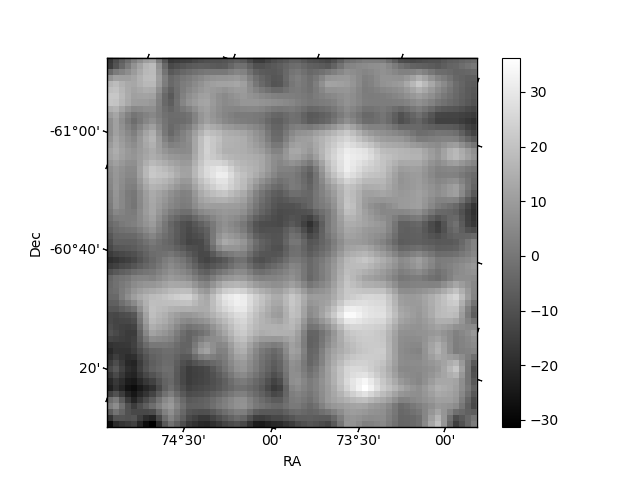
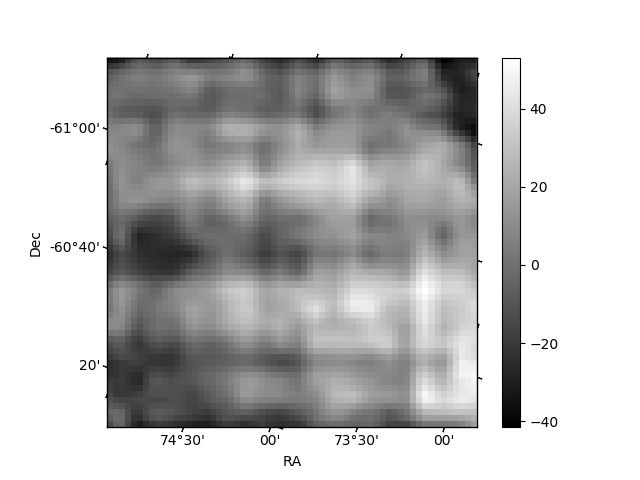
Histogram calculated using DETX and DETY for each event in the final _common_clean file
| Quadrant A | 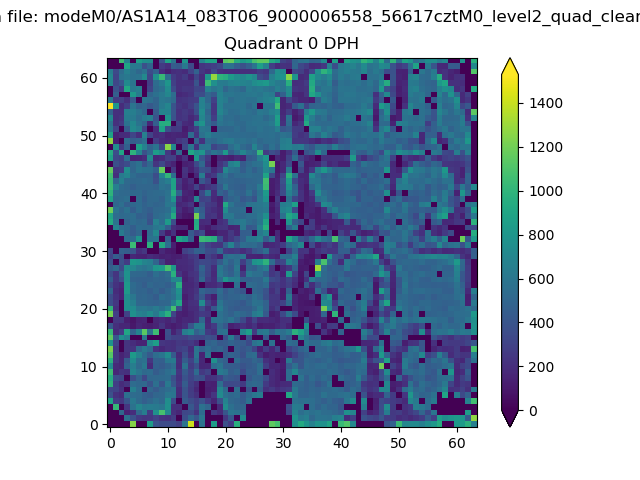 |
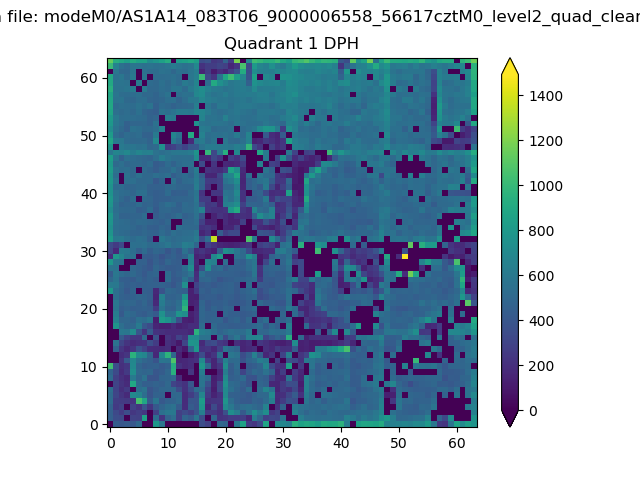 |
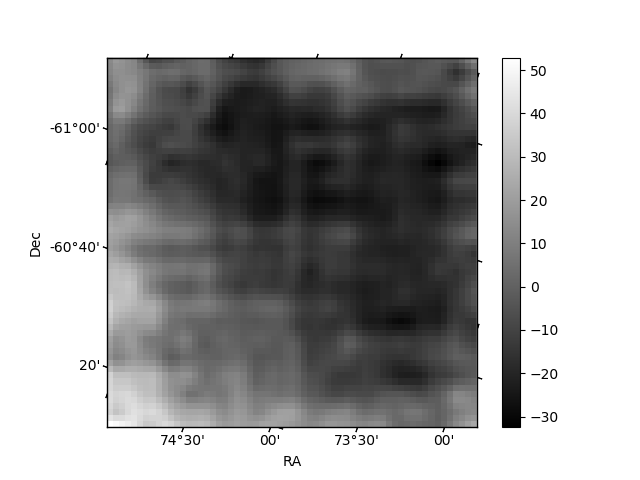
Quadrant B |
|---|---|---|---|
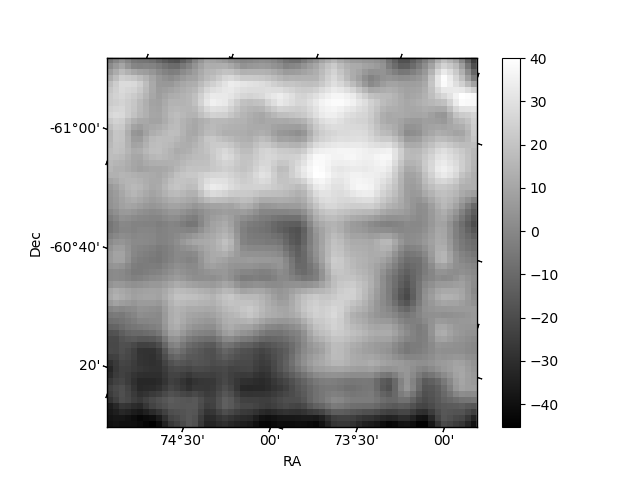
| Quadrant D | 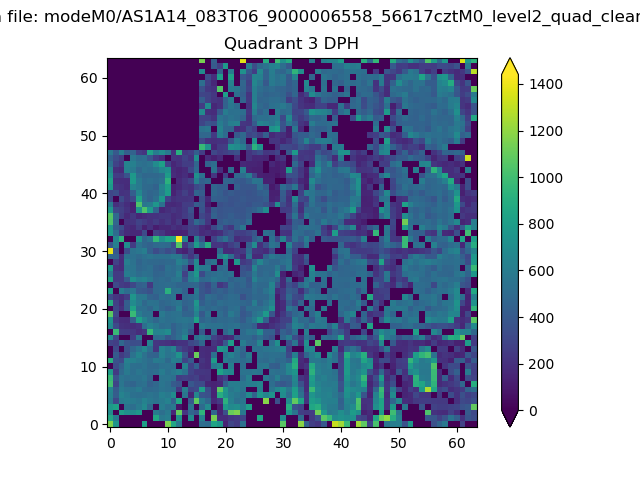 |
 |
Quadrant C |
| Plot type | Count rate plots | Images |
|---|---|---|
| Comparison with Poisson distribution Blue bars denote a histogram of data divided into 1 sec bins. Red curve is a Poisson curve with rate = median count rate of data. |
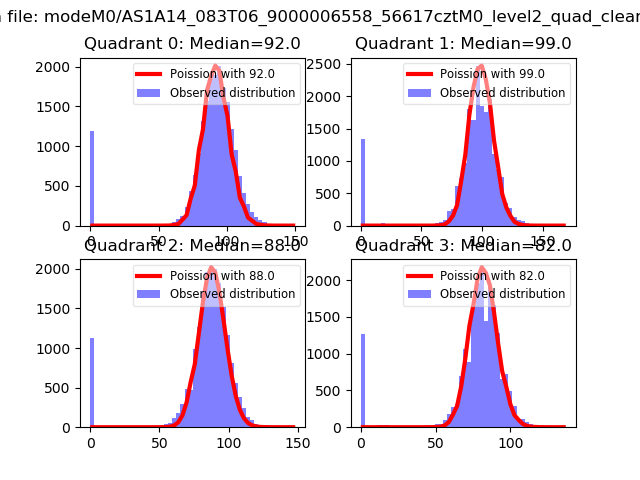 |
 |
| Quadrant-wise count rates Data is divided into 100 sec bins |
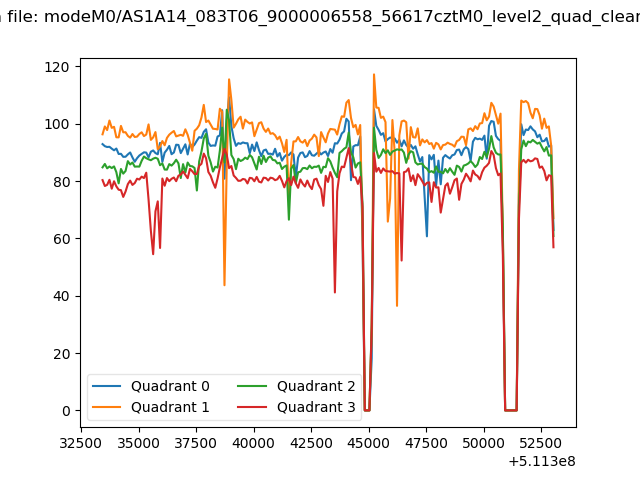 |
|
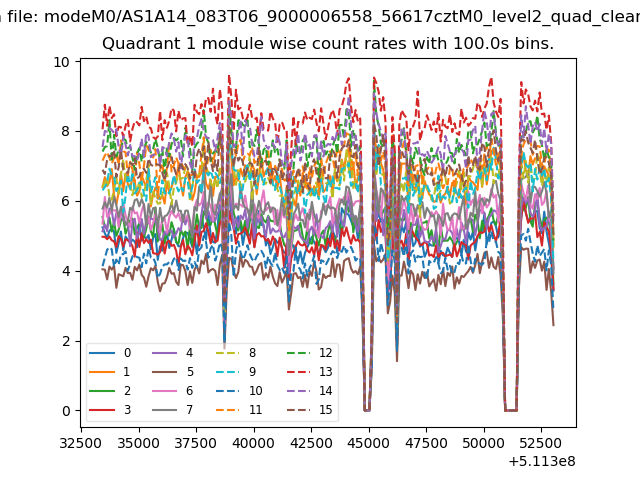
| Module-wise count rates for Quadrant A Data is divided into 100 sec bins |
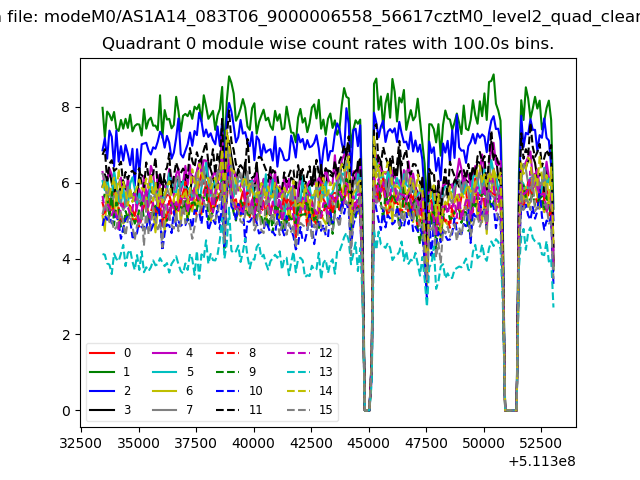 |
 |
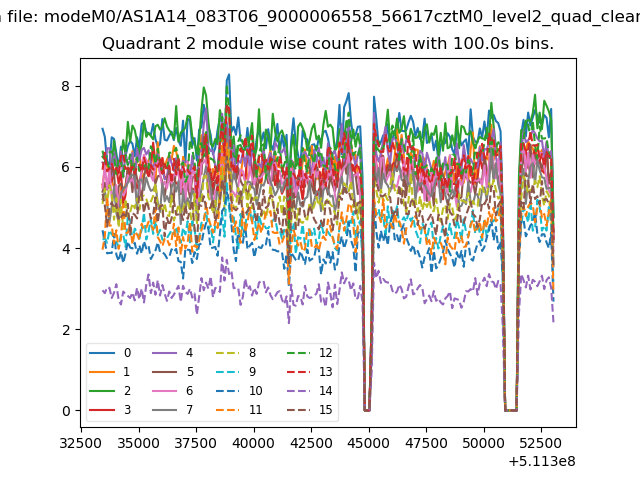
| Module-wise count rates for Quadrant B Data is divided into 100 sec bins |
 |
 |
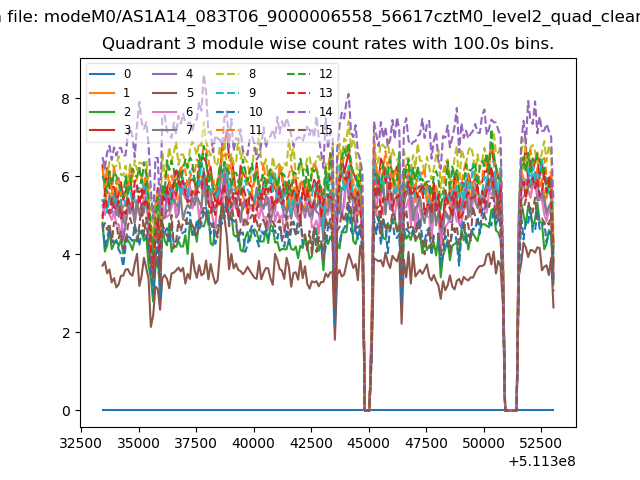
| Module-wise count rates for Quadrant C Data is divided into 100 sec bins |
 |
 |
| Module-wise count rates for Quadrant D Data is divided into 100 sec bins |
 |
 |
| Parameter | Plot |
|---|---|
| CZT HV Monitor | 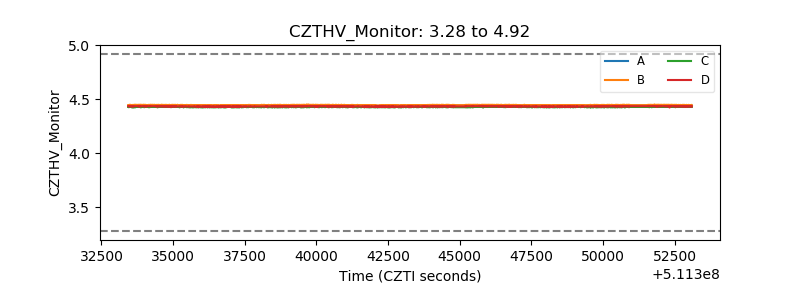 |
| D_VDD | 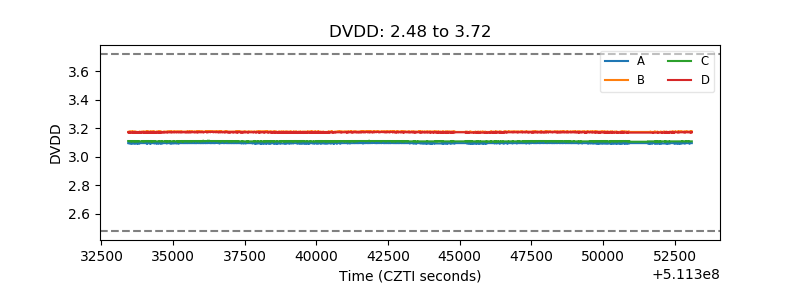 |
| Temperature 1 | 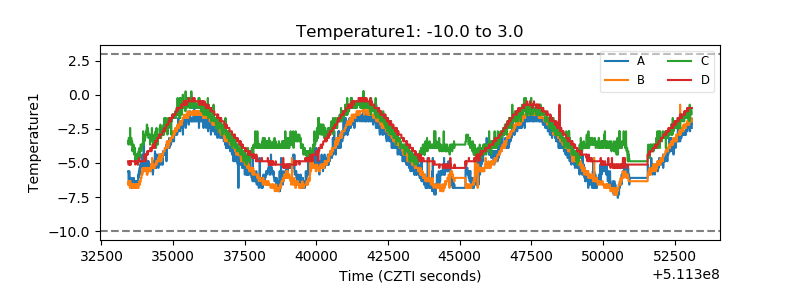 |
| Veto HV Monitor | 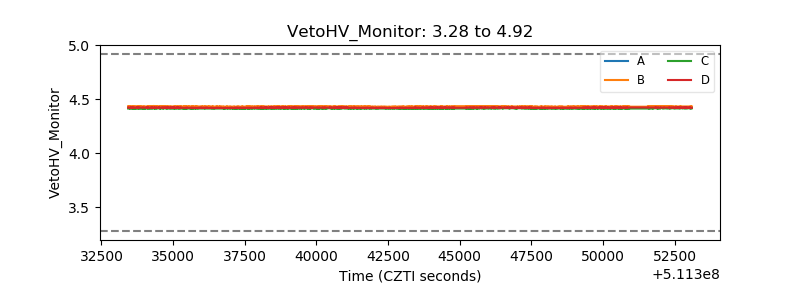 |
| Veto LLD | 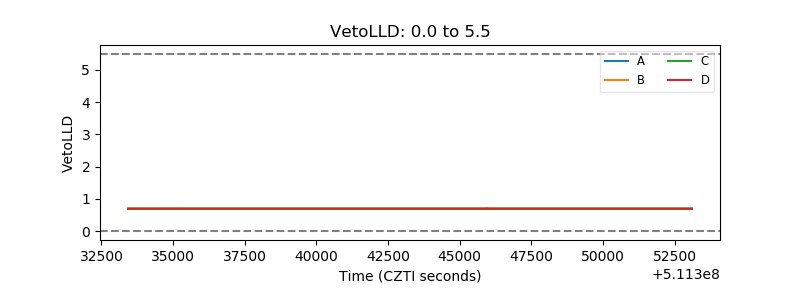 |
| Alpha Counter | 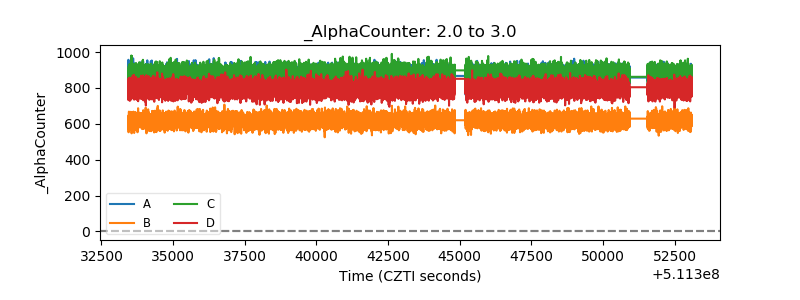 |
| _CPM_Rate | 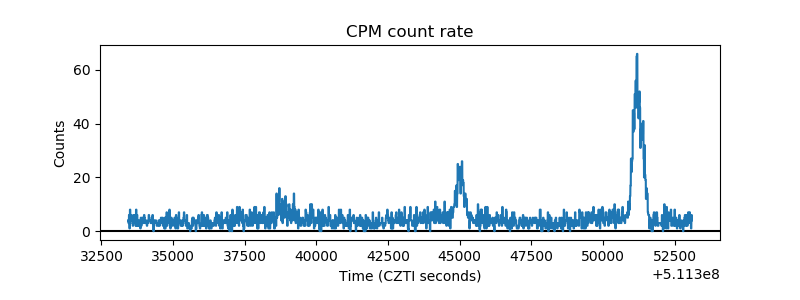 |
| CZT Counter | 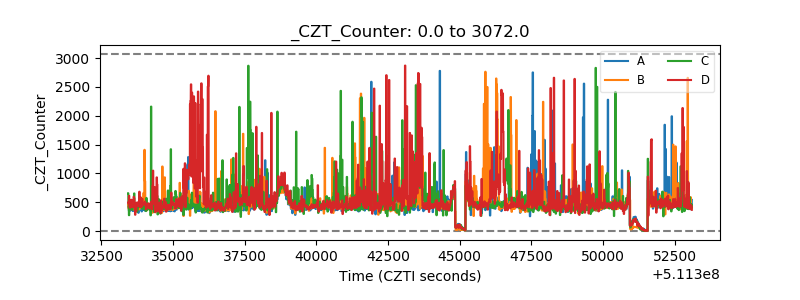 |
| +2.5 Volts monitor |  |
| +5 Volts monitor |  |
| _ROLL_ROT | 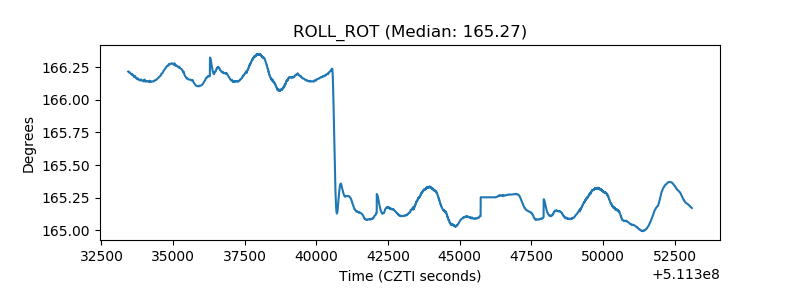 |
| _Roll_DEC | 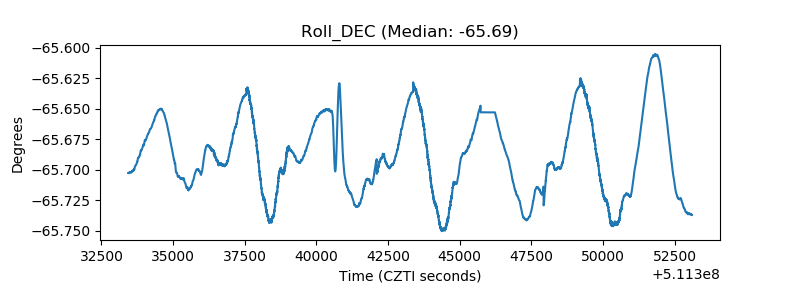 |
| _Roll_RA | 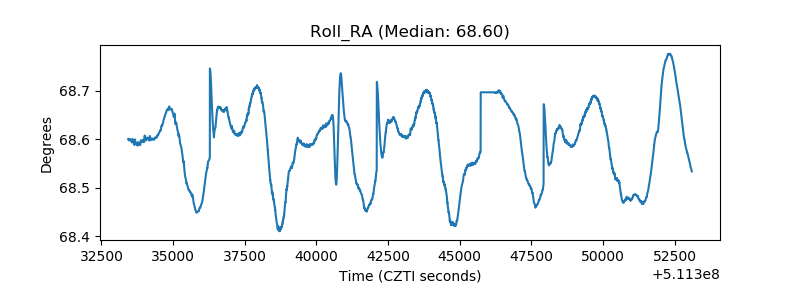 |
| Veto Counter | 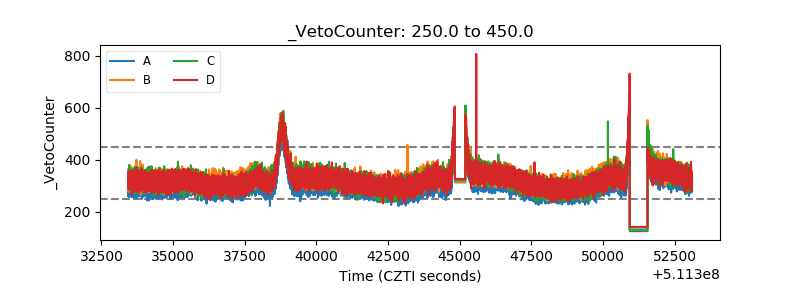 |