| Param | Original file | Final file |
|---|---|---|
| Filename | modeM0/AS1A14_083T06_9000006558_56620cztM0_level2.fits | modeM0/AS1A14_083T06_9000006558_56620cztM0_level2_quad_clean.evt |
| Size (bytes) | 383,097,600 | 86,771,520 |
| Size | 365.4 MB | 82.8 MB |
| Events in quadrant A | 2,915,235 | 568,434 |
| Events in quadrant B | 3,055,636 | 604,037 |
| Events in quadrant C | 4,268,038 | 532,043 |
| Events in quadrant D | 3,477,406 | 505,809 |
| Mode SS | |||
|---|---|---|---|
| Quadrant | BADHDUFLAG | Total packets | Discarded packets |
| A | 0 | 120 | 0 |
| B | 0 | 120 | 0 |
| C | 0 | 120 | 0 |
| D | 0 | 120 | 0 |
| Mode M9 | |||
|---|---|---|---|
| Quadrant | BADHDUFLAG | Total packets | Discarded packets |
| A | 0 | 10 | 0 |
| B | 0 | 10 | 0 |
| C | 0 | 10 | 0 |
| D | 0 | 10 | 0 |
| Mode M0 | |||
|---|---|---|---|
| Quadrant | BADHDUFLAG | Total packets | Discarded packets |
| A | 0 | 13178 | 1 |
| B | 0 | 13338 | 2 |
| C | 0 | 17012 | 1 |
| D | 0 | 14530 | 1 |
| Quadrant | Total seconds | Saturated seconds | Saturation percentage |
|---|---|---|---|
| A | 5975 | 57 | 0.953975% |
| B | 5975 | 94 | 1.573222% |
| C | 5975 | 135 | 2.259414% |
| D | 5975 | 119 | 1.991632% |
Noise dominated data is calculated using 1-second bins in cleaned event files. If a bin has >2000 counts, and if more than 50% of those come from <1% of pixels, then it is considered to be noise-dominated and hence unusable.
| Quadrant | # 1 sec bins | Bins with >0 counts | Bins with >2000 counts | High rate bins dominated by noise | Noise dominated (total time) | Noise dominated (detector-on time) | Marked lightcurve |
|---|---|---|---|---|---|---|---|
| A | 6960 | 5976 | 25 | 25 | 0.36% | 0.42% | 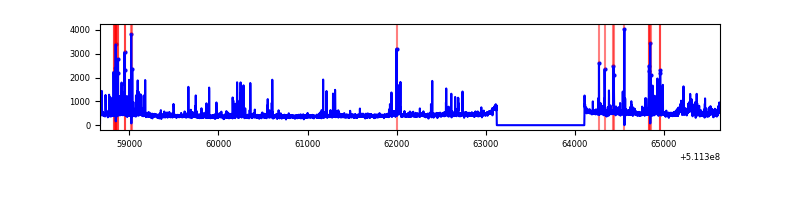 |
| B | 6960 | 5976 | 49 | 49 | 0.70% | 0.82% | 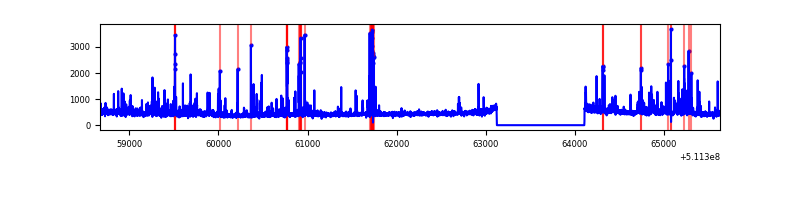 |
| C | 6960 | 5976 | 86 | 86 | 1.24% | 1.44% | 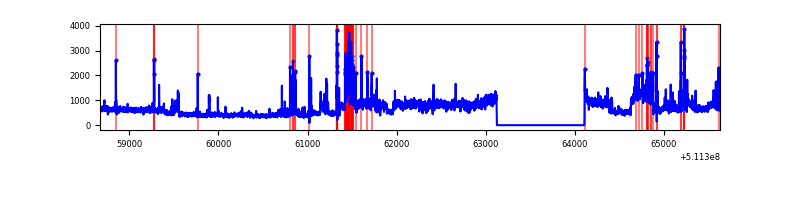 |
| D | 6960 | 5976 | 108 | 108 | 1.55% | 1.81% | 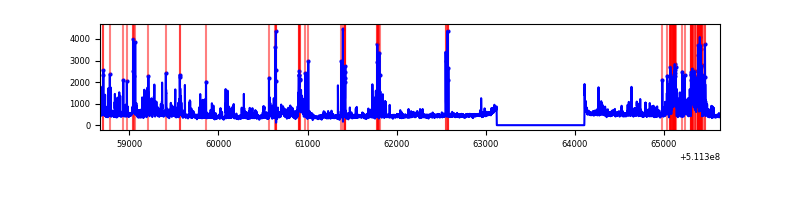 |
Top three noisy pixels from each quadrant. If the there are fewer than three noisy pixels in the level2.evt file, extra rows are filled as -1
| Pixel properties | Quadrant properties | ||||||
|---|---|---|---|---|---|---|---|
| Quadrant | DetID | PixID | Counts | Sigma | Mean | Median | Sigma |
| A | 13 | 248 | 150328 | 958.12 | 630 | 612 | 156.3 |
| A | 10 | 251 | 128918 | 821.1 | 630 | 612 | 156.3 |
| A | 4 | 249 | 105772 | 672.98 | 630 | 612 | 156.3 |
| B | 10 | 247 | 127053 | 943.05 | 622 | 600 | 134.1 |
| B | 8 | 128 | 106990 | 793.43 | 622 | 600 | 134.1 |
| B | 0 | 231 | 74032 | 547.63 | 622 | 600 | 134.1 |
| C | 1 | 16 | 1285837 | 7743.12 | 601 | 595 | 166.0 |
| C | 13 | 3 | 245468 | 1475.27 | 601 | 595 | 166.0 |
| C | 9 | 38 | 173860 | 1043.86 | 601 | 595 | 166.0 |
| D | 2 | 249 | 486771 | 2848.65 | 604 | 578 | 170.7 |
| D | 3 | 12 | 146956 | 857.64 | 604 | 578 | 170.7 |
| D | 6 | 239 | 143864 | 839.53 | 604 | 578 | 170.7 |
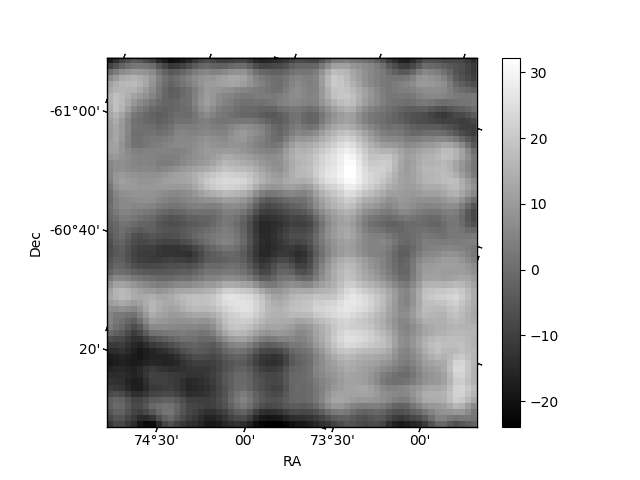
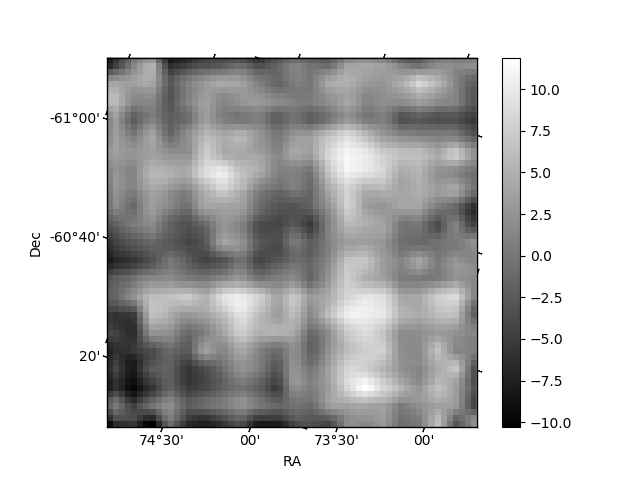
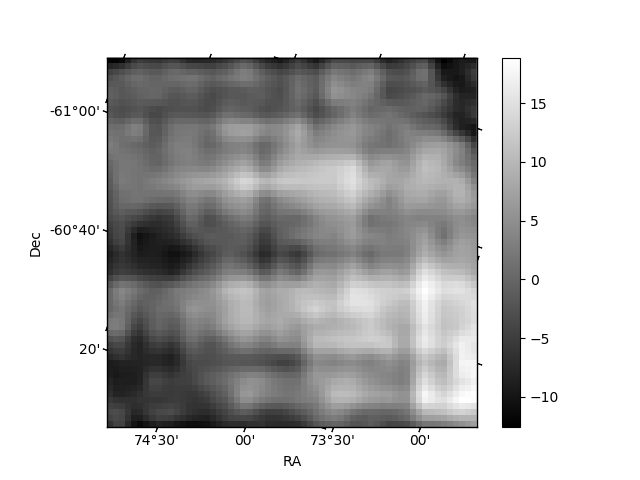
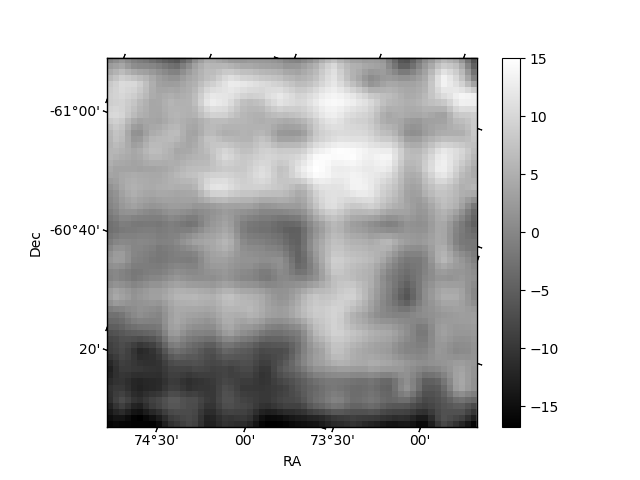
Histogram calculated using DETX and DETY for each event in the final _common_clean file
| Quadrant A | 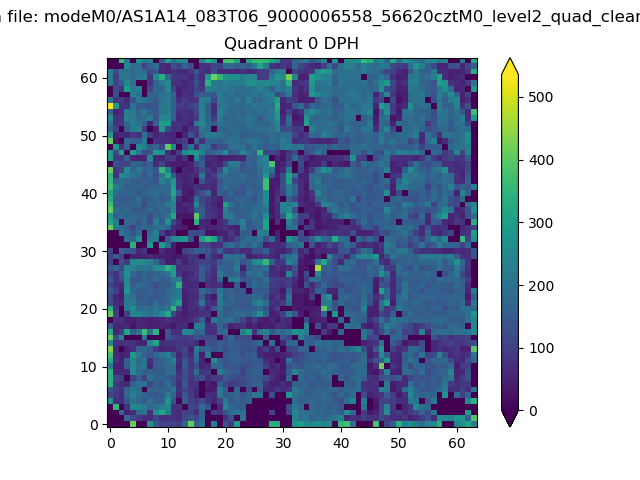 |
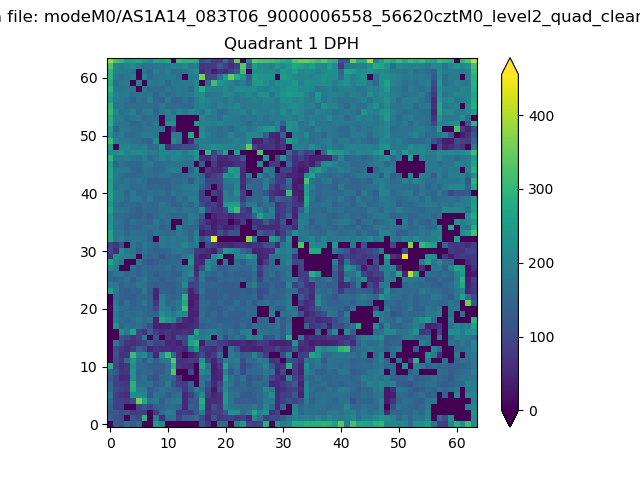 |
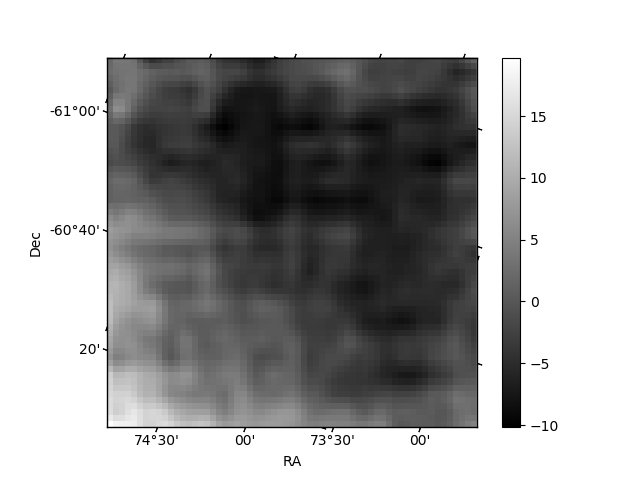
Quadrant B |
|---|---|---|---|
| Quadrant D | 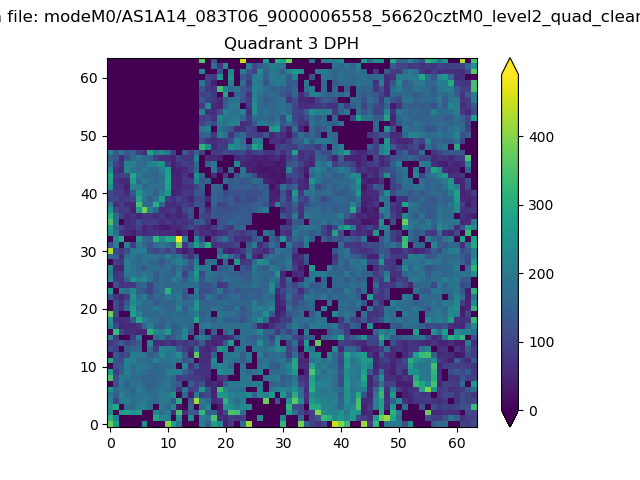 |
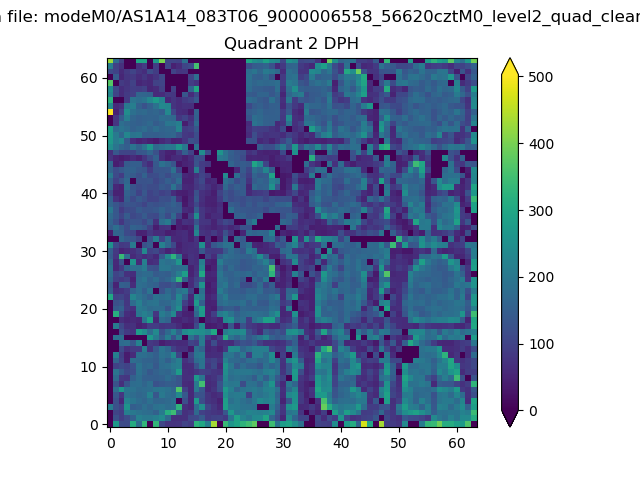 |
Quadrant C |
| Plot type | Count rate plots | Images |
|---|---|---|
| Comparison with Poisson distribution Blue bars denote a histogram of data divided into 1 sec bins. Red curve is a Poisson curve with rate = median count rate of data. |
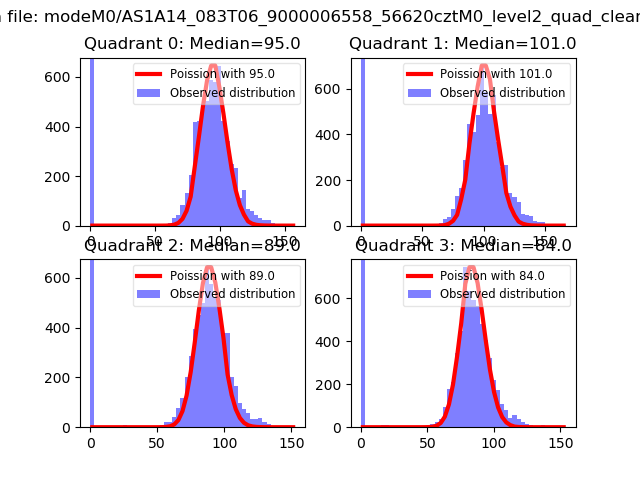 |
 |
| Quadrant-wise count rates Data is divided into 100 sec bins |
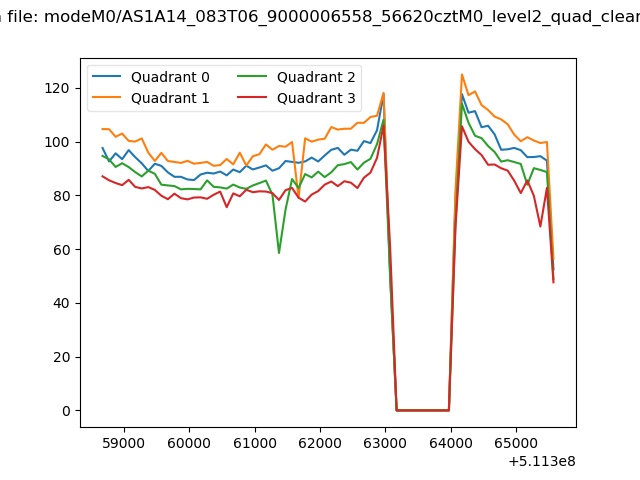 |
|
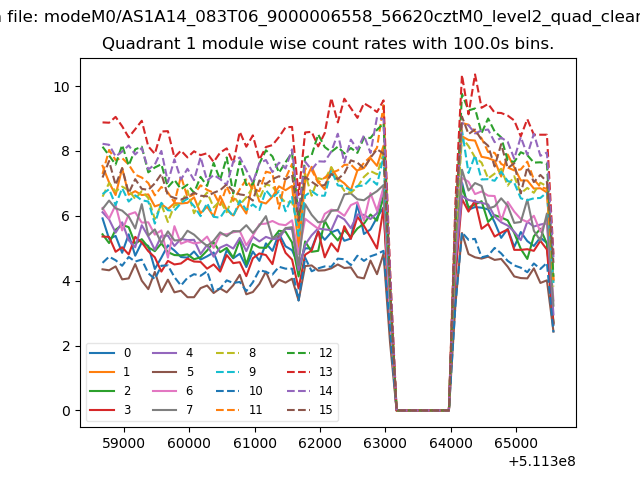
| Module-wise count rates for Quadrant A Data is divided into 100 sec bins |
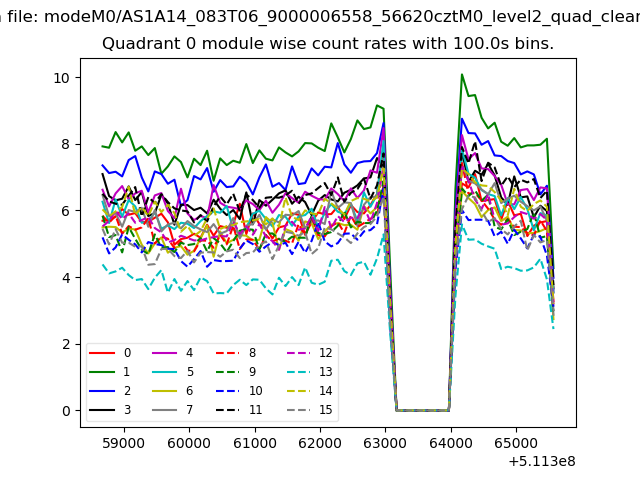 |
 |
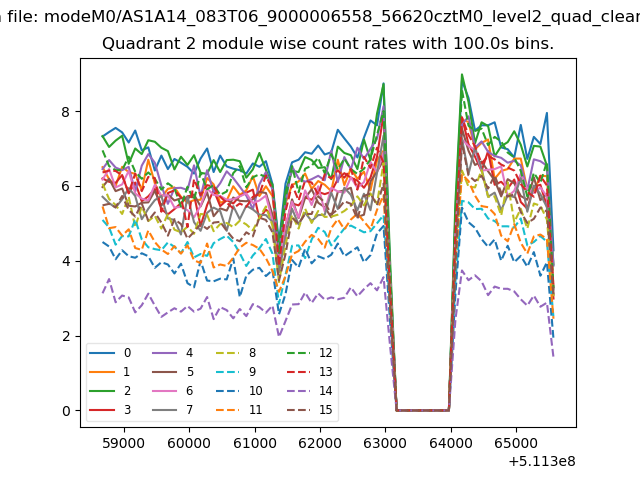
| Module-wise count rates for Quadrant B Data is divided into 100 sec bins |
 |
 |
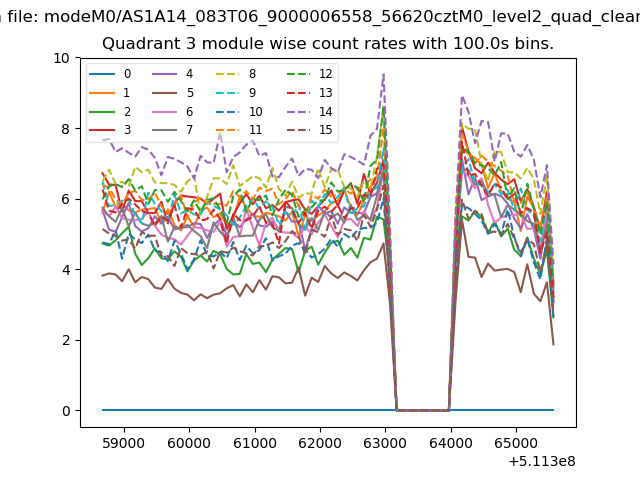
| Module-wise count rates for Quadrant C Data is divided into 100 sec bins |
 |
 |
| Module-wise count rates for Quadrant D Data is divided into 100 sec bins |
 |
 |
| Parameter | Plot |
|---|---|
| CZT HV Monitor | 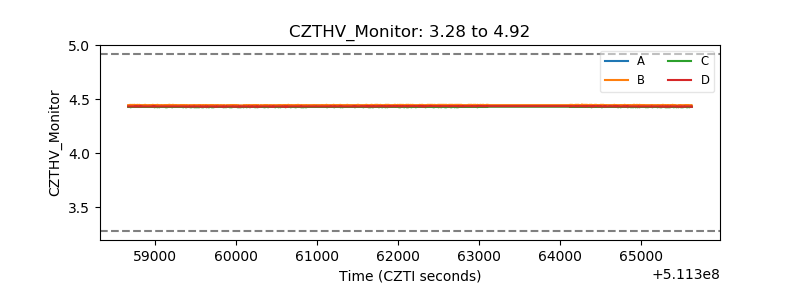 |
| D_VDD | 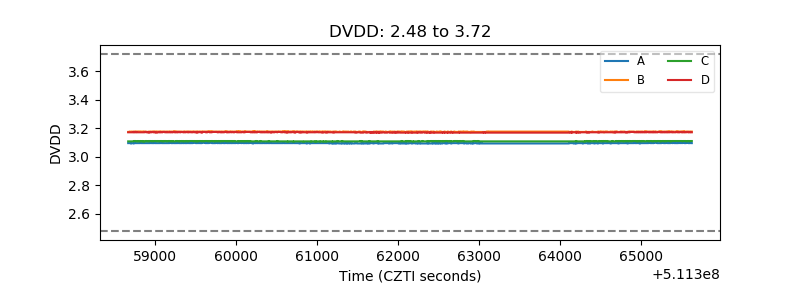 |
| Temperature 1 | 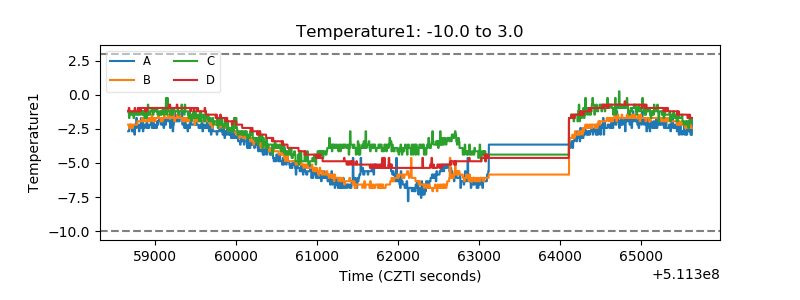 |
| Veto HV Monitor |  |
| Veto LLD | 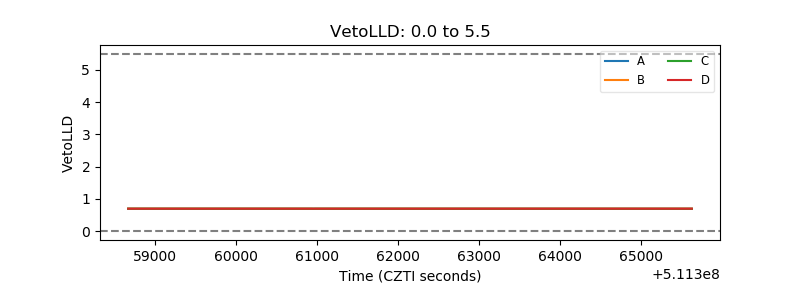 |
| Alpha Counter | 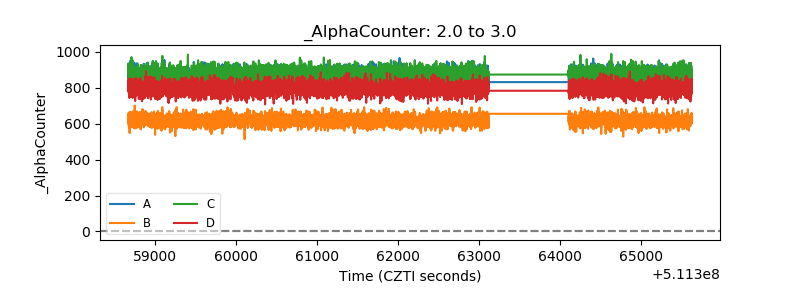 |
| _CPM_Rate | 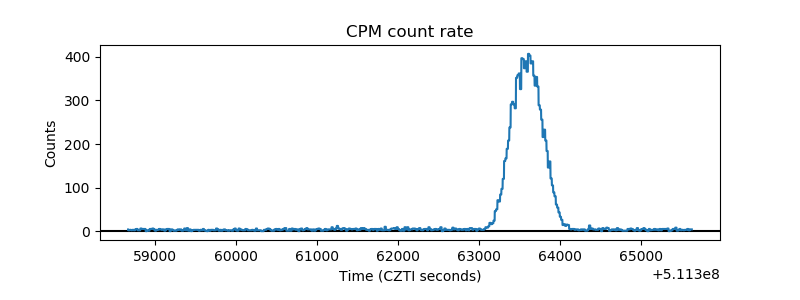 |
| CZT Counter | 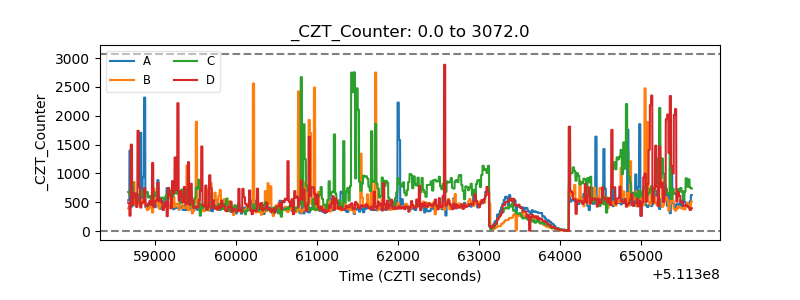 |
| +2.5 Volts monitor |  |
| +5 Volts monitor |  |
| _ROLL_ROT | 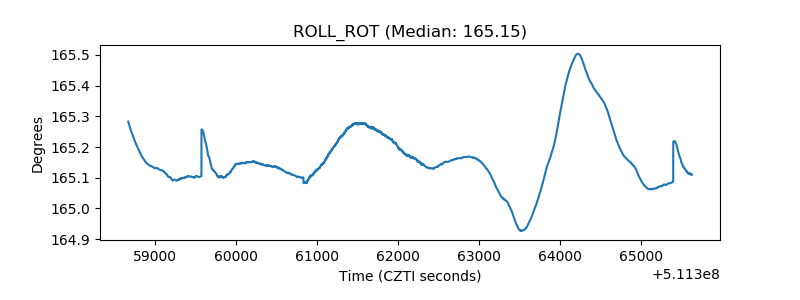 |
| _Roll_DEC | 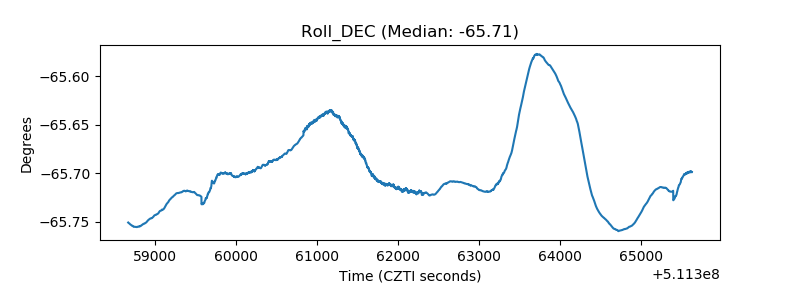 |
| _Roll_RA | 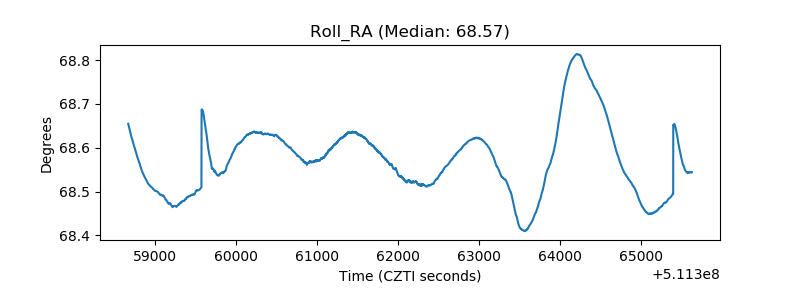 |
| Veto Counter | 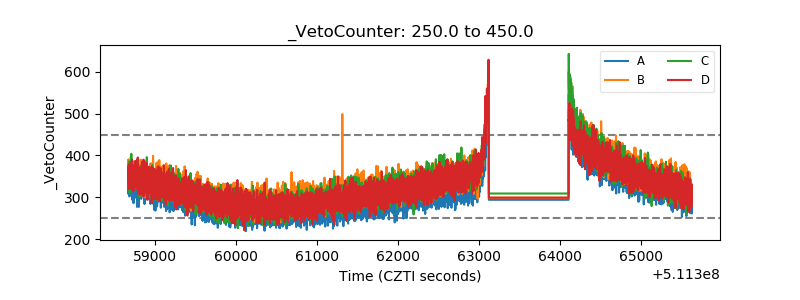 |