| Param | Original file | Final file |
|---|---|---|
| Filename | modeM0/AS1A14_083T06_9000006558_56622cztM0_level2.fits | modeM0/AS1A14_083T06_9000006558_56622cztM0_level2_quad_clean.evt |
| Size (bytes) | 405,273,600 | 89,881,920 |
| Size | 386.5 MB | 85.7 MB |
| Events in quadrant A | 3,849,655 | 584,166 |
| Events in quadrant B | 3,329,416 | 641,209 |
| Events in quadrant C | 3,072,566 | 565,597 |
| Events in quadrant D | 4,274,490 | 503,813 |
| Mode SS | |||
|---|---|---|---|
| Quadrant | BADHDUFLAG | Total packets | Discarded packets |
| A | 0 | 124 | 0 |
| B | 0 | 124 | 0 |
| C | 0 | 124 | 0 |
| D | 0 | 124 | 0 |
| Mode M9 | |||
|---|---|---|---|
| Quadrant | BADHDUFLAG | Total packets | Discarded packets |
| A | 0 | 11 | 0 |
| B | 0 | 11 | 0 |
| C | 0 | 11 | 0 |
| D | 0 | 11 | 0 |
| Mode M0 | |||
|---|---|---|---|
| Quadrant | BADHDUFLAG | Total packets | Discarded packets |
| A | 0 | 15677 | 1 |
| B | 0 | 14152 | 1 |
| C | 0 | 13644 | 1 |
| D | 0 | 17109 | 1 |
| Quadrant | Total seconds | Saturated seconds | Saturation percentage |
|---|---|---|---|
| A | 6113 | 259 | 4.236872% |
| B | 6114 | 146 | 2.387962% |
| C | 6114 | 45 | 0.736016% |
| D | 6114 | 415 | 6.787700% |
Noise dominated data is calculated using 1-second bins in cleaned event files. If a bin has >2000 counts, and if more than 50% of those come from <1% of pixels, then it is considered to be noise-dominated and hence unusable.
| Quadrant | # 1 sec bins | Bins with >0 counts | Bins with >2000 counts | High rate bins dominated by noise | Noise dominated (total time) | Noise dominated (detector-on time) | Marked lightcurve |
|---|---|---|---|---|---|---|---|
| A | 7228 | 6114 | 153 | 153 | 2.12% | 2.50% | 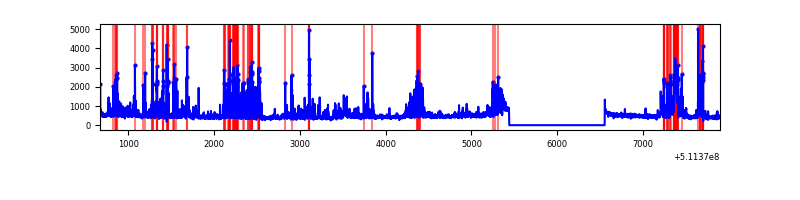 |
| B | 7229 | 6115 | 49 | 49 | 0.68% | 0.80% | 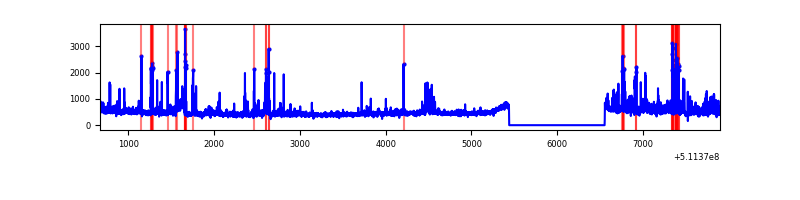 |
| C | 7229 | 6115 | 25 | 25 | 0.35% | 0.41% | 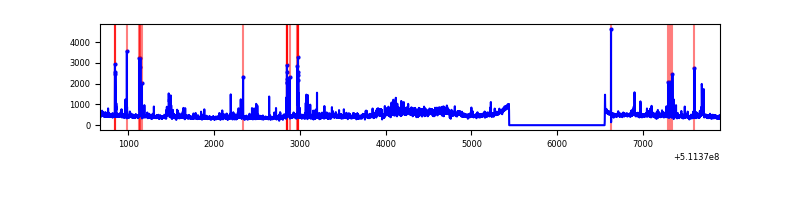 |
| D | 7229 | 6115 | 315 | 315 | 4.36% | 5.15% | 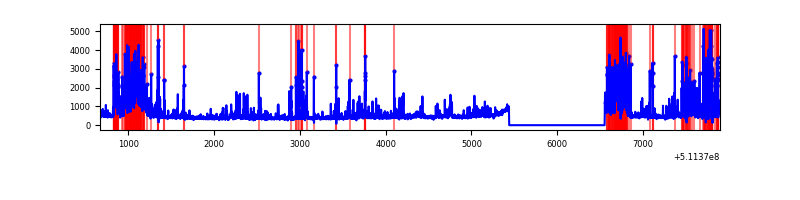 |
Top three noisy pixels from each quadrant. If the there are fewer than three noisy pixels in the level2.evt file, extra rows are filled as -1
| Pixel properties | Quadrant properties | ||||||
|---|---|---|---|---|---|---|---|
| Quadrant | DetID | PixID | Counts | Sigma | Mean | Median | Sigma |
| A | 7 | 64 | 539641 | 3304.63 | 656 | 638 | 163.1 |
| A | 10 | 251 | 326941 | 2000.56 | 656 | 638 | 163.1 |
| A | 4 | 95 | 204725 | 1251.26 | 656 | 638 | 163.1 |
| B | 0 | 213 | 234312 | 1673.59 | 656 | 635 | 139.6 |
| B | 0 | 231 | 112015 | 797.7 | 656 | 635 | 139.6 |
| B | 4 | 21 | 109613 | 780.5 | 656 | 635 | 139.6 |
| C | 1 | 16 | 270728 | 1561.75 | 632 | 625 | 172.9 |
| C | 6 | 223 | 127288 | 732.37 | 632 | 625 | 172.9 |
| C | 9 | 38 | 35544 | 201.9 | 632 | 625 | 172.9 |
| D | 2 | 249 | 896351 | 5118.92 | 615 | 586 | 175.0 |
| D | 6 | 239 | 459560 | 2622.84 | 615 | 586 | 175.0 |
| D | 7 | 96 | 279702 | 1595.03 | 615 | 586 | 175.0 |
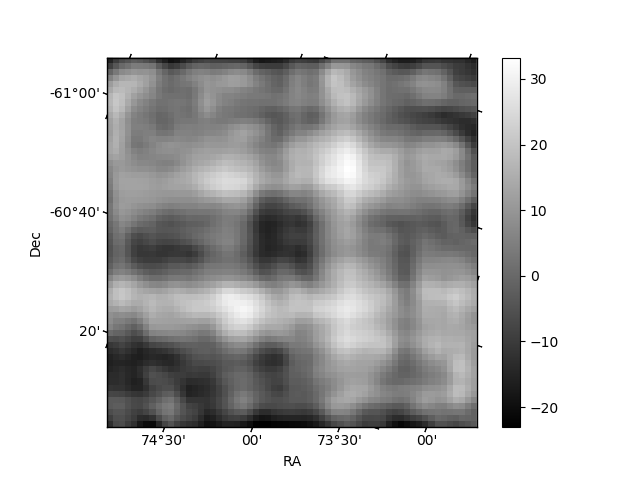
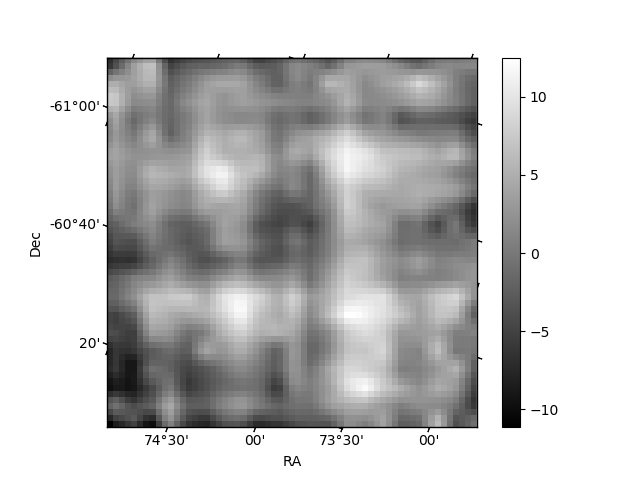
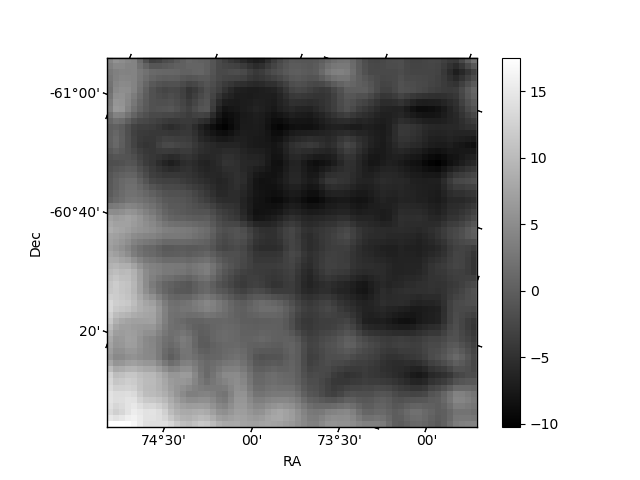
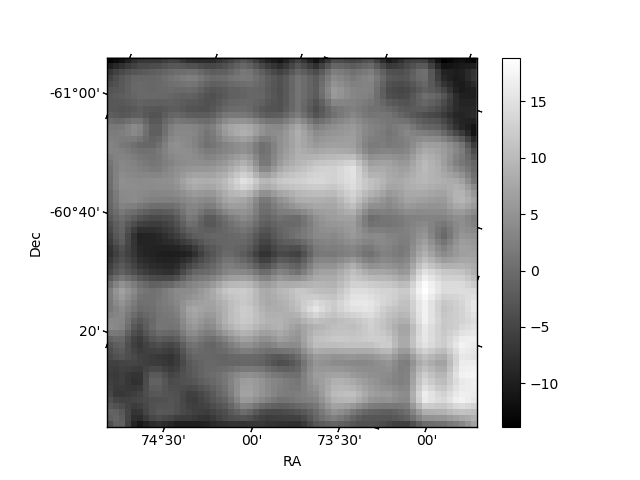
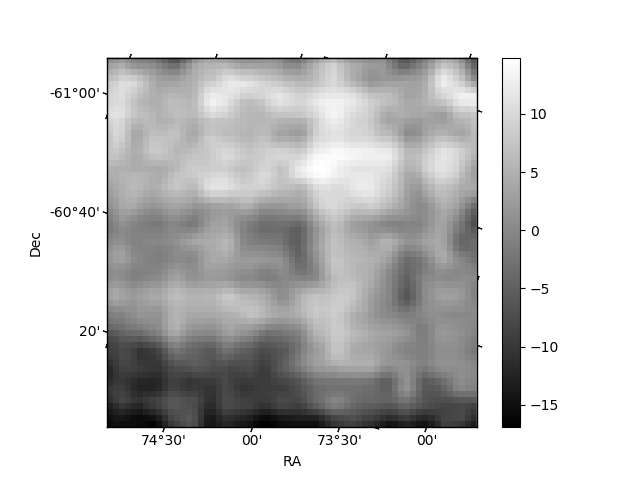
Histogram calculated using DETX and DETY for each event in the final _common_clean file
| Quadrant A | 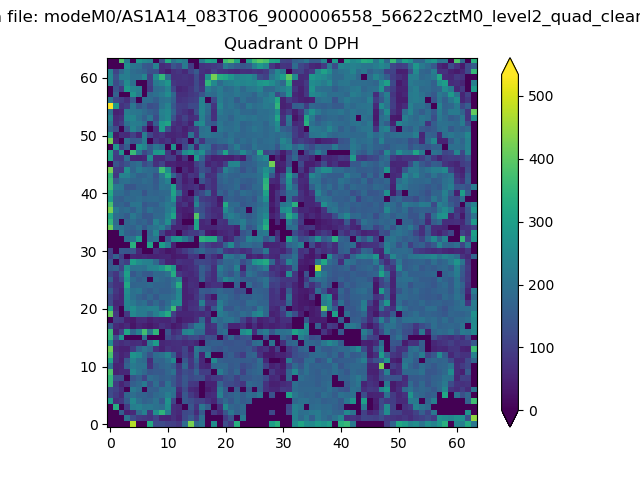 |
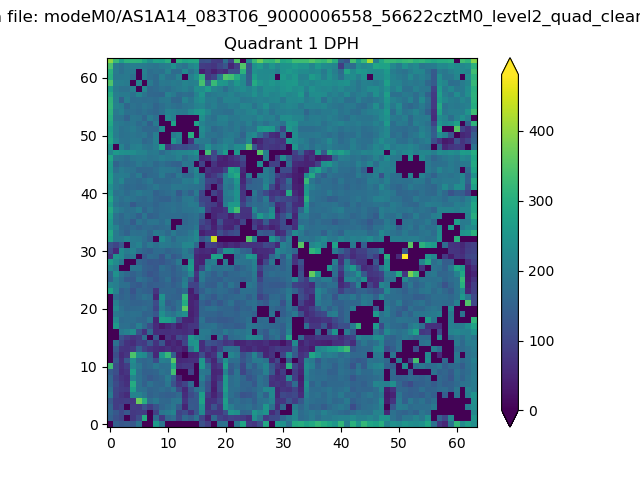 |
Quadrant B |
|---|---|---|---|
| Quadrant D | 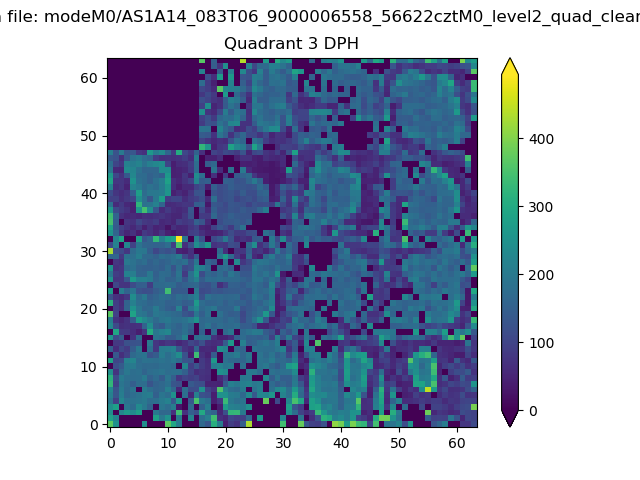 |
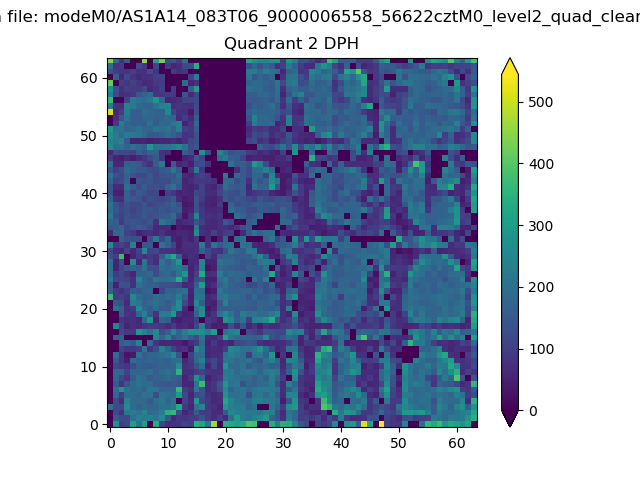 |
Quadrant C |
| Plot type | Count rate plots | Images |
|---|---|---|
| Comparison with Poisson distribution Blue bars denote a histogram of data divided into 1 sec bins. Red curve is a Poisson curve with rate = median count rate of data. |
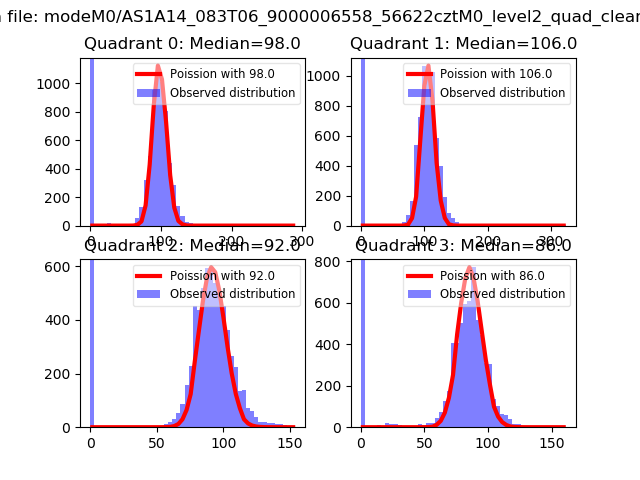 |
 |
| Quadrant-wise count rates Data is divided into 100 sec bins |
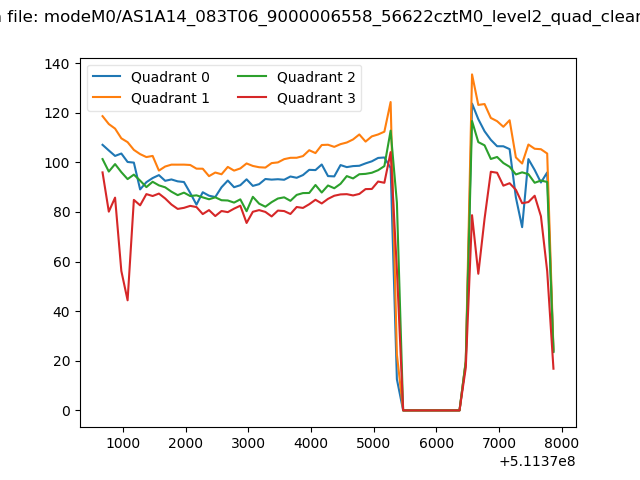 |
|
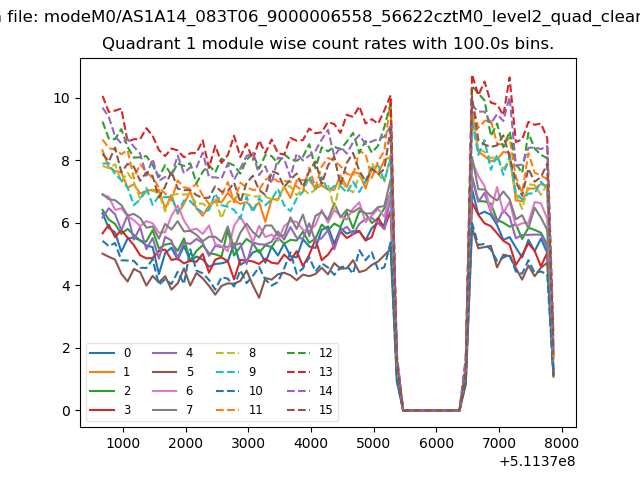
| Module-wise count rates for Quadrant A Data is divided into 100 sec bins |
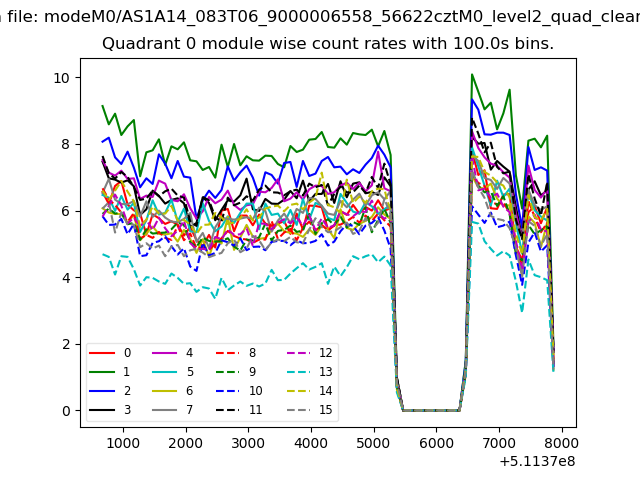 |
 |
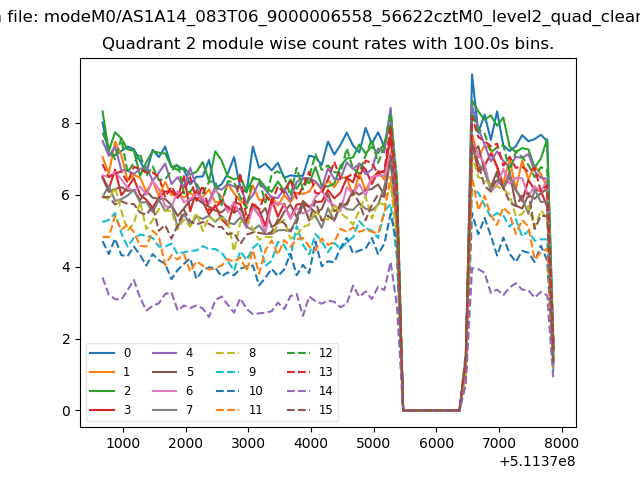
| Module-wise count rates for Quadrant B Data is divided into 100 sec bins |
 |
 |
| Module-wise count rates for Quadrant C Data is divided into 100 sec bins |
 |
 |
| Module-wise count rates for Quadrant D Data is divided into 100 sec bins |
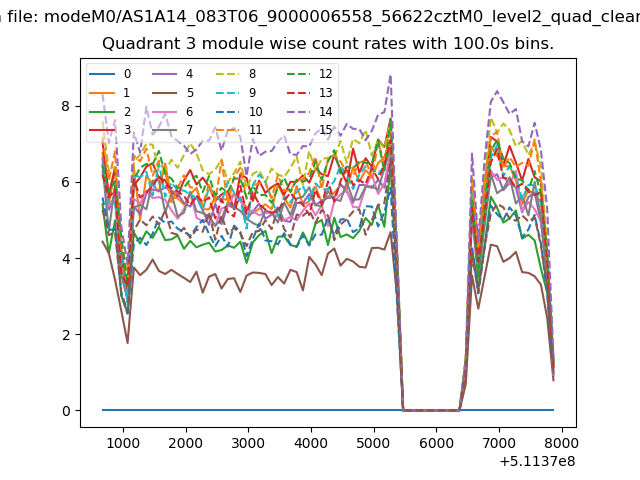 |
 |
| Parameter | Plot |
|---|---|
| CZT HV Monitor | 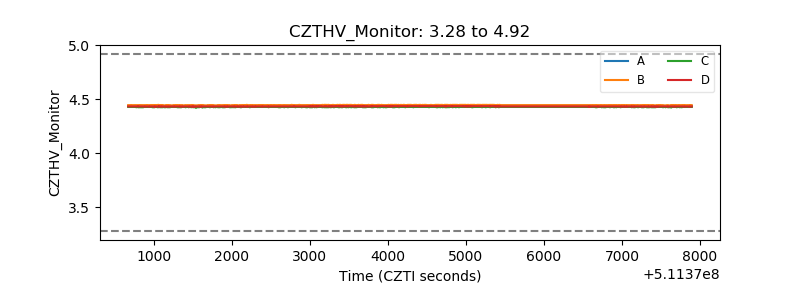 |
| D_VDD | 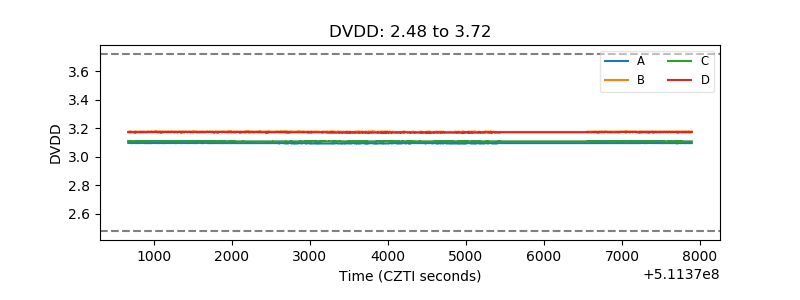 |
| Temperature 1 | 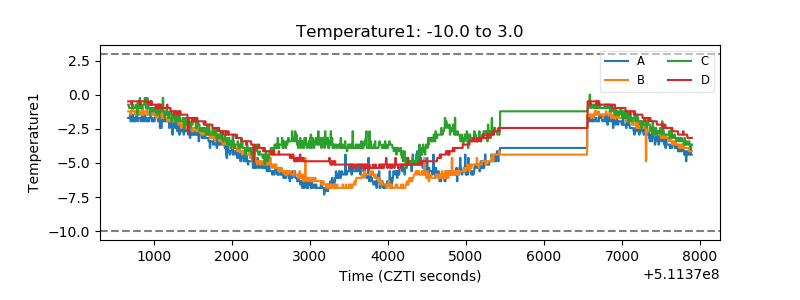 |
| Veto HV Monitor | 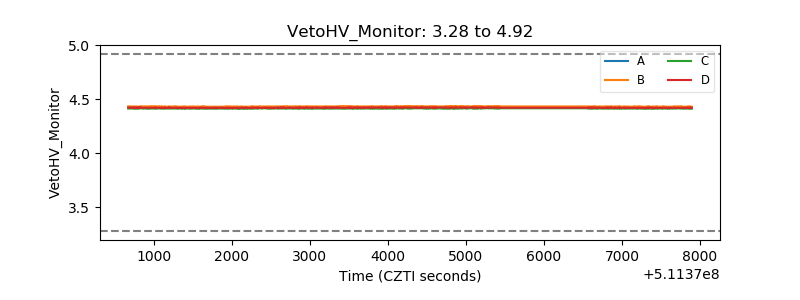 |
| Veto LLD | 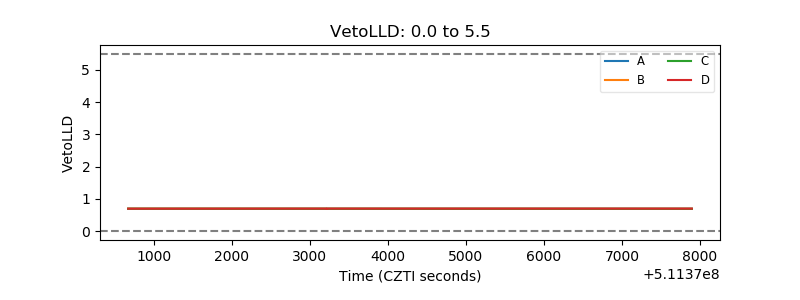 |
| Alpha Counter | 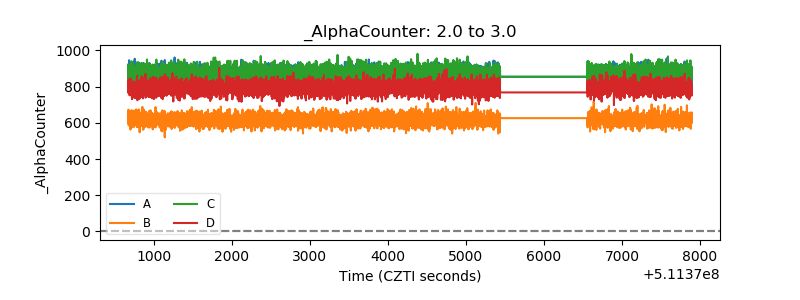 |
| _CPM_Rate | 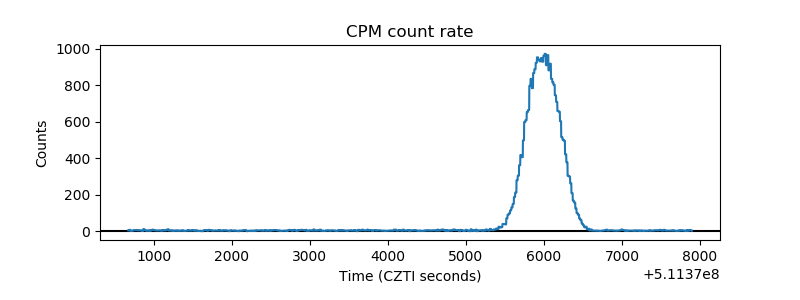 |
| CZT Counter | 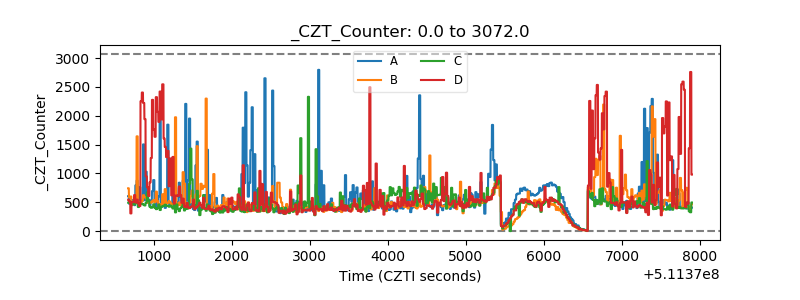 |
| +2.5 Volts monitor |  |
| +5 Volts monitor |  |
| _ROLL_ROT | 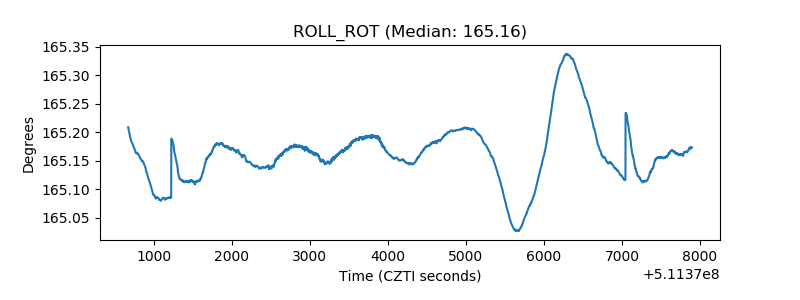 |
| _Roll_DEC | 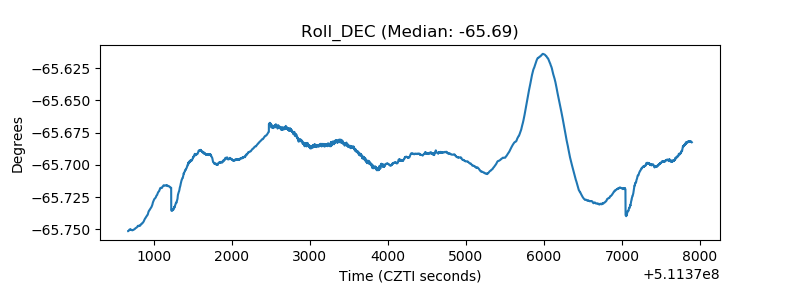 |
| _Roll_RA | 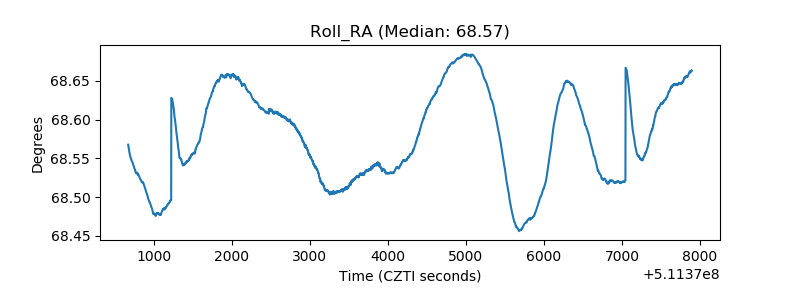 |
| Veto Counter | 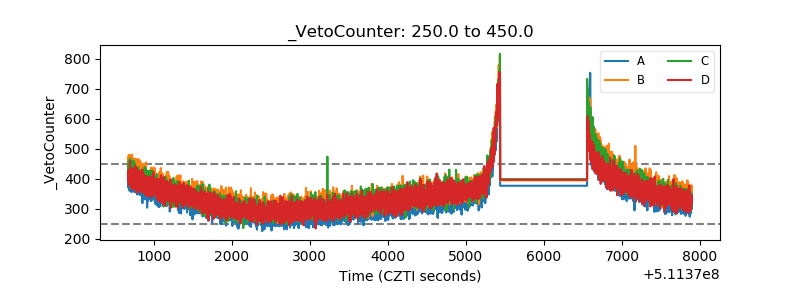 |