| Param | Original file | Final file |
|---|---|---|
| Filename | modeM0/AS1A14_083T06_9000006558_56623cztM0_level2.fits | modeM0/AS1A14_083T06_9000006558_56623cztM0_level2_quad_clean.evt |
| Size (bytes) | 424,431,360 | 94,538,880 |
| Size | 404.8 MB | 90.2 MB |
| Events in quadrant A | 3,994,396 | 598,087 |
| Events in quadrant B | 3,791,341 | 679,907 |
| Events in quadrant C | 3,215,027 | 596,505 |
| Events in quadrant D | 4,213,039 | 541,986 |
| Mode SS | |||
|---|---|---|---|
| Quadrant | BADHDUFLAG | Total packets | Discarded packets |
| A | 0 | 130 | 0 |
| B | 0 | 130 | 0 |
| C | 0 | 130 | 0 |
| D | 0 | 130 | 0 |
| Mode M9 | |||
|---|---|---|---|
| Quadrant | BADHDUFLAG | Total packets | Discarded packets |
| A | 0 | 14 | 0 |
| B | 0 | 14 | 0 |
| C | 0 | 15 | 0 |
| D | 0 | 15 | 0 |
| Mode M0 | |||
|---|---|---|---|
| Quadrant | BADHDUFLAG | Total packets | Discarded packets |
| A | 0 | 16622 | 2 |
| B | 0 | 15699 | 2 |
| C | 0 | 14239 | 2 |
| D | 0 | 17150 | 2 |
| Quadrant | Total seconds | Saturated seconds | Saturation percentage |
|---|---|---|---|
| A | 6392 | 438 | 6.852315% |
| B | 6392 | 184 | 2.878598% |
| C | 6392 | 72 | 1.126408% |
| D | 6392 | 284 | 4.443054% |
Noise dominated data is calculated using 1-second bins in cleaned event files. If a bin has >2000 counts, and if more than 50% of those come from <1% of pixels, then it is considered to be noise-dominated and hence unusable.
| Quadrant | # 1 sec bins | Bins with >0 counts | Bins with >2000 counts | High rate bins dominated by noise | Noise dominated (total time) | Noise dominated (detector-on time) | Marked lightcurve |
|---|---|---|---|---|---|---|---|
| A | 7597 | 6393 | 389 | 389 | 5.12% | 6.08% | 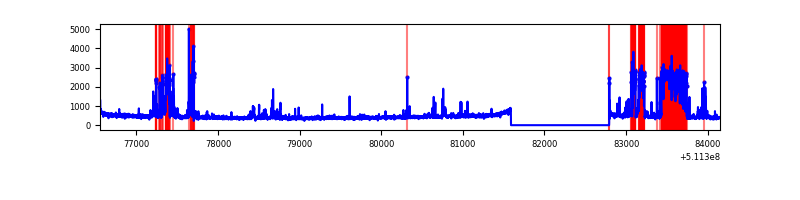 |
| B | 7597 | 6393 | 90 | 90 | 1.18% | 1.41% | 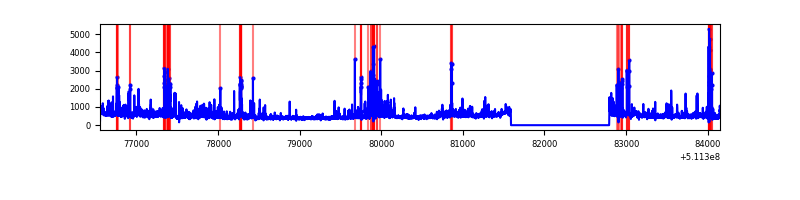 |
| C | 7597 | 6393 | 66 | 66 | 0.87% | 1.03% | 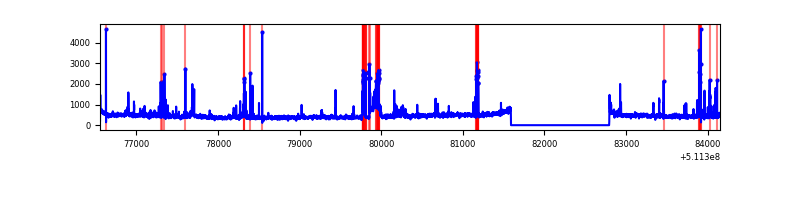 |
| D | 7597 | 6393 | 225 | 225 | 2.96% | 3.52% | 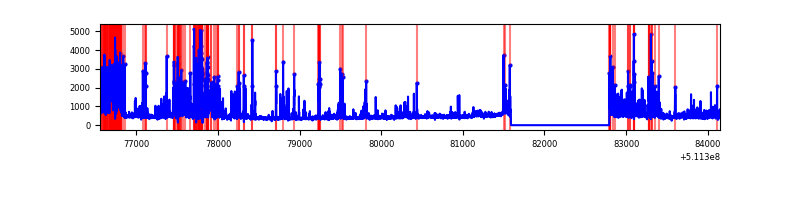 |
Top three noisy pixels from each quadrant. If the there are fewer than three noisy pixels in the level2.evt file, extra rows are filled as -1
| Pixel properties | Quadrant properties | ||||||
|---|---|---|---|---|---|---|---|
| Quadrant | DetID | PixID | Counts | Sigma | Mean | Median | Sigma |
| A | 4 | 95 | 1107735 | 6571.83 | 679 | 661 | 168.5 |
| A | 4 | 249 | 83697 | 492.92 | 679 | 661 | 168.5 |
| A | 3 | 62 | 75604 | 444.88 | 679 | 661 | 168.5 |
| B | 0 | 231 | 240626 | 1637.04 | 687 | 664 | 146.6 |
| B | 5 | 185 | 229020 | 1557.87 | 687 | 664 | 146.6 |
| B | 0 | 213 | 155014 | 1052.99 | 687 | 664 | 146.6 |
| C | 9 | 38 | 193802 | 1069.87 | 660 | 652 | 180.5 |
| C | 1 | 16 | 141876 | 782.25 | 660 | 652 | 180.5 |
| C | 6 | 223 | 106679 | 587.29 | 660 | 652 | 180.5 |
| D | 6 | 239 | 758947 | 4099.64 | 645 | 615 | 185.0 |
| D | 2 | 249 | 404362 | 2182.71 | 645 | 615 | 185.0 |
| D | 7 | 96 | 214975 | 1158.86 | 645 | 615 | 185.0 |
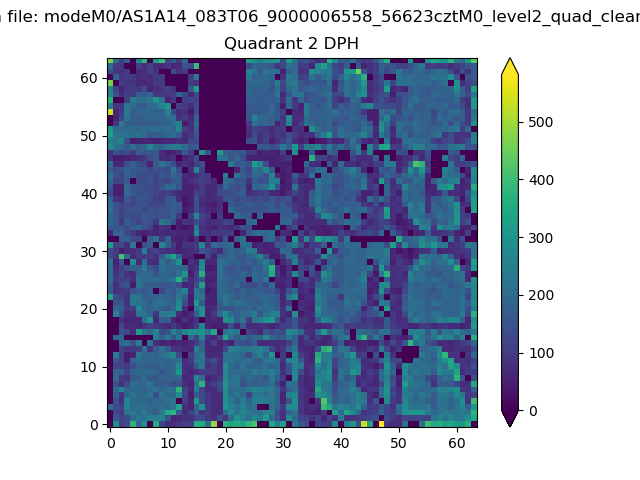
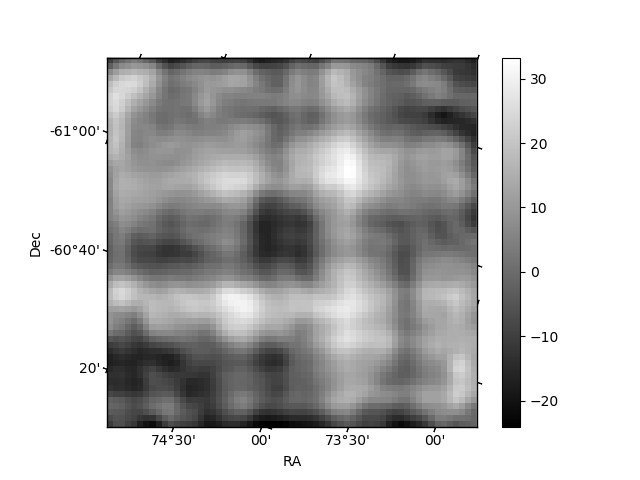
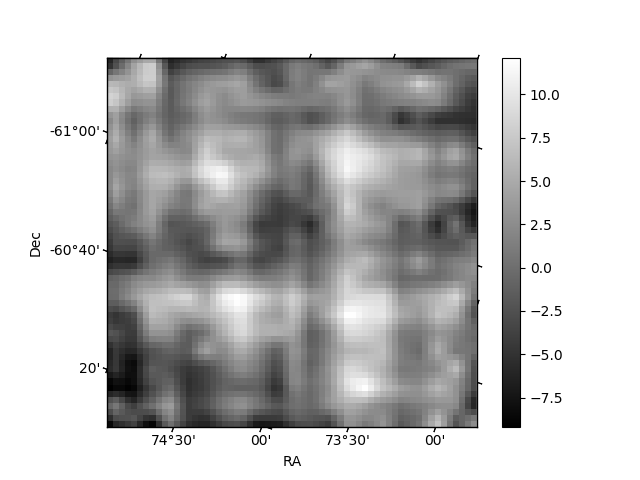
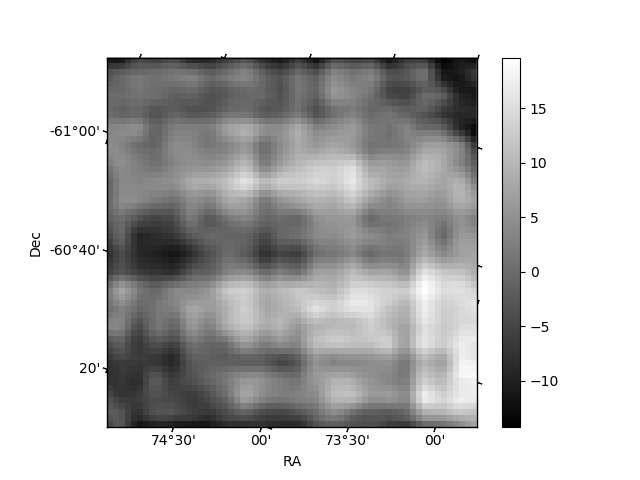
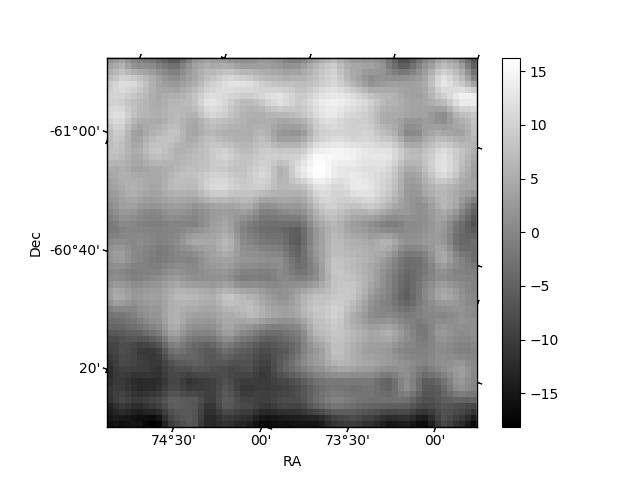
Histogram calculated using DETX and DETY for each event in the final _common_clean file
| Quadrant A | 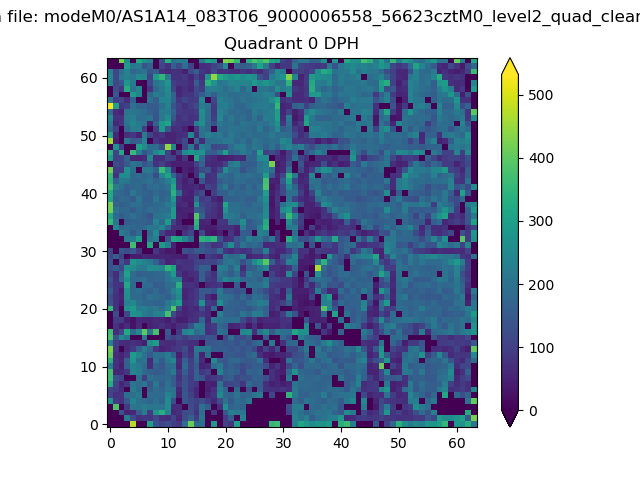 |
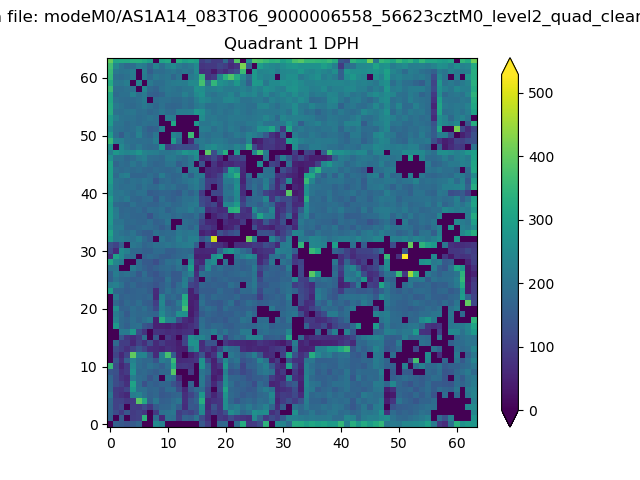 |
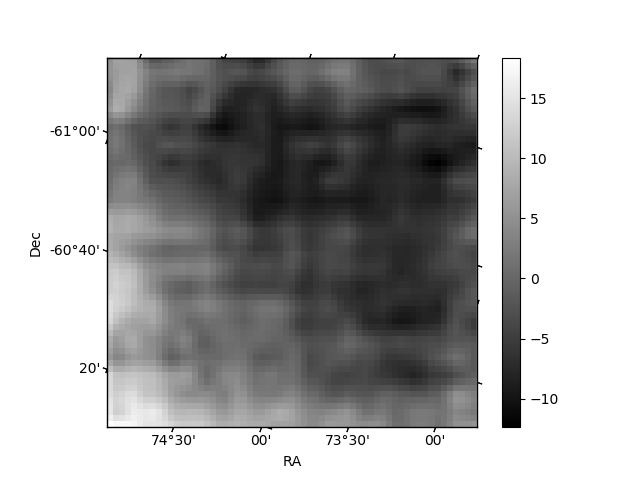
Quadrant B |
|---|---|---|---|
| Quadrant D | 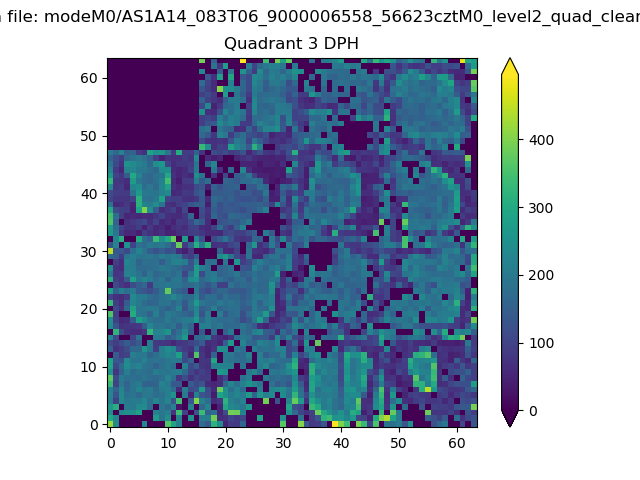 |
 |
Quadrant C |
| Plot type | Count rate plots | Images |
|---|---|---|
| Comparison with Poisson distribution Blue bars denote a histogram of data divided into 1 sec bins. Red curve is a Poisson curve with rate = median count rate of data. |
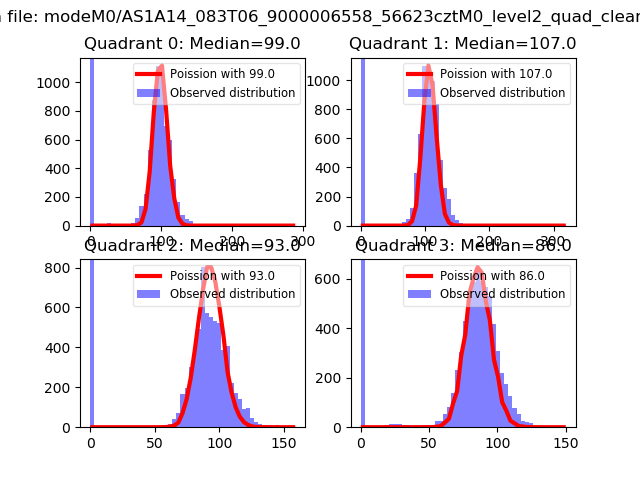 |
 |
| Quadrant-wise count rates Data is divided into 100 sec bins |
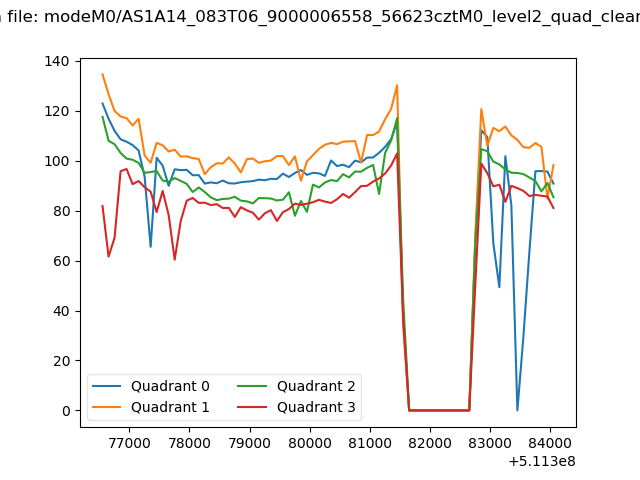 |
|
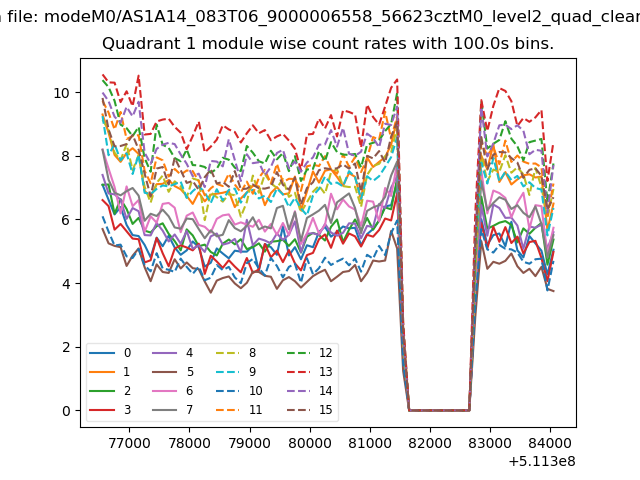
| Module-wise count rates for Quadrant A Data is divided into 100 sec bins |
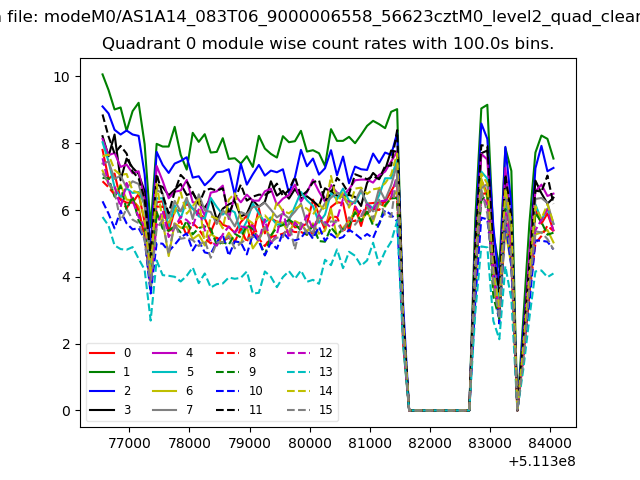 |
 |
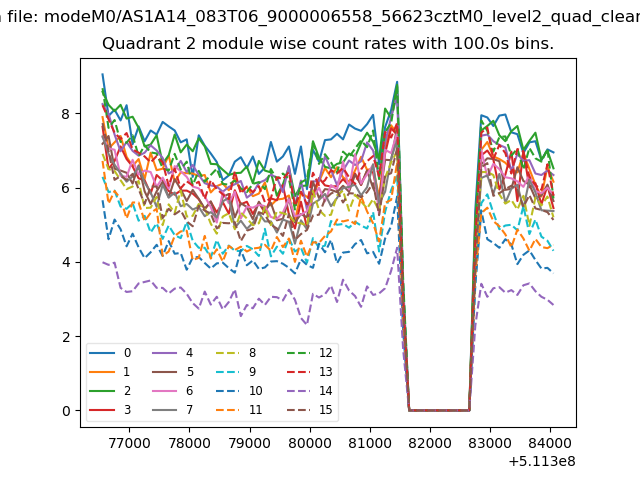
| Module-wise count rates for Quadrant B Data is divided into 100 sec bins |
 |
 |
| Module-wise count rates for Quadrant C Data is divided into 100 sec bins |
 |
 |
| Module-wise count rates for Quadrant D Data is divided into 100 sec bins |
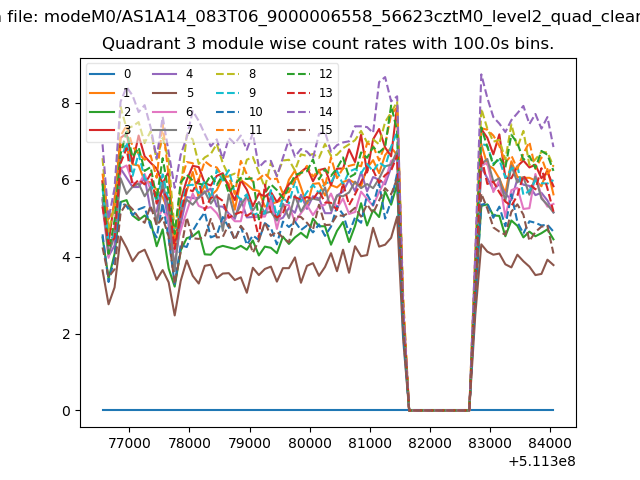 |
 |
| Parameter | Plot |
|---|---|
| CZT HV Monitor | 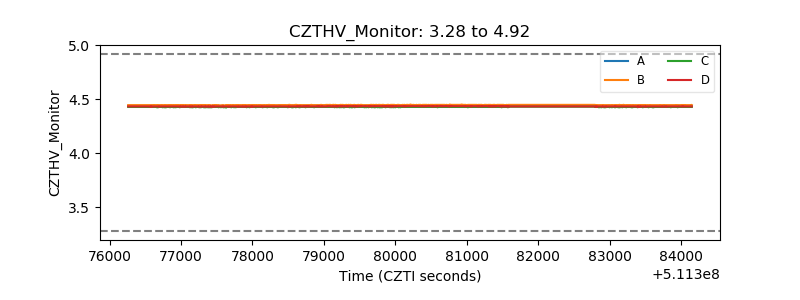 |
| D_VDD | 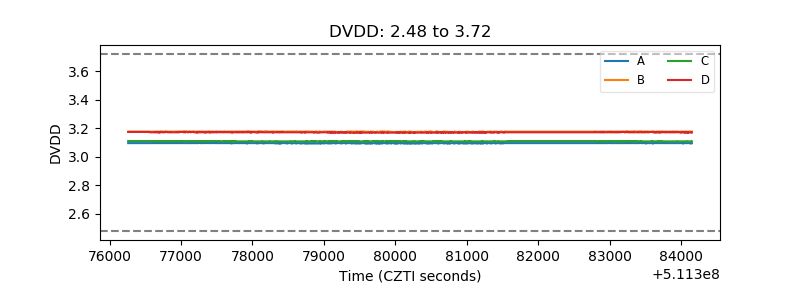 |
| Temperature 1 | 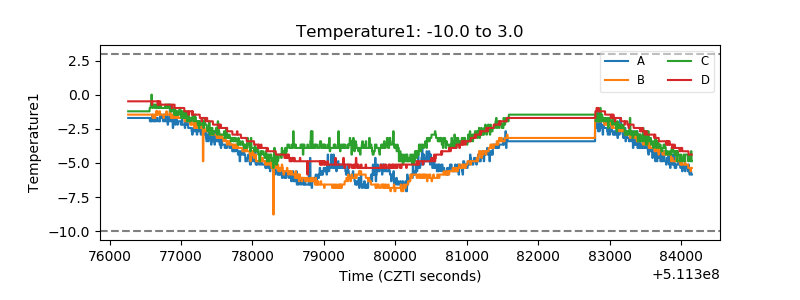 |
| Veto HV Monitor | 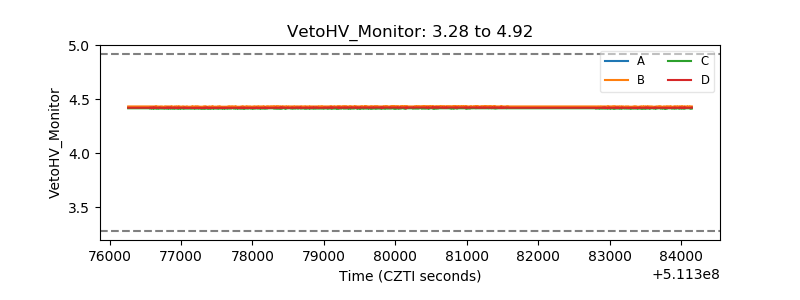 |
| Veto LLD | 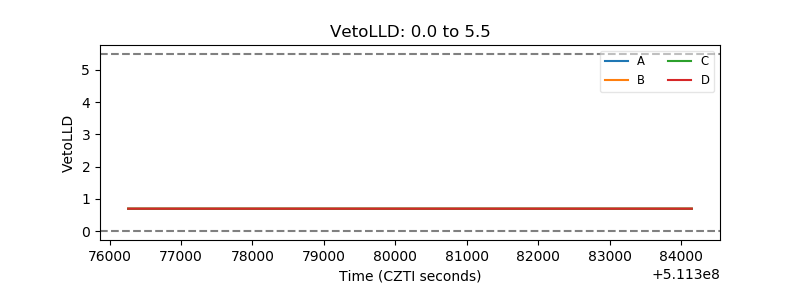 |
| Alpha Counter | 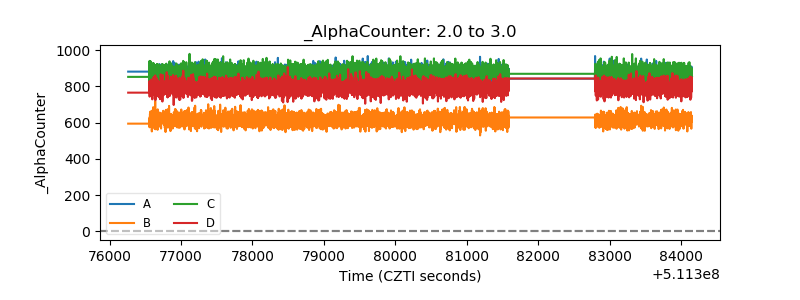 |
| _CPM_Rate | 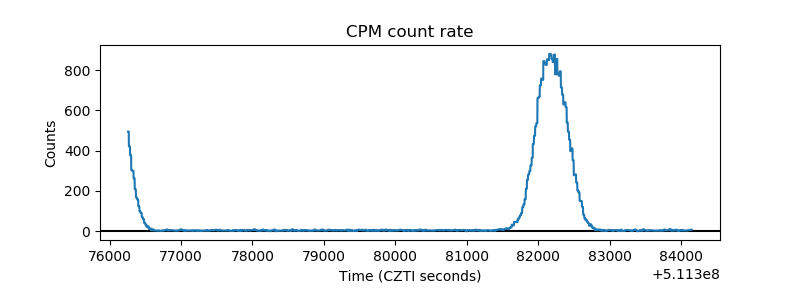 |
| CZT Counter | 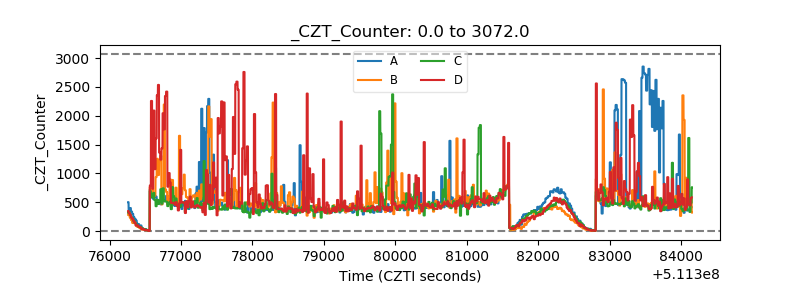 |
| +2.5 Volts monitor |  |
| +5 Volts monitor |  |
| _ROLL_ROT | 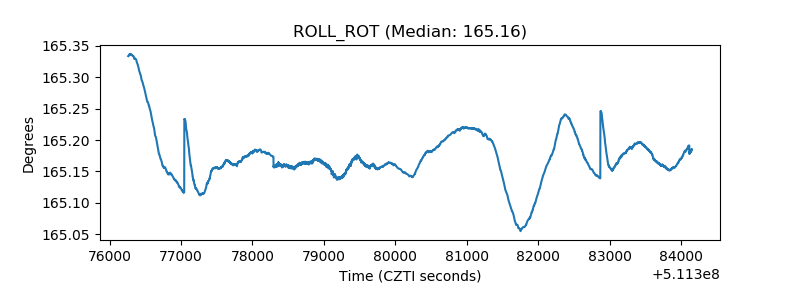 |
| _Roll_DEC | 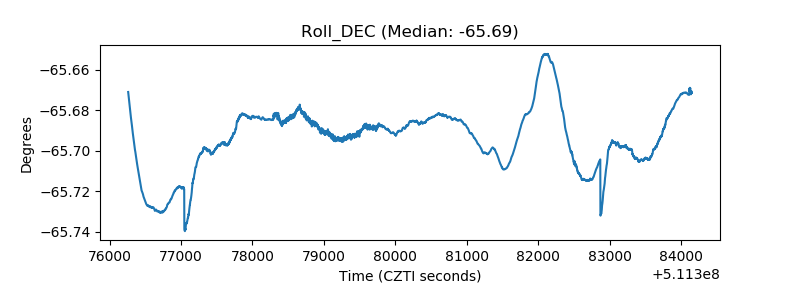 |
| _Roll_RA | 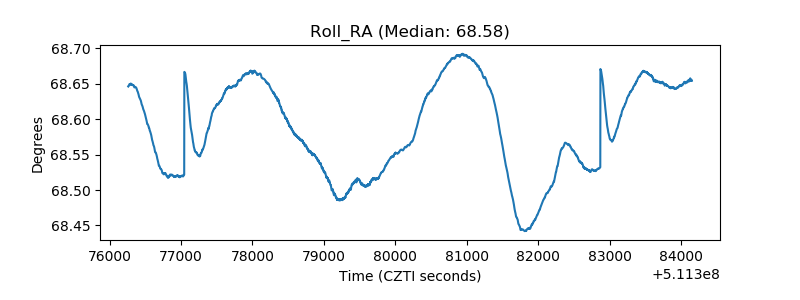 |
| Veto Counter | 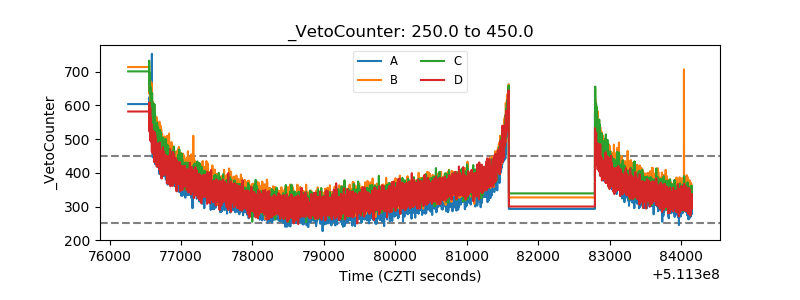 |