| Param | Original file | Final file |
|---|---|---|
| Filename | modeM0/AS1A14_083T06_9000006558_56624cztM0_level2.fits | modeM0/AS1A14_083T06_9000006558_56624cztM0_level2_quad_clean.evt |
| Size (bytes) | 403,462,080 | 94,268,160 |
| Size | 384.8 MB | 89.9 MB |
| Events in quadrant A | 4,179,199 | 586,592 |
| Events in quadrant B | 3,550,023 | 677,248 |
| Events in quadrant C | 3,196,591 | 591,430 |
| Events in quadrant D | 3,508,889 | 550,916 |
| Mode SS | |||
|---|---|---|---|
| Quadrant | BADHDUFLAG | Total packets | Discarded packets |
| A | 0 | 130 | 0 |
| B | 0 | 130 | 0 |
| C | 0 | 130 | 0 |
| D | 0 | 130 | 0 |
| Mode M9 | |||
|---|---|---|---|
| Quadrant | BADHDUFLAG | Total packets | Discarded packets |
| A | 0 | 12 | 0 |
| B | 0 | 13 | 0 |
| C | 0 | 13 | 0 |
| D | 0 | 13 | 0 |
| Mode M0 | |||
|---|---|---|---|
| Quadrant | BADHDUFLAG | Total packets | Discarded packets |
| A | 0 | 17249 | 2 |
| B | 0 | 15063 | 2 |
| C | 0 | 14228 | 2 |
| D | 0 | 15137 | 2 |
| Quadrant | Total seconds | Saturated seconds | Saturation percentage |
|---|---|---|---|
| A | 6425 | 524 | 8.155642% |
| B | 6425 | 138 | 2.147860% |
| C | 6425 | 67 | 1.042802% |
| D | 6425 | 90 | 1.400778% |
Noise dominated data is calculated using 1-second bins in cleaned event files. If a bin has >2000 counts, and if more than 50% of those come from <1% of pixels, then it is considered to be noise-dominated and hence unusable.
| Quadrant | # 1 sec bins | Bins with >0 counts | Bins with >2000 counts | High rate bins dominated by noise | Noise dominated (total time) | Noise dominated (detector-on time) | Marked lightcurve |
|---|---|---|---|---|---|---|---|
| A | 7615 | 6426 | 441 | 441 | 5.79% | 6.86% | 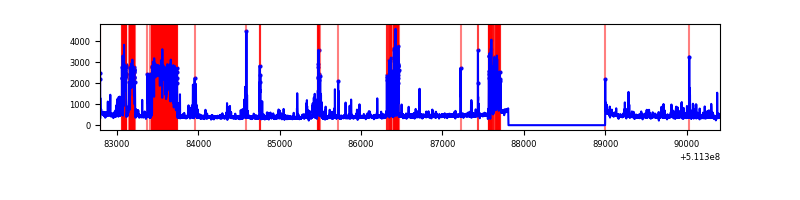 |
| B | 7615 | 6426 | 74 | 74 | 0.97% | 1.15% | 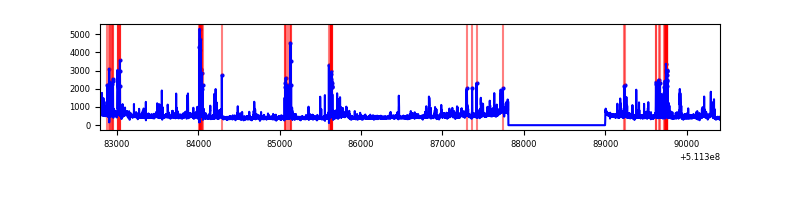 |
| C | 7615 | 6426 | 72 | 72 | 0.95% | 1.12% | 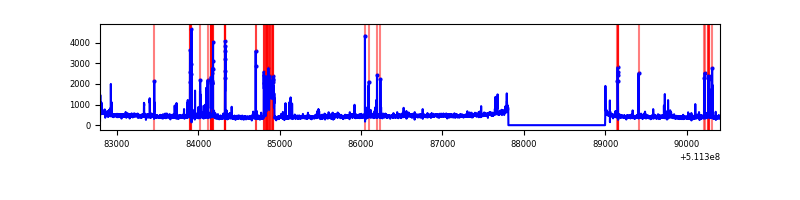 |
| D | 7615 | 6426 | 78 | 78 | 1.02% | 1.21% | 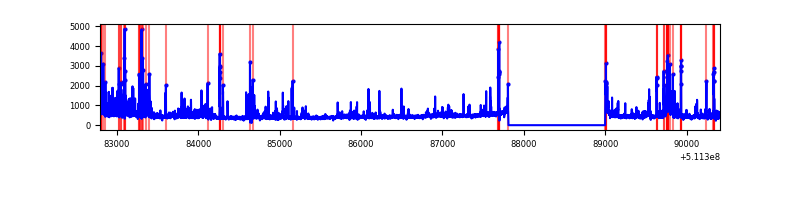 |
Top three noisy pixels from each quadrant. If the there are fewer than three noisy pixels in the level2.evt file, extra rows are filled as -1
| Pixel properties | Quadrant properties | ||||||
|---|---|---|---|---|---|---|---|
| Quadrant | DetID | PixID | Counts | Sigma | Mean | Median | Sigma |
| A | 4 | 95 | 894523 | 5439.29 | 663 | 648 | 164.3 |
| A | 10 | 251 | 581765 | 3536.14 | 663 | 648 | 164.3 |
| A | 4 | 249 | 73542 | 443.57 | 663 | 648 | 164.3 |
| B | 0 | 231 | 306925 | 2128.28 | 680 | 656 | 143.9 |
| B | 10 | 247 | 121986 | 843.13 | 680 | 656 | 143.9 |
| B | 4 | 21 | 116270 | 803.41 | 680 | 656 | 143.9 |
| C | 6 | 223 | 264865 | 1455.93 | 657 | 648 | 181.5 |
| C | 1 | 16 | 137268 | 752.82 | 657 | 648 | 181.5 |
| C | 12 | 249 | 114176 | 625.58 | 657 | 648 | 181.5 |
| D | 6 | 239 | 319201 | 1747.26 | 646 | 618 | 182.3 |
| D | 2 | 249 | 128088 | 699.11 | 646 | 618 | 182.3 |
| D | 3 | 12 | 98661 | 537.72 | 646 | 618 | 182.3 |
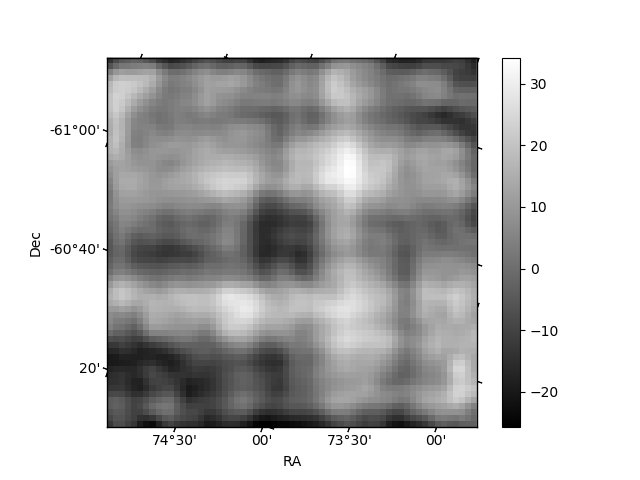
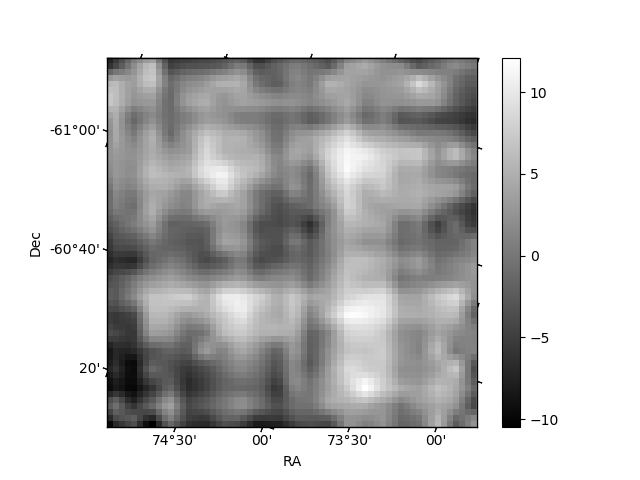
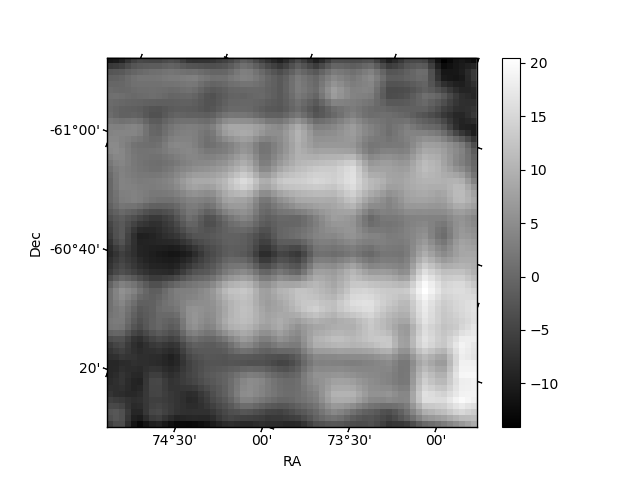
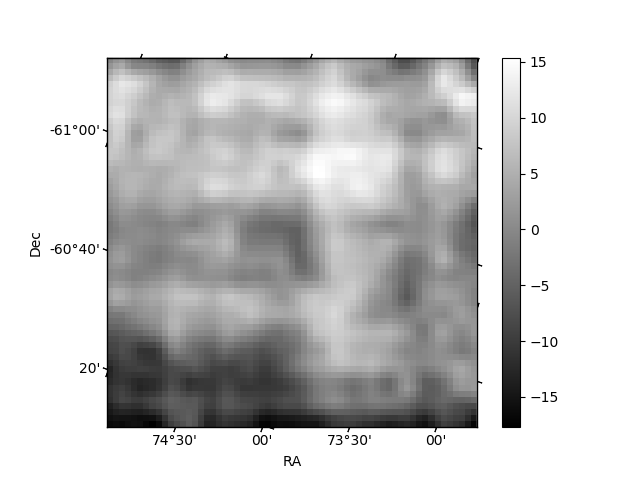
Histogram calculated using DETX and DETY for each event in the final _common_clean file
| Quadrant A | 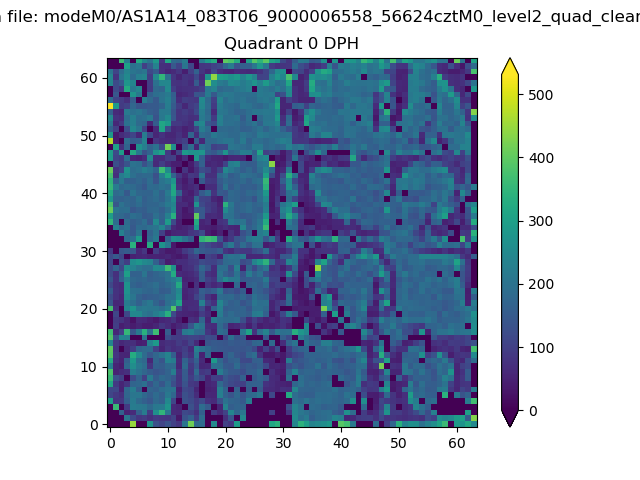 |
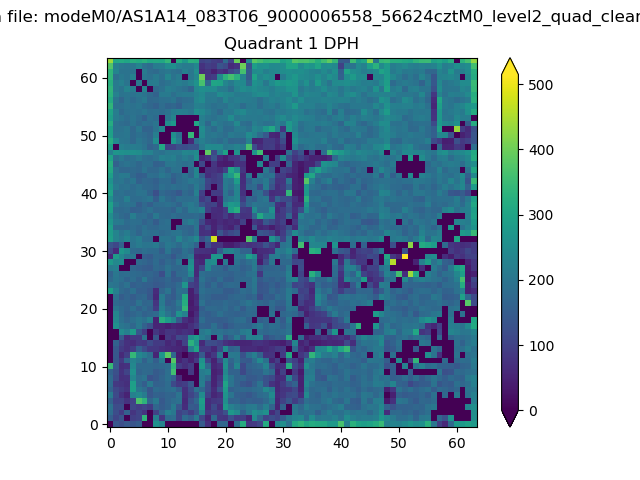 |
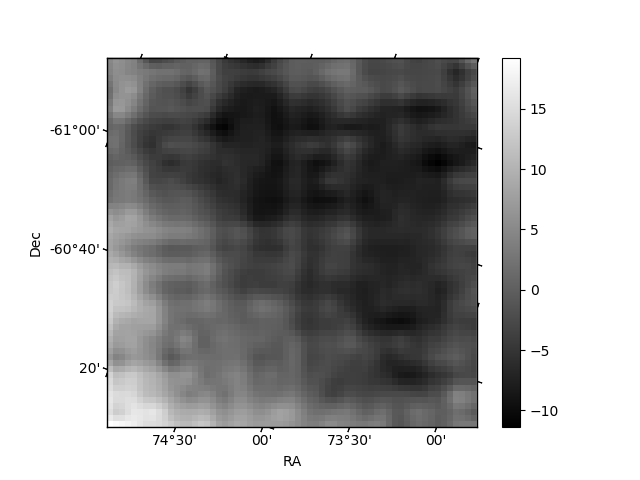
Quadrant B |
|---|---|---|---|
| Quadrant D | 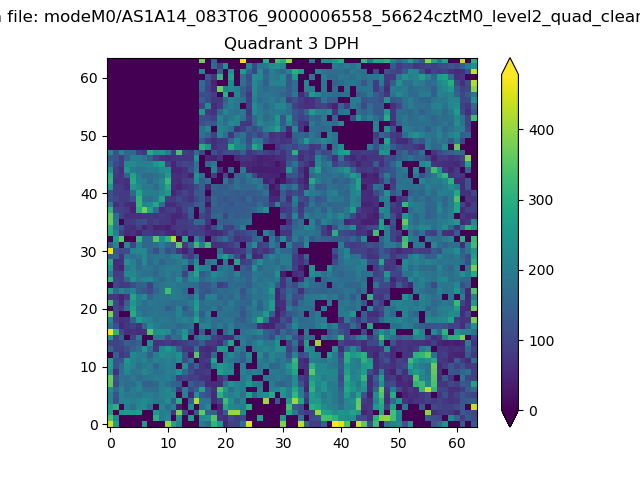 |
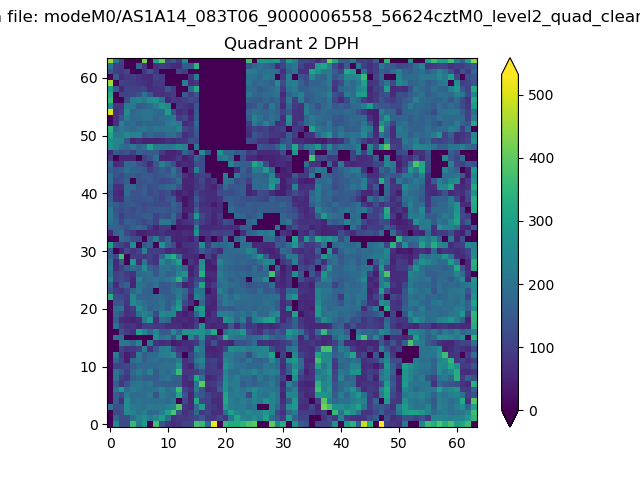 |
Quadrant C |
| Plot type | Count rate plots | Images |
|---|---|---|
| Comparison with Poisson distribution Blue bars denote a histogram of data divided into 1 sec bins. Red curve is a Poisson curve with rate = median count rate of data. |
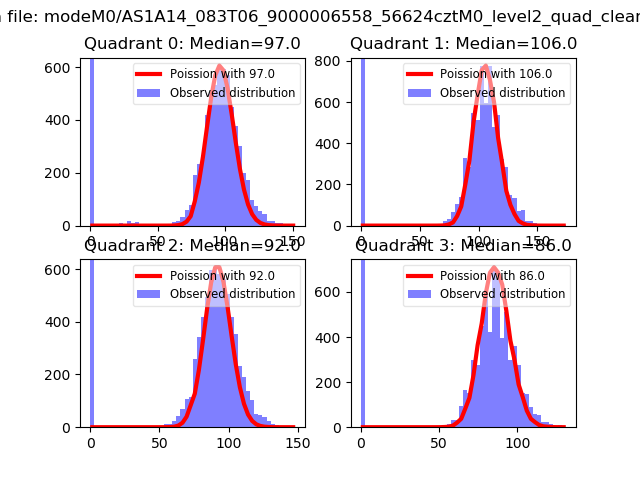 |
 |
| Quadrant-wise count rates Data is divided into 100 sec bins |
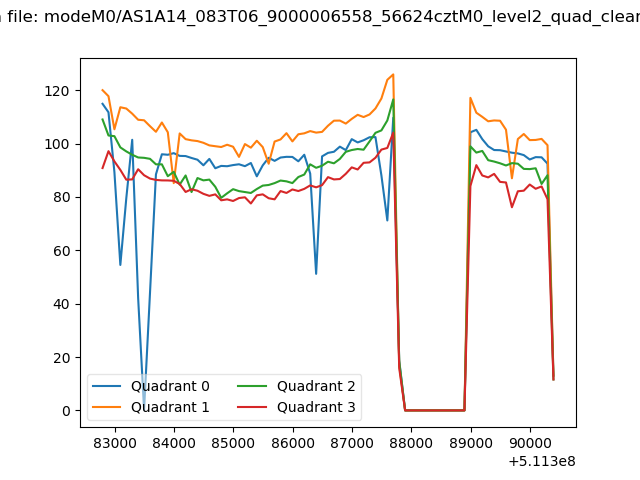 |
|
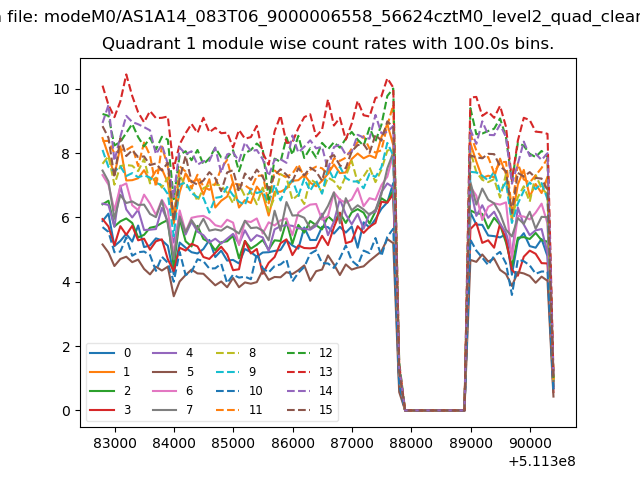
| Module-wise count rates for Quadrant A Data is divided into 100 sec bins |
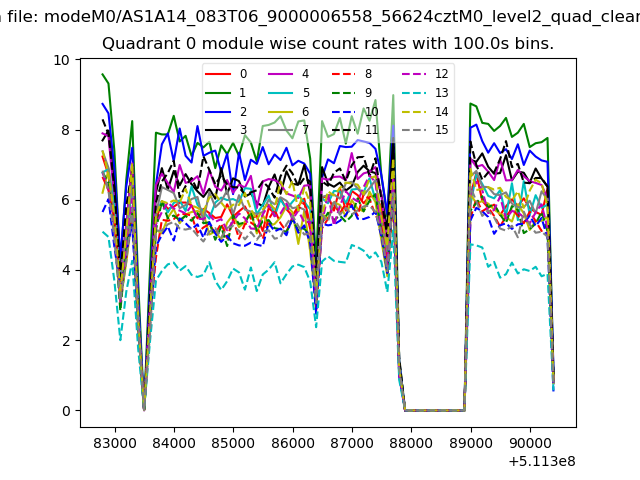 |
 |
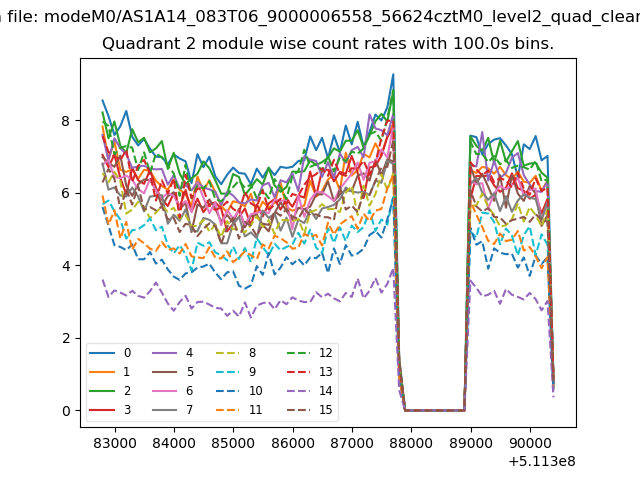
| Module-wise count rates for Quadrant B Data is divided into 100 sec bins |
 |
 |
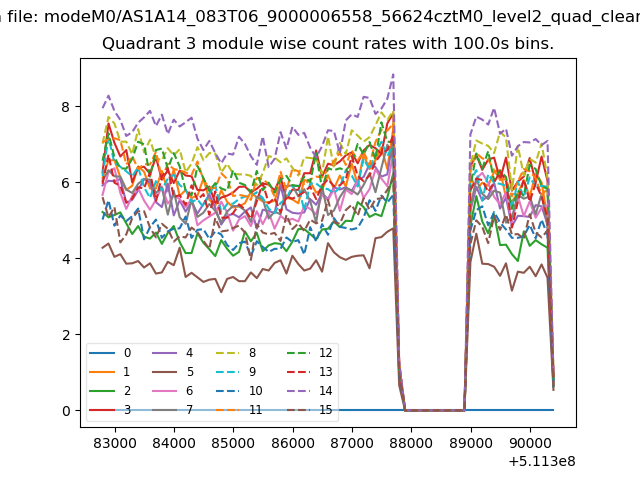
| Module-wise count rates for Quadrant C Data is divided into 100 sec bins |
 |
 |
| Module-wise count rates for Quadrant D Data is divided into 100 sec bins |
 |
 |
| Parameter | Plot |
|---|---|
| CZT HV Monitor | 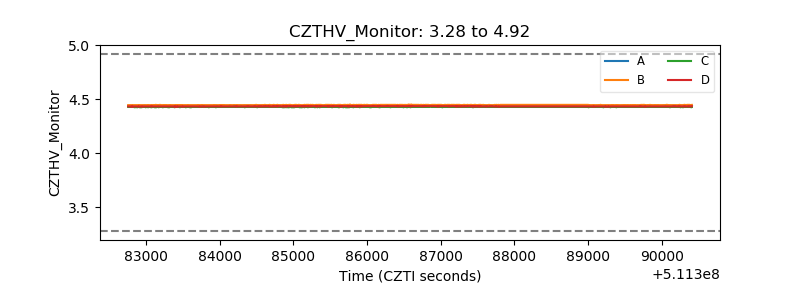 |
| D_VDD | 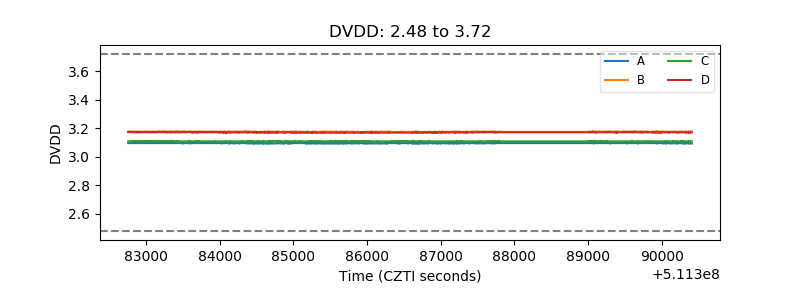 |
| Temperature 1 | 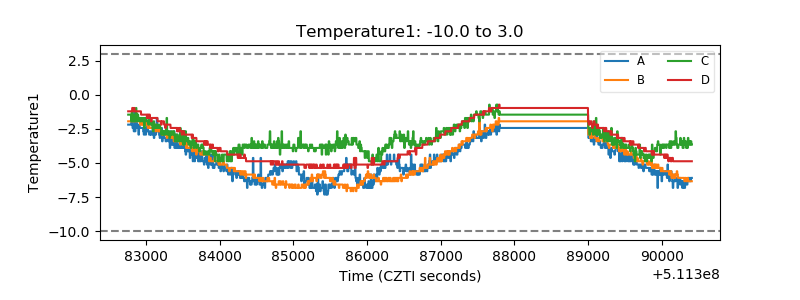 |
| Veto HV Monitor | 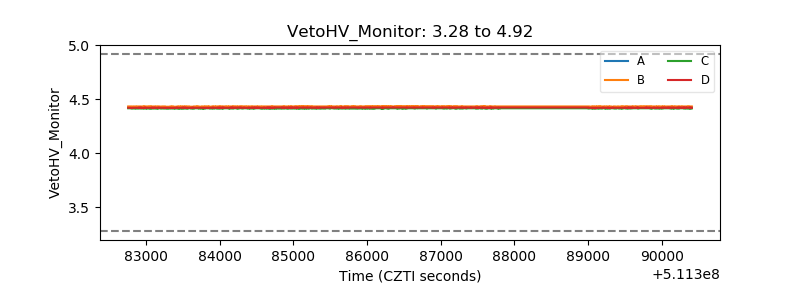 |
| Veto LLD | 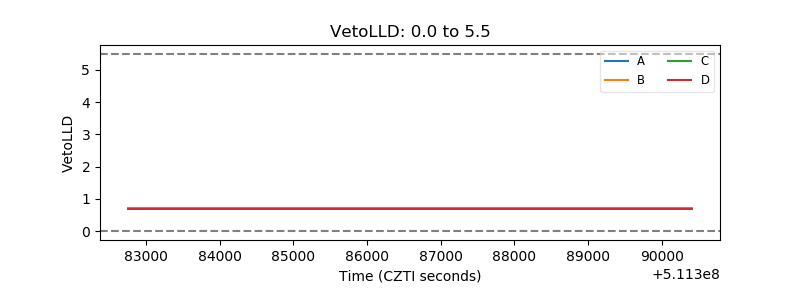 |
| Alpha Counter | 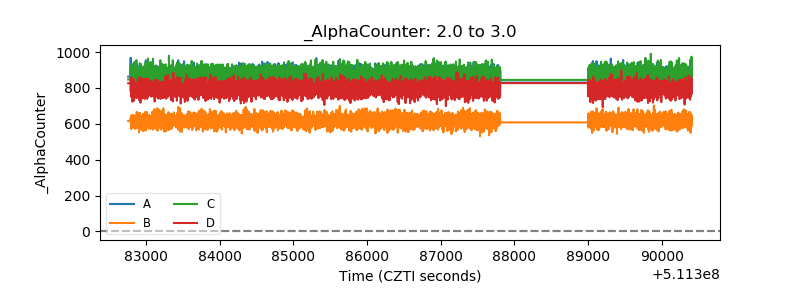 |
| _CPM_Rate | 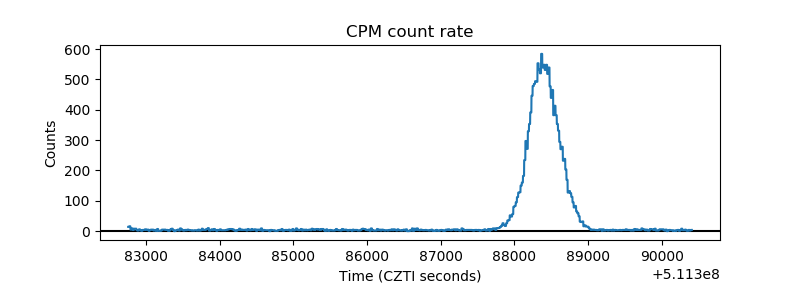 |
| CZT Counter | 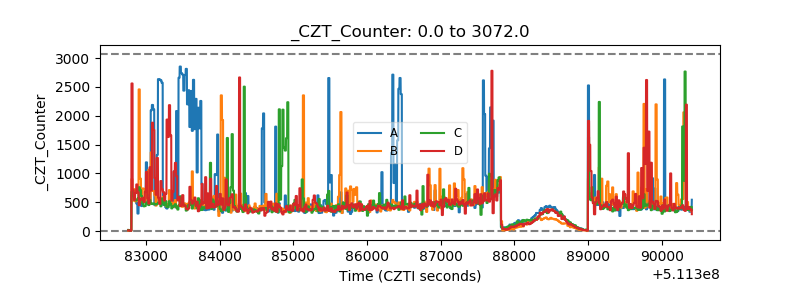 |
| +2.5 Volts monitor |  |
| +5 Volts monitor |  |
| _ROLL_ROT | 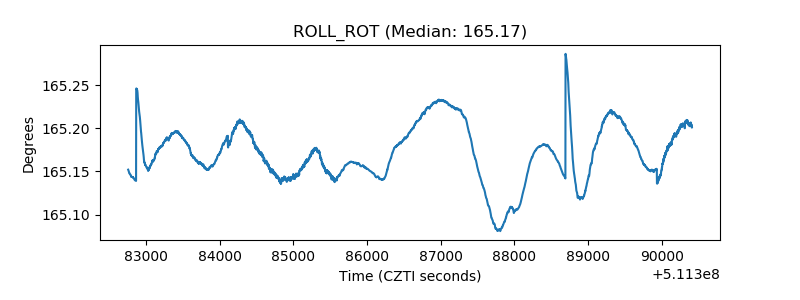 |
| _Roll_DEC | 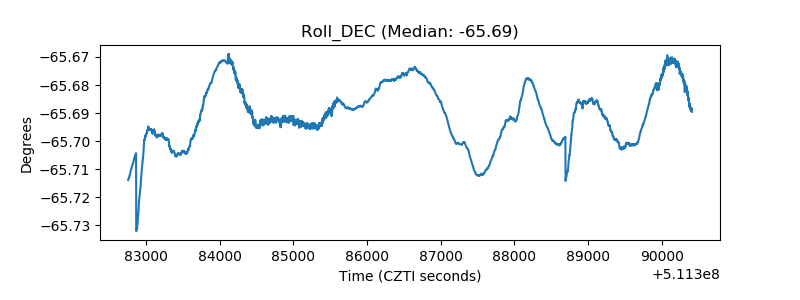 |
| _Roll_RA | 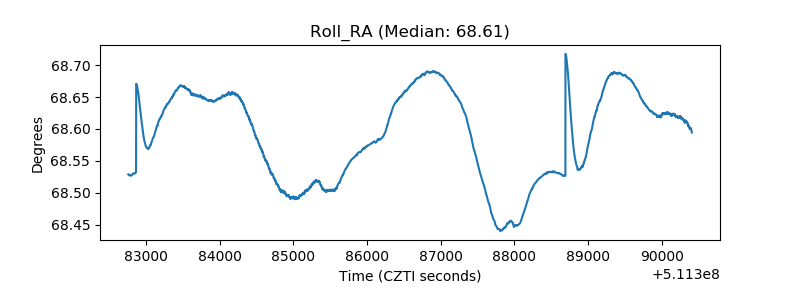 |
| Veto Counter | 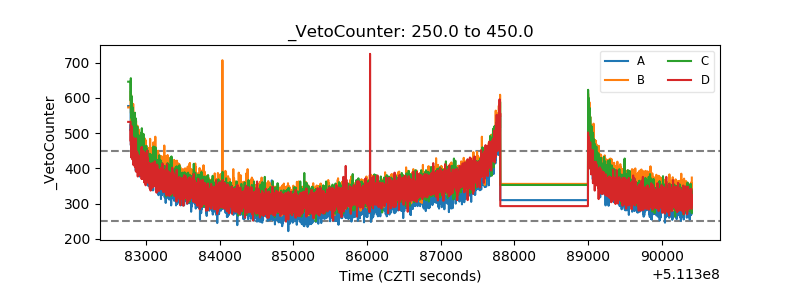 |