| Param | Original file | Final file |
|---|---|---|
| Filename | modeM0/AS1A14_083T06_9000006558_56625cztM0_level2.fits | modeM0/AS1A14_083T06_9000006558_56625cztM0_level2_quad_clean.evt |
| Size (bytes) | 374,293,440 | 96,108,480 |
| Size | 357.0 MB | 91.7 MB |
| Events in quadrant A | 3,224,676 | 629,136 |
| Events in quadrant B | 3,491,109 | 677,095 |
| Events in quadrant C | 3,102,520 | 594,657 |
| Events in quadrant D | 3,525,695 | 551,562 |
| Mode SS | |||
|---|---|---|---|
| Quadrant | BADHDUFLAG | Total packets | Discarded packets |
| A | 0 | 134 | 0 |
| B | 0 | 134 | 0 |
| C | 0 | 134 | 0 |
| D | 0 | 134 | 0 |
| Mode M9 | |||
|---|---|---|---|
| Quadrant | BADHDUFLAG | Total packets | Discarded packets |
| A | 0 | 18 | 0 |
| B | 0 | 18 | 0 |
| C | 0 | 19 | 0 |
| D | 0 | 19 | 0 |
| Mode M0 | |||
|---|---|---|---|
| Quadrant | BADHDUFLAG | Total packets | Discarded packets |
| A | 0 | 14530 | 2 |
| B | 0 | 15080 | 2 |
| C | 0 | 14365 | 2 |
| D | 0 | 15315 | 2 |
| Quadrant | Total seconds | Saturated seconds | Saturation percentage |
|---|---|---|---|
| A | 6562 | 76 | 1.158183% |
| B | 6562 | 128 | 1.950625% |
| C | 6562 | 59 | 0.899116% |
| D | 6562 | 94 | 1.432490% |
Noise dominated data is calculated using 1-second bins in cleaned event files. If a bin has >2000 counts, and if more than 50% of those come from <1% of pixels, then it is considered to be noise-dominated and hence unusable.
| Quadrant | # 1 sec bins | Bins with >0 counts | Bins with >2000 counts | High rate bins dominated by noise | Noise dominated (total time) | Noise dominated (detector-on time) | Marked lightcurve |
|---|---|---|---|---|---|---|---|
| A | 7562 | 6563 | 44 | 44 | 0.58% | 0.67% | 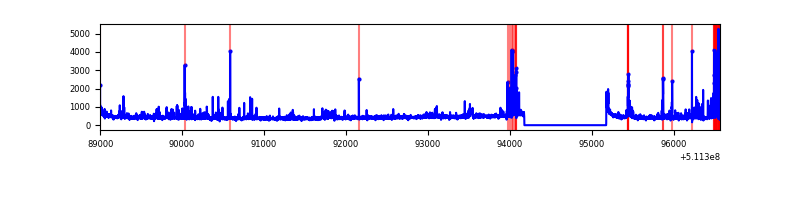 |
| B | 7562 | 6563 | 58 | 58 | 0.77% | 0.88% | 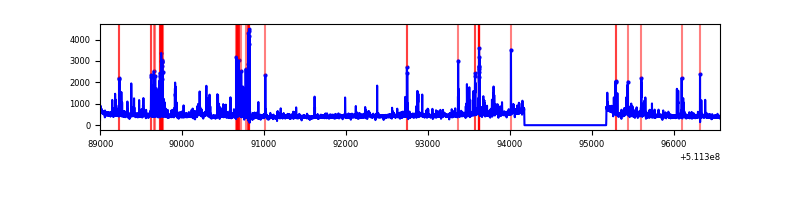 |
| C | 7562 | 6563 | 33 | 33 | 0.44% | 0.50% | 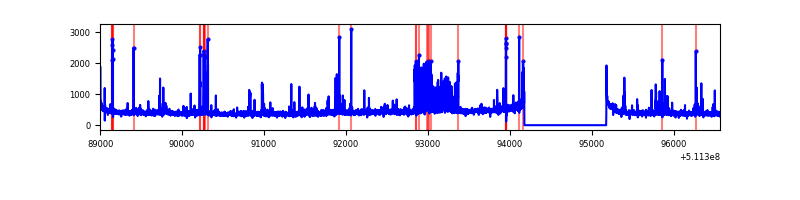 |
| D | 7562 | 6563 | 78 | 78 | 1.03% | 1.19% | 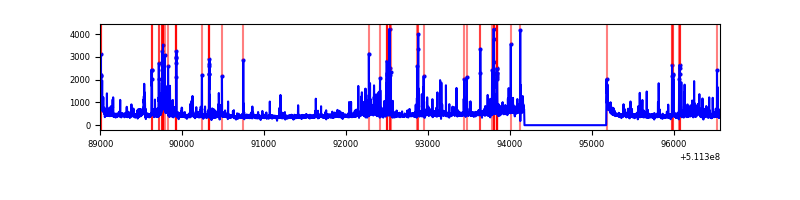 |
Top three noisy pixels from each quadrant. If the there are fewer than three noisy pixels in the level2.evt file, extra rows are filled as -1
| Pixel properties | Quadrant properties | ||||||
|---|---|---|---|---|---|---|---|
| Quadrant | DetID | PixID | Counts | Sigma | Mean | Median | Sigma |
| A | 10 | 251 | 231313 | 1347.84 | 691 | 673 | 171.1 |
| A | 4 | 249 | 157393 | 915.86 | 691 | 673 | 171.1 |
| A | 4 | 95 | 65036 | 376.13 | 691 | 673 | 171.1 |
| B | 0 | 231 | 245165 | 1672.97 | 688 | 663 | 146.1 |
| B | 5 | 185 | 124667 | 848.48 | 688 | 663 | 146.1 |
| B | 10 | 247 | 104821 | 712.68 | 688 | 663 | 146.1 |
| C | 1 | 16 | 278451 | 1516.85 | 668 | 661 | 183.1 |
| C | 6 | 223 | 126241 | 685.72 | 668 | 661 | 183.1 |
| C | 12 | 252 | 40844 | 219.41 | 668 | 661 | 183.1 |
| D | 2 | 249 | 314738 | 1664.71 | 658 | 628 | 188.7 |
| D | 6 | 239 | 111804 | 589.21 | 658 | 628 | 188.7 |
| D | 3 | 12 | 99205 | 522.44 | 658 | 628 | 188.7 |
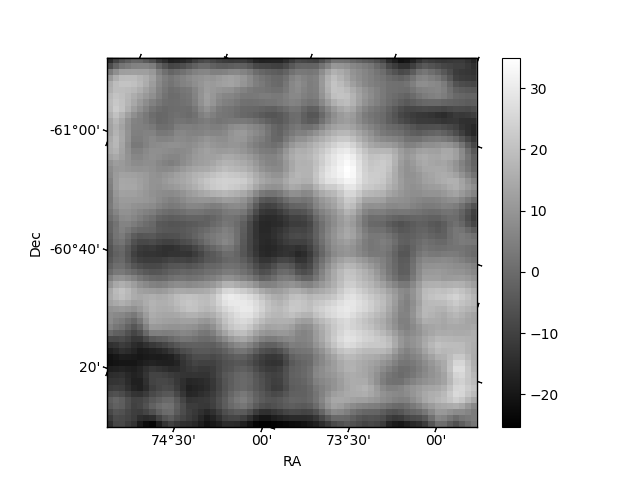
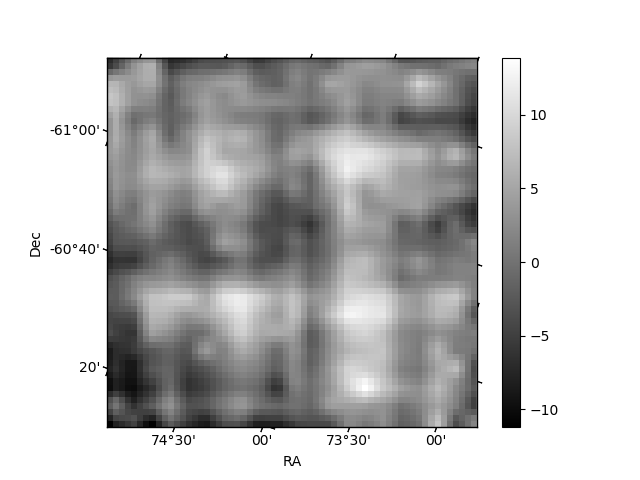
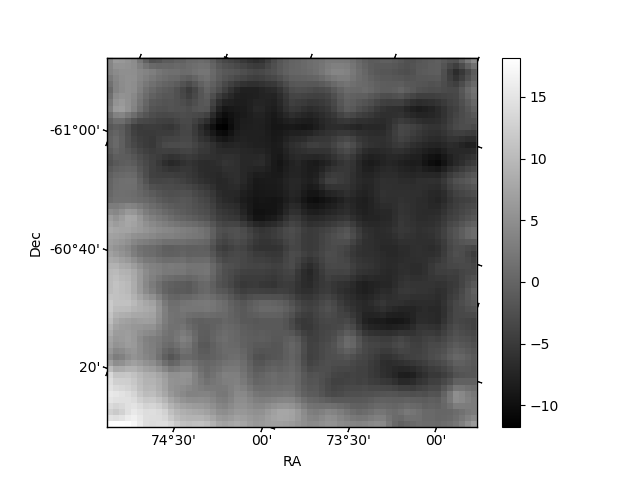
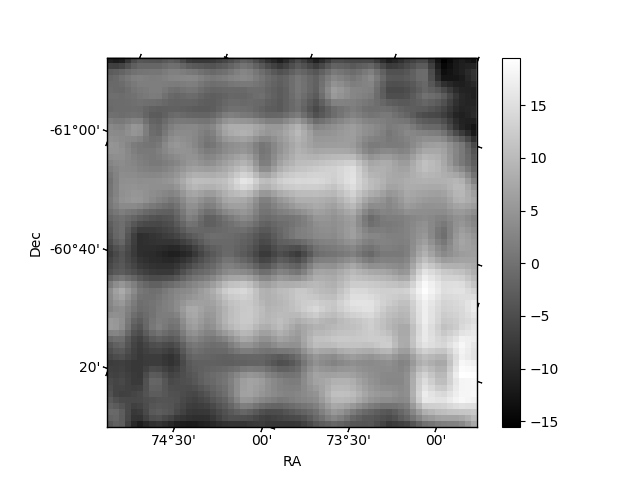
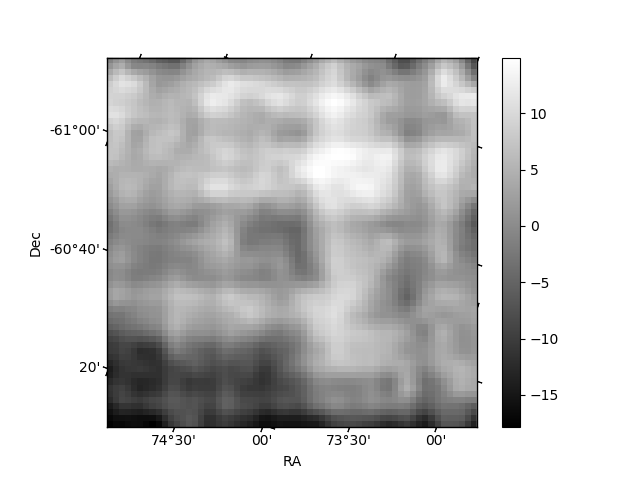
Histogram calculated using DETX and DETY for each event in the final _common_clean file
| Quadrant A | 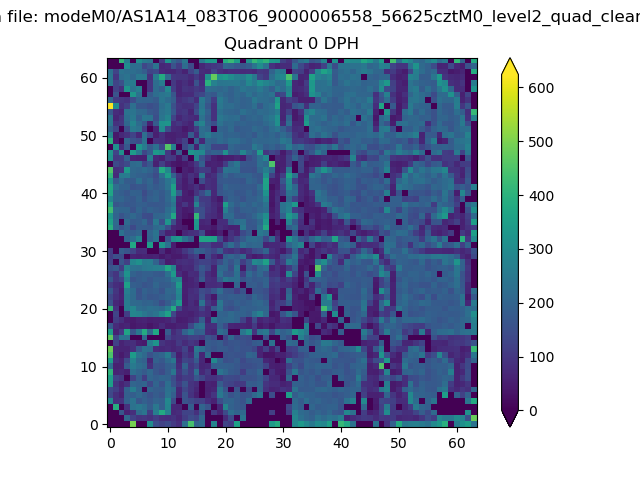 |
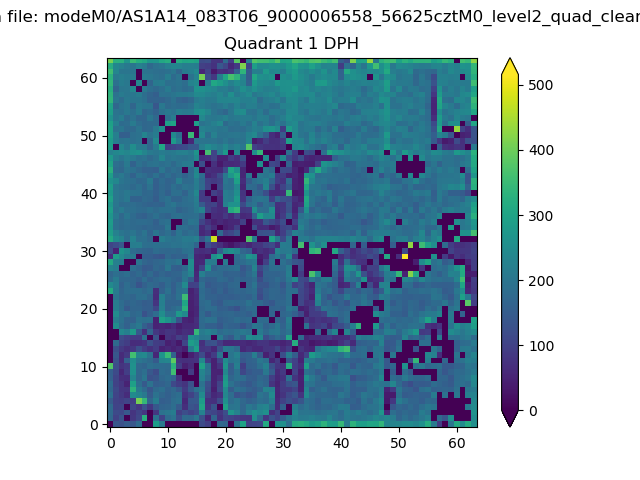 |
Quadrant B |
|---|---|---|---|
| Quadrant D | 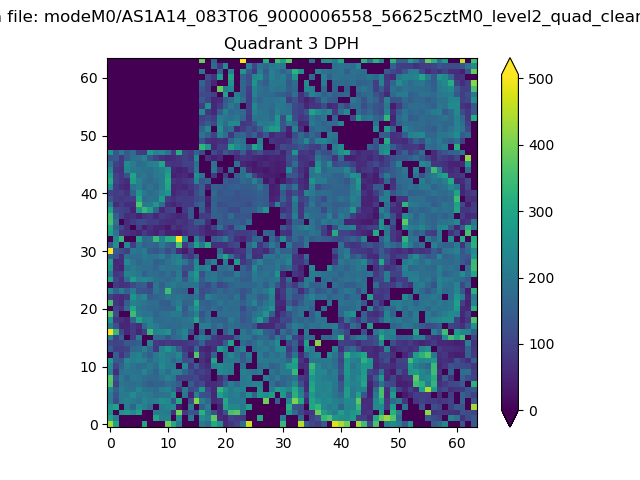 |
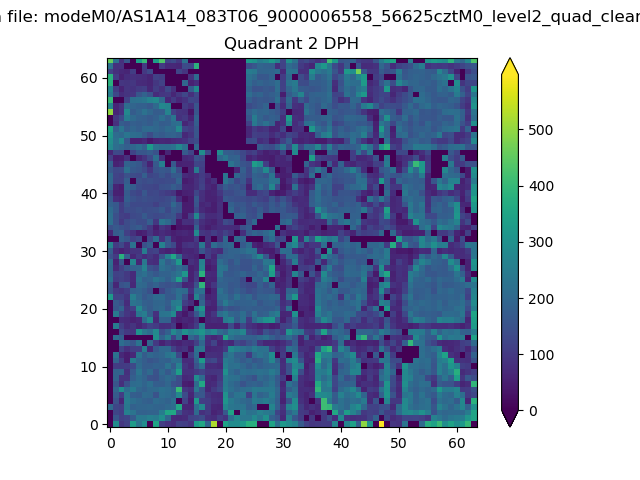 |
Quadrant C |
| Plot type | Count rate plots | Images |
|---|---|---|
| Comparison with Poisson distribution Blue bars denote a histogram of data divided into 1 sec bins. Red curve is a Poisson curve with rate = median count rate of data. |
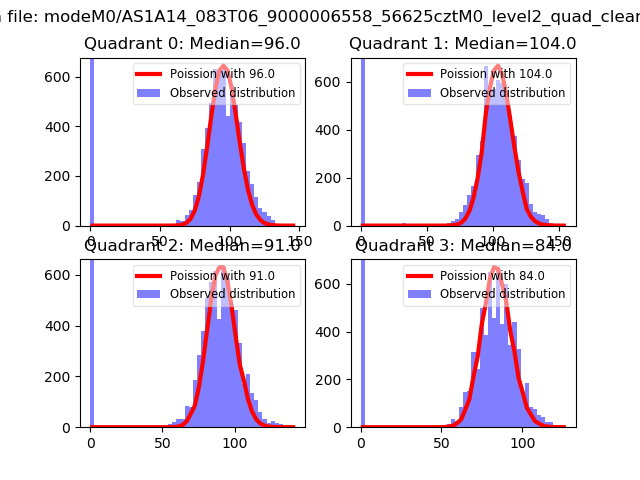 |
 |
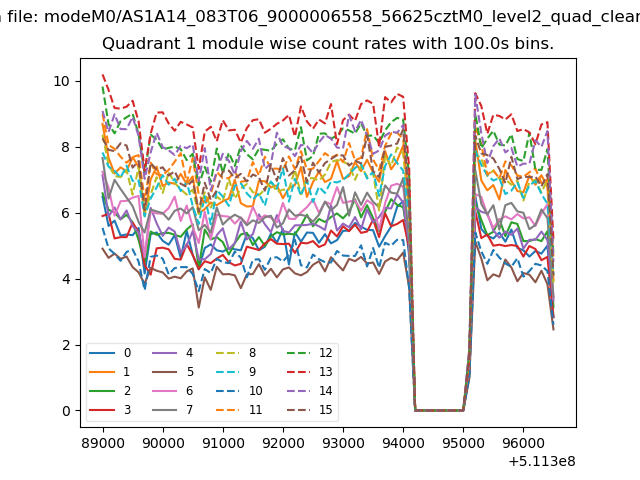
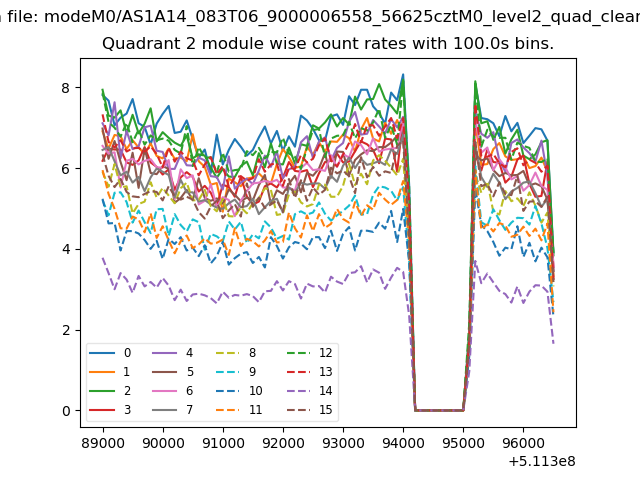
| Quadrant-wise count rates Data is divided into 100 sec bins |
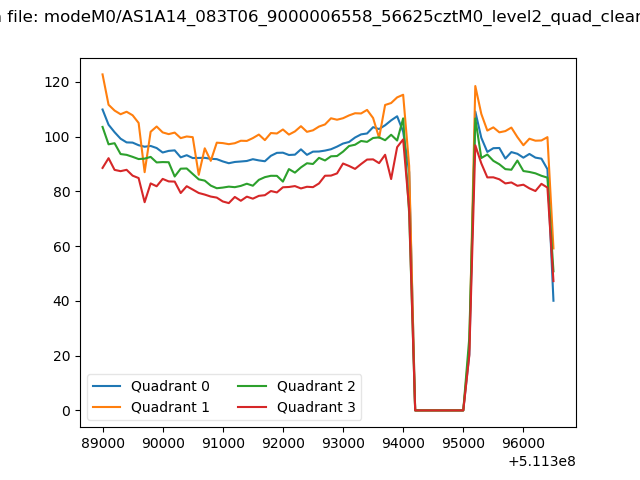 |
|
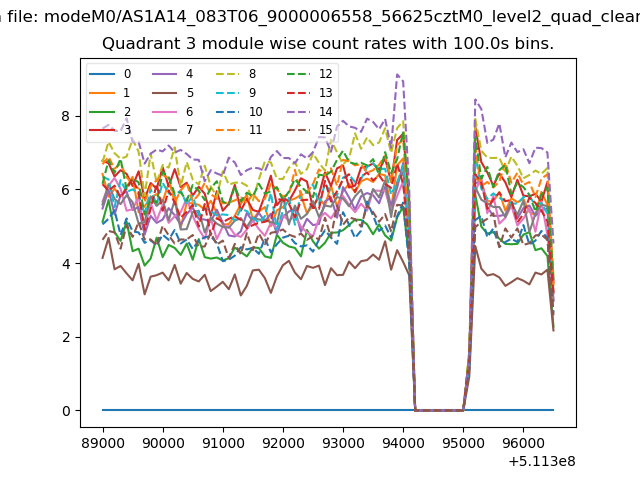
| Module-wise count rates for Quadrant A Data is divided into 100 sec bins |
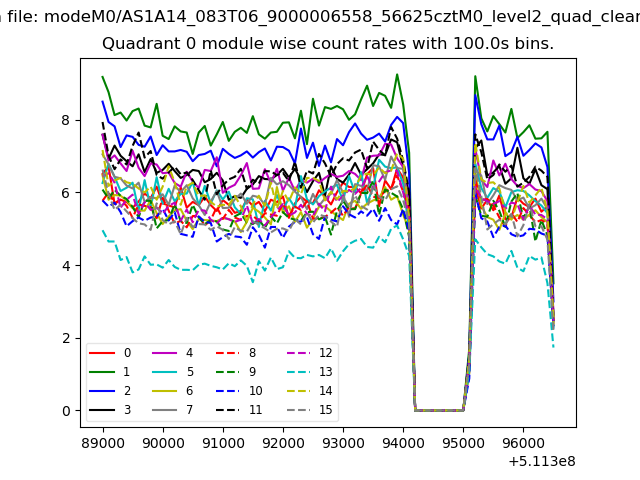 |
 |
| Module-wise count rates for Quadrant B Data is divided into 100 sec bins |
 |
 |
| Module-wise count rates for Quadrant C Data is divided into 100 sec bins |
 |
 |
| Module-wise count rates for Quadrant D Data is divided into 100 sec bins |
 |
 |
| Parameter | Plot |
|---|---|
| CZT HV Monitor | 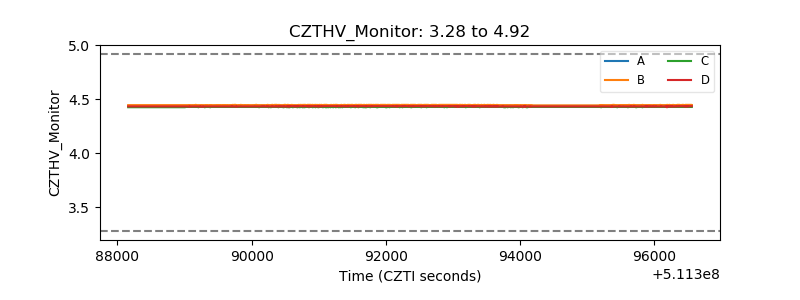 |
| D_VDD | 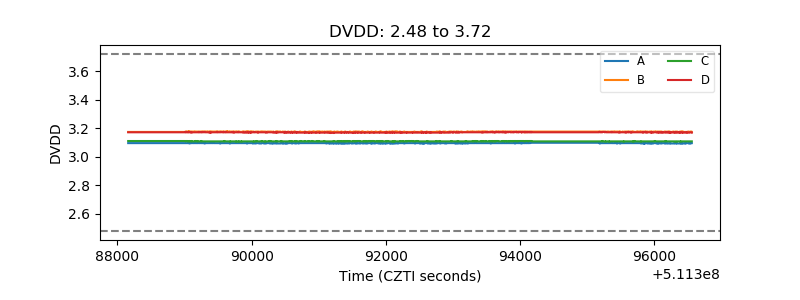 |
| Temperature 1 | 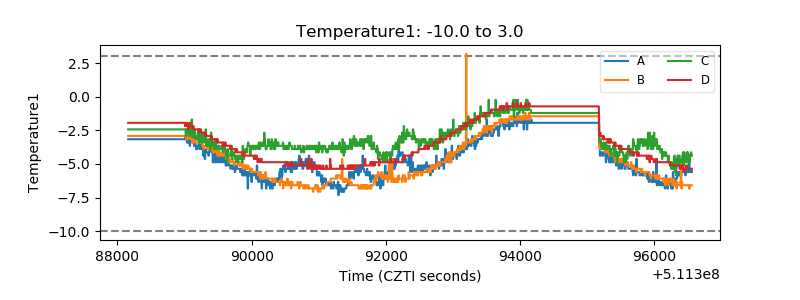 |
| Veto HV Monitor |  |
| Veto LLD | 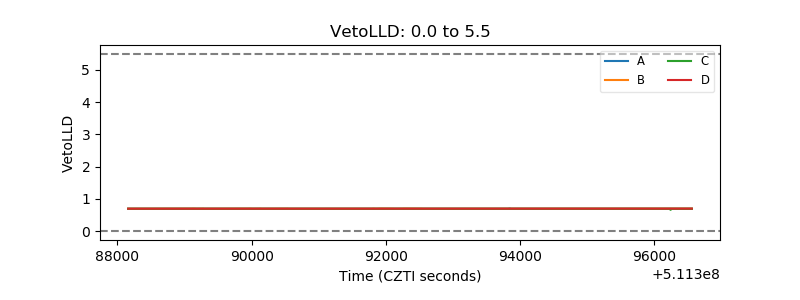 |
| Alpha Counter | 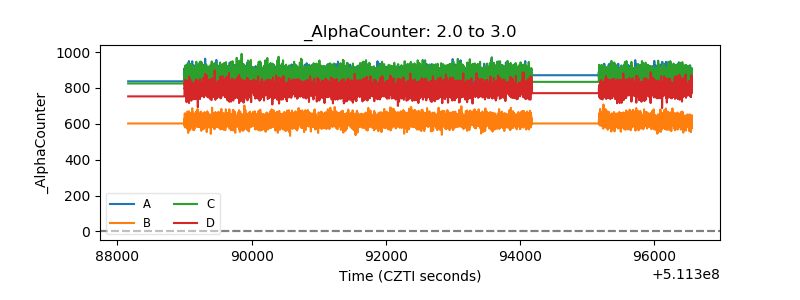 |
| _CPM_Rate | 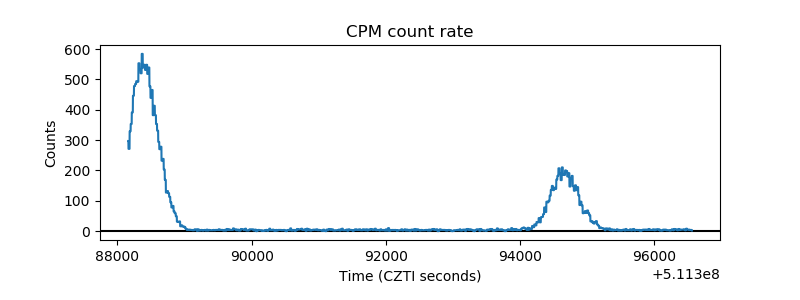 |
| CZT Counter | 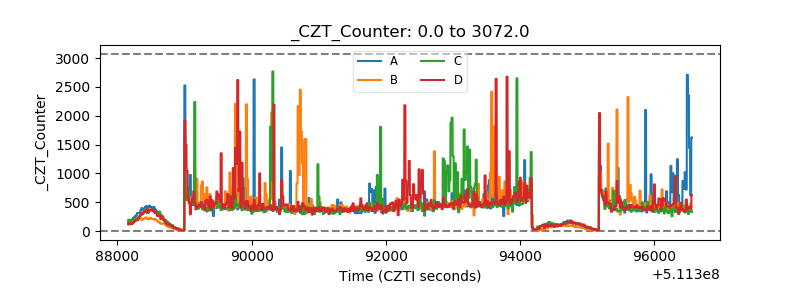 |
| +2.5 Volts monitor |  |
| +5 Volts monitor |  |
| _ROLL_ROT | 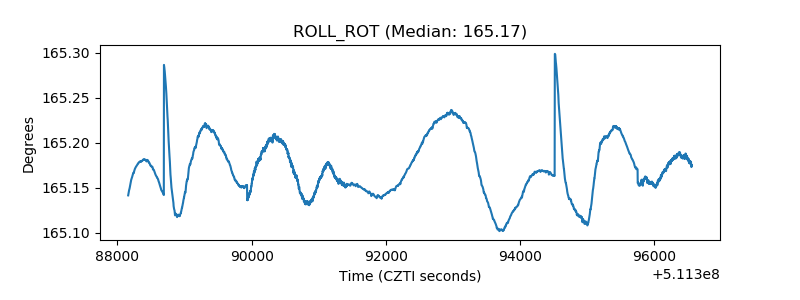 |
| _Roll_DEC | 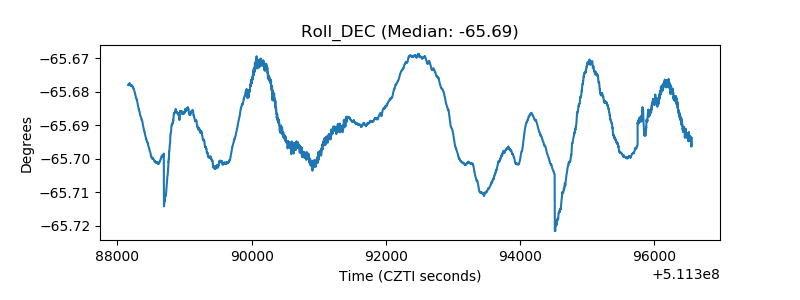 |
| _Roll_RA | 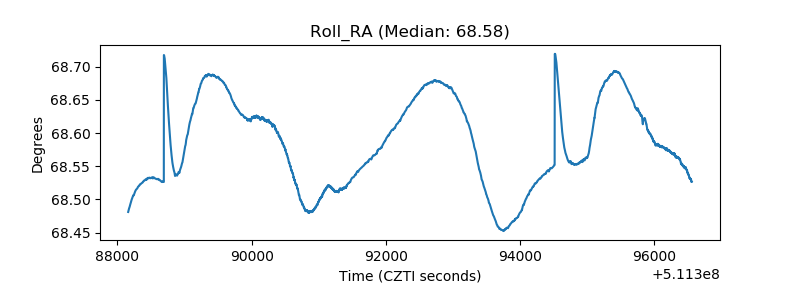 |
| Veto Counter | 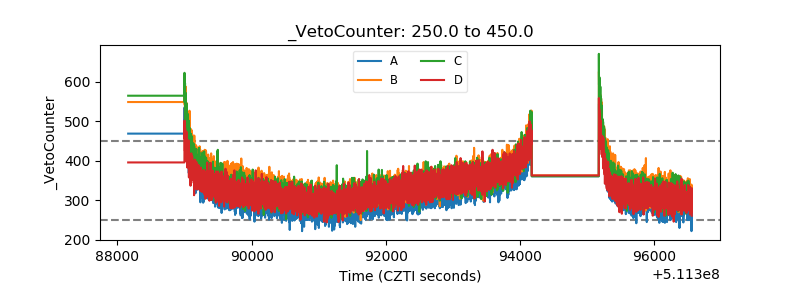 |