| Param | Original file | Final file |
|---|---|---|
| Filename | modeM0/AS1A14_083T06_9000006558_56627cztM0_level2.fits | modeM0/AS1A14_083T06_9000006558_56627cztM0_level2_quad_clean.evt |
| Size (bytes) | 492,989,760 | 117,581,760 |
| Size | 470.2 MB | 112.1 MB |
| Events in quadrant A | 4,446,796 | 764,463 |
| Events in quadrant B | 4,864,180 | 814,251 |
| Events in quadrant C | 4,017,757 | 727,908 |
| Events in quadrant D | 4,281,804 | 682,602 |
| Mode SS | |||
|---|---|---|---|
| Quadrant | BADHDUFLAG | Total packets | Discarded packets |
| A | 0 | 168 | 0 |
| B | 0 | 168 | 0 |
| C | 0 | 168 | 0 |
| D | 0 | 168 | 0 |
| Mode M9 | |||
|---|---|---|---|
| Quadrant | BADHDUFLAG | Total packets | Discarded packets |
| A | 0 | 7 | 0 |
| B | 0 | 7 | 0 |
| C | 0 | 7 | 0 |
| D | 0 | 7 | 0 |
| Mode M0 | |||
|---|---|---|---|
| Quadrant | BADHDUFLAG | Total packets | Discarded packets |
| A | 0 | 19349 | 1 |
| B | 0 | 20557 | 1 |
| C | 0 | 18103 | 2 |
| D | 0 | 18850 | 1 |
| Quadrant | Total seconds | Saturated seconds | Saturation percentage |
|---|---|---|---|
| A | 8212 | 184 | 2.240623% |
| B | 8213 | 367 | 4.468526% |
| C | 8212 | 91 | 1.108134% |
| D | 8212 | 103 | 1.254262% |
Noise dominated data is calculated using 1-second bins in cleaned event files. If a bin has >2000 counts, and if more than 50% of those come from <1% of pixels, then it is considered to be noise-dominated and hence unusable.
| Quadrant | # 1 sec bins | Bins with >0 counts | Bins with >2000 counts | High rate bins dominated by noise | Noise dominated (total time) | Noise dominated (detector-on time) | Marked lightcurve |
|---|---|---|---|---|---|---|---|
| A | 8907 | 8213 | 62 | 62 | 0.70% | 0.75% | 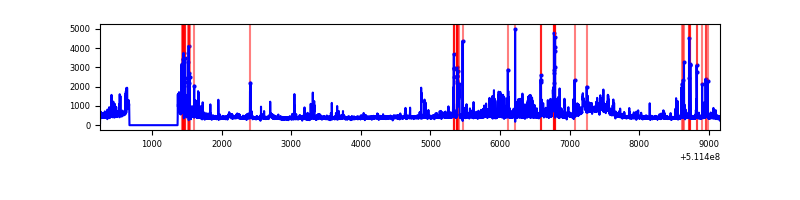 |
| B | 8908 | 8214 | 128 | 128 | 1.44% | 1.56% | 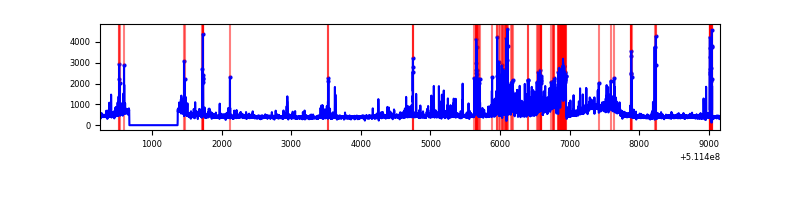 |
| C | 8907 | 8213 | 43 | 43 | 0.48% | 0.52% | 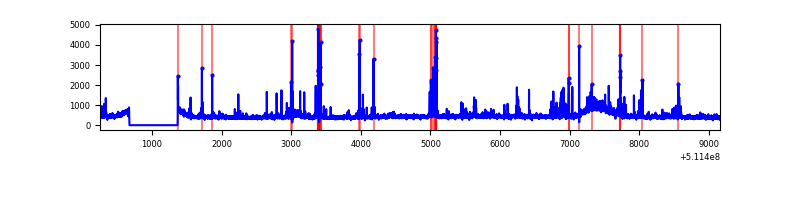 |
| D | 8907 | 8213 | 78 | 78 | 0.88% | 0.95% | 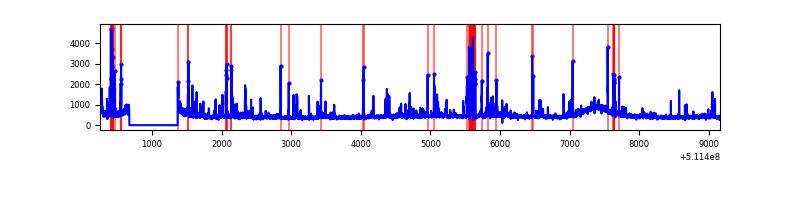 |
Top three noisy pixels from each quadrant. If the there are fewer than three noisy pixels in the level2.evt file, extra rows are filled as -1
| Pixel properties | Quadrant properties | ||||||
|---|---|---|---|---|---|---|---|
| Quadrant | DetID | PixID | Counts | Sigma | Mean | Median | Sigma |
| A | 7 | 64 | 273068 | 1253.88 | 886 | 864 | 217.1 |
| A | 4 | 95 | 156117 | 715.16 | 886 | 864 | 217.1 |
| A | 0 | 8 | 155683 | 713.16 | 886 | 864 | 217.1 |
| B | 8 | 128 | 773668 | 4072.18 | 882 | 847 | 189.8 |
| B | 0 | 231 | 156495 | 820.15 | 882 | 847 | 189.8 |
| B | 10 | 247 | 136824 | 716.5 | 882 | 847 | 189.8 |
| C | 13 | 3 | 153387 | 649.58 | 867 | 859 | 234.8 |
| C | 1 | 16 | 113307 | 478.89 | 867 | 859 | 234.8 |
| C | 12 | 252 | 110372 | 466.39 | 867 | 859 | 234.8 |
| D | 2 | 249 | 193444 | 801.61 | 858 | 818 | 240.3 |
| D | 7 | 96 | 140266 | 580.31 | 858 | 818 | 240.3 |
| D | 6 | 239 | 93357 | 385.1 | 858 | 818 | 240.3 |
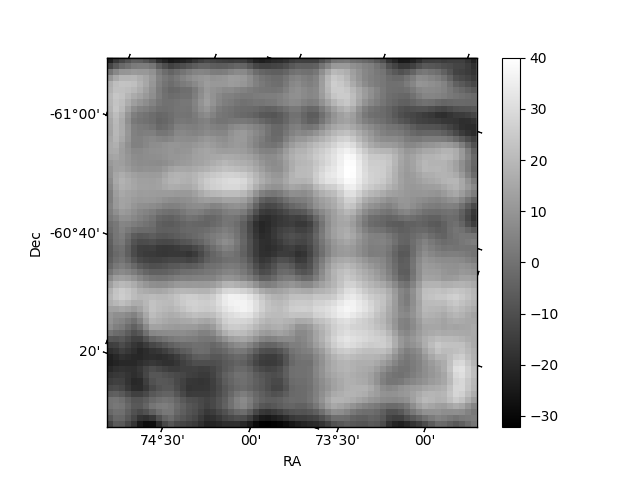
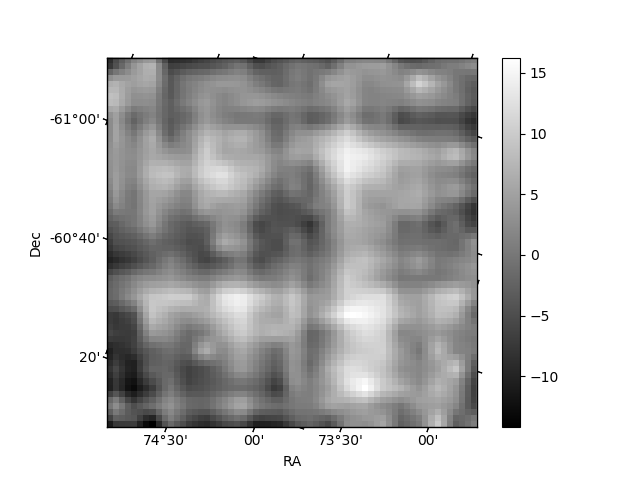
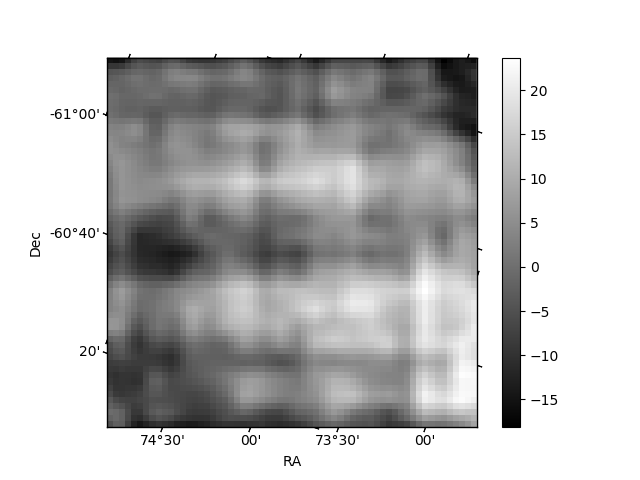
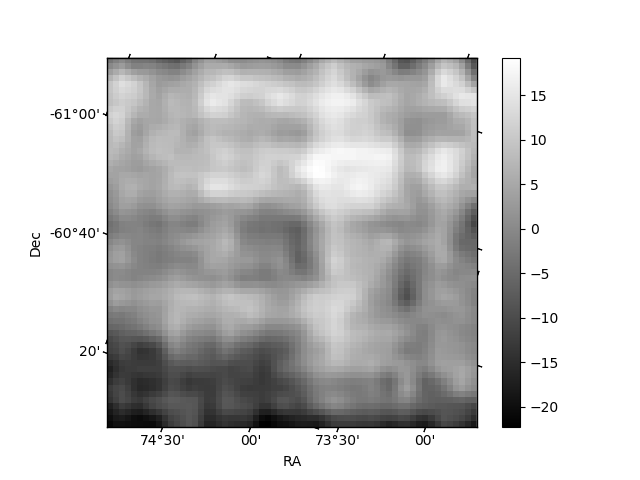
Histogram calculated using DETX and DETY for each event in the final _common_clean file
| Quadrant A | 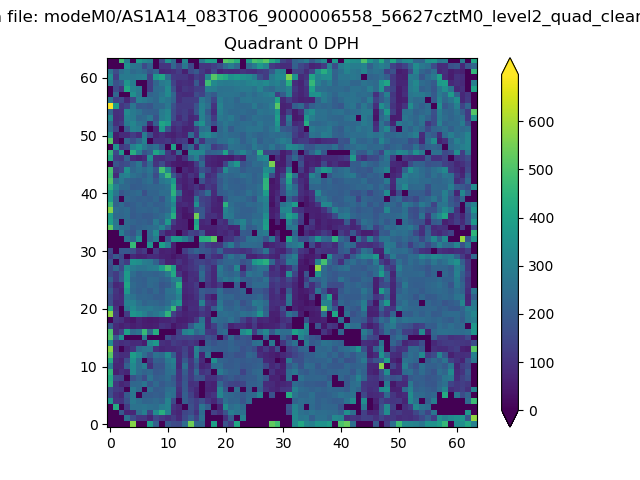 |
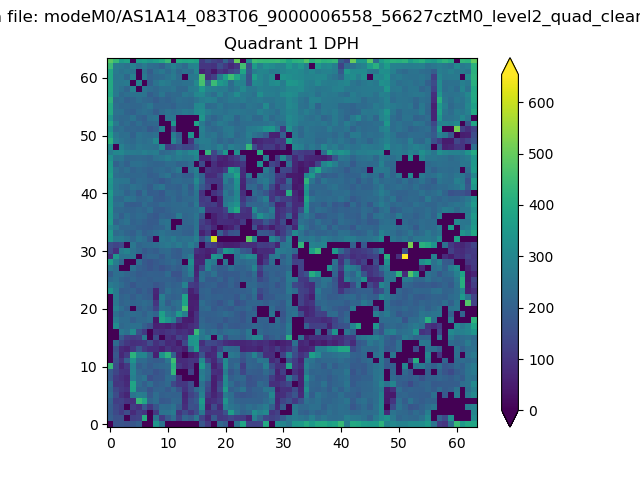 |
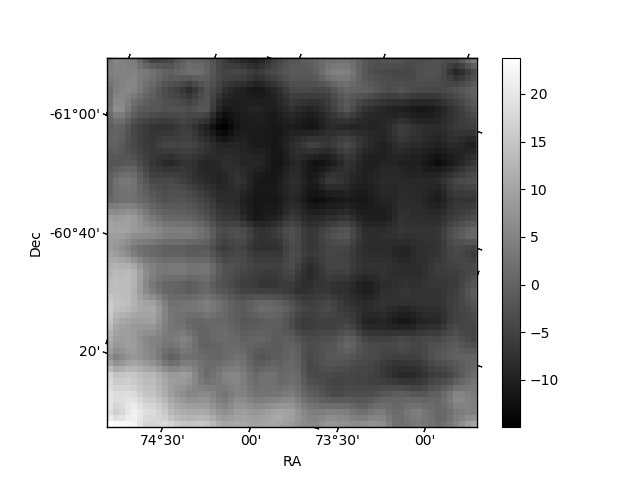
Quadrant B |
|---|---|---|---|
| Quadrant D | 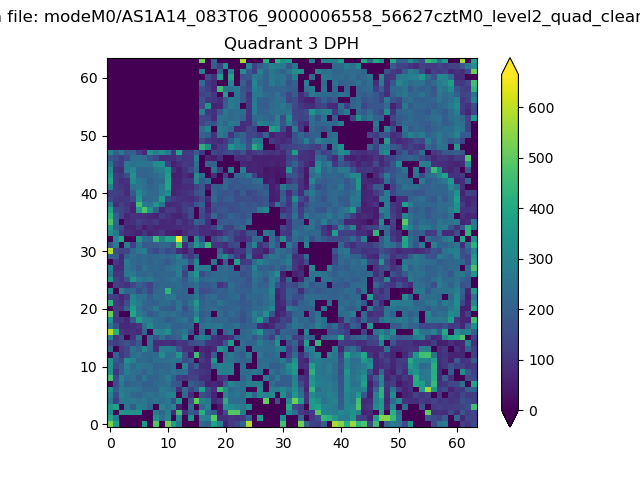 |
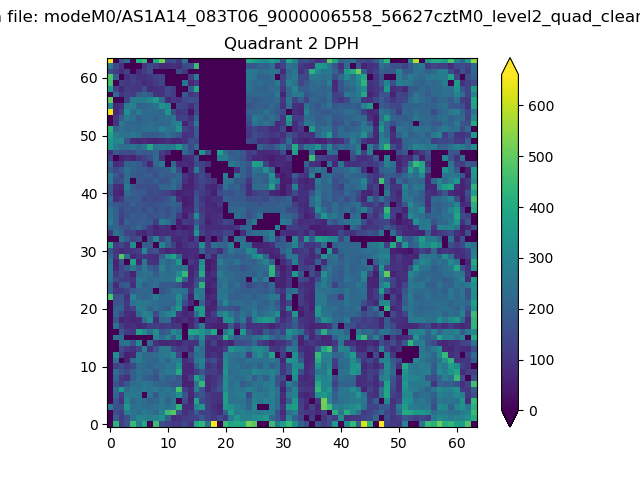 |
Quadrant C |
| Plot type | Count rate plots | Images |
|---|---|---|
| Comparison with Poisson distribution Blue bars denote a histogram of data divided into 1 sec bins. Red curve is a Poisson curve with rate = median count rate of data. |
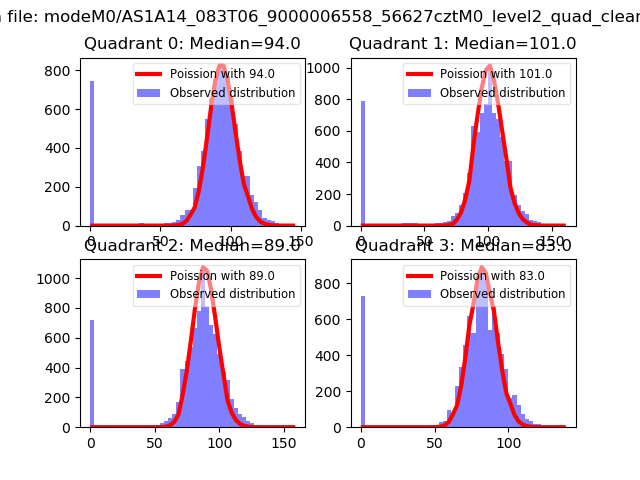 |
 |
| Quadrant-wise count rates Data is divided into 100 sec bins |
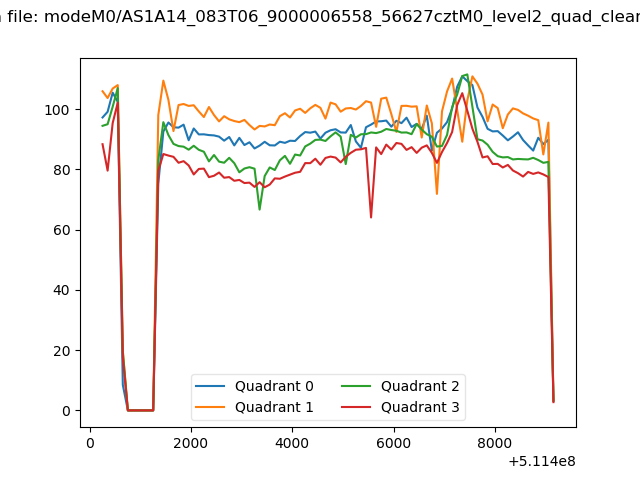 |
|
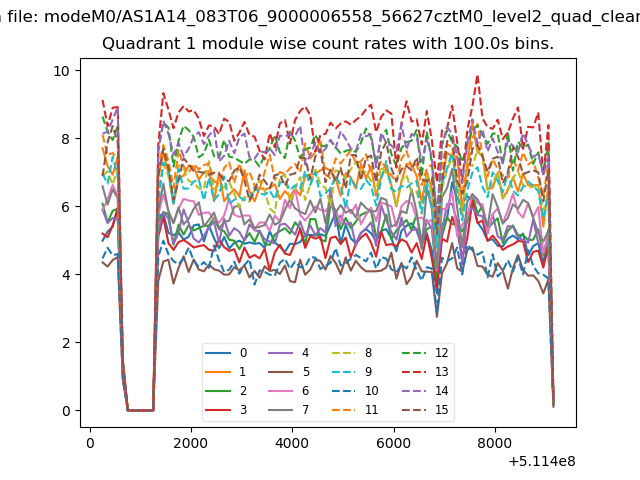
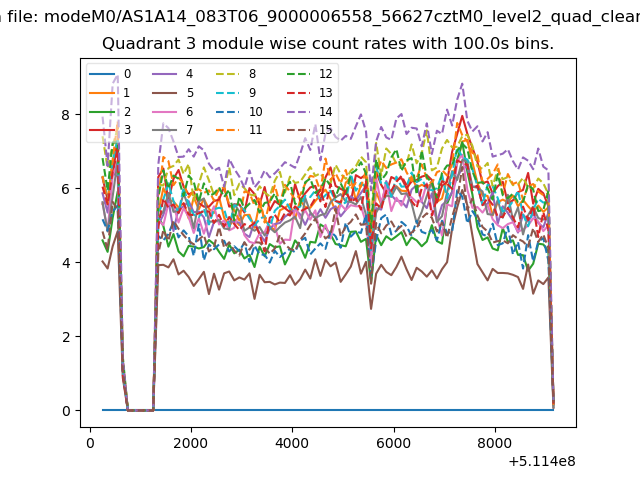
| Module-wise count rates for Quadrant A Data is divided into 100 sec bins |
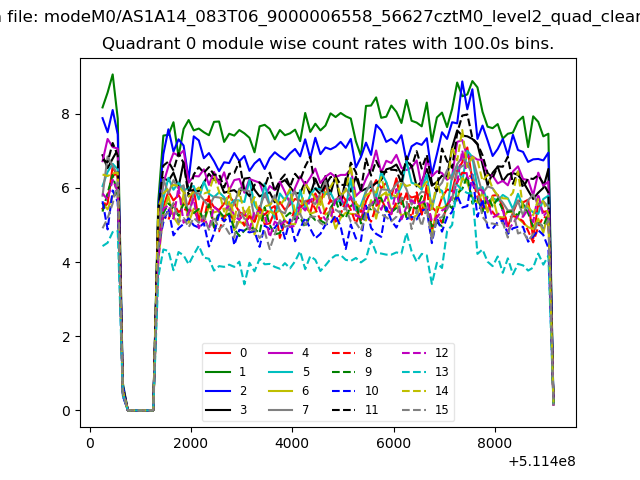 |
 |
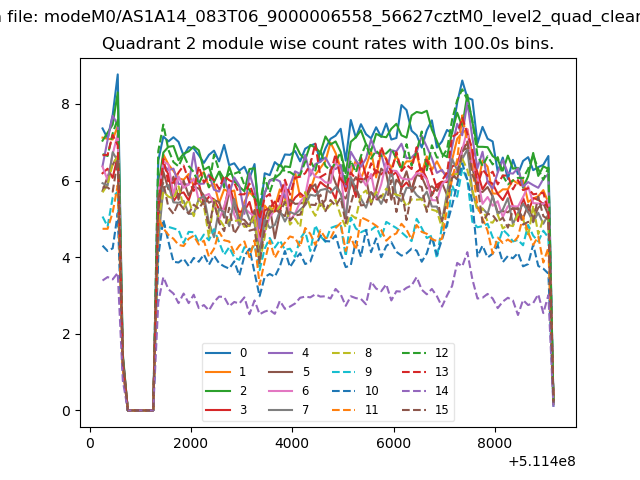
| Module-wise count rates for Quadrant B Data is divided into 100 sec bins |
 |
 |
| Module-wise count rates for Quadrant C Data is divided into 100 sec bins |
 |
 |
| Module-wise count rates for Quadrant D Data is divided into 100 sec bins |
 |
 |
| Parameter | Plot |
|---|---|
| CZT HV Monitor | 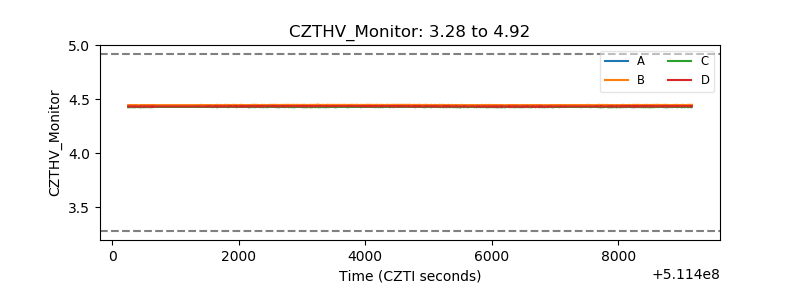 |
| D_VDD | 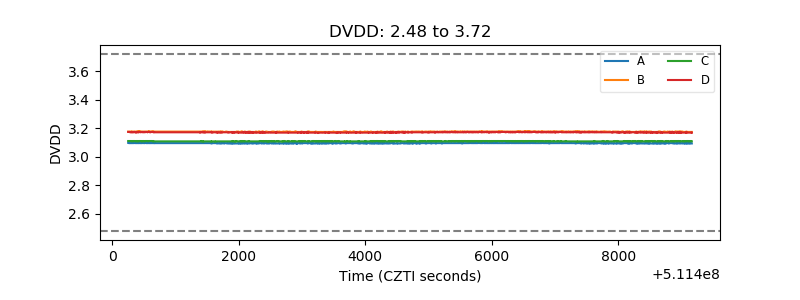 |
| Temperature 1 | 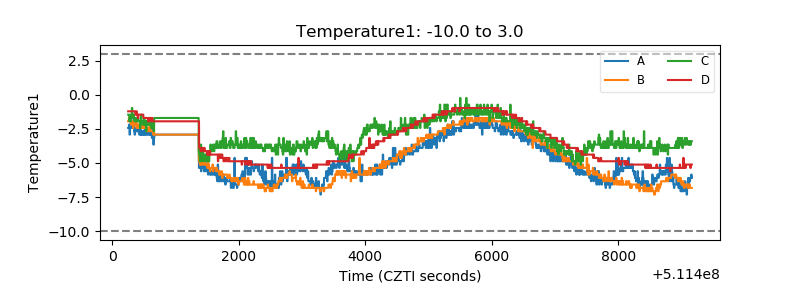 |
| Veto HV Monitor | 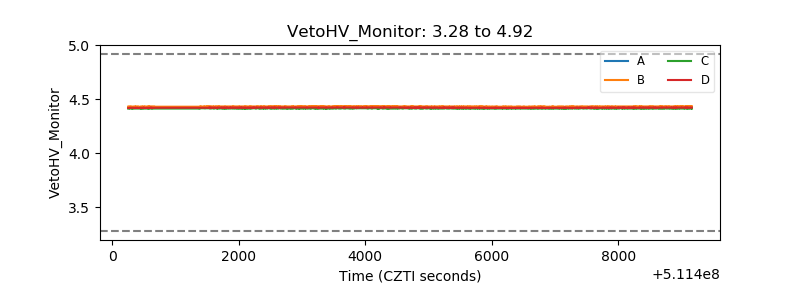 |
| Veto LLD | 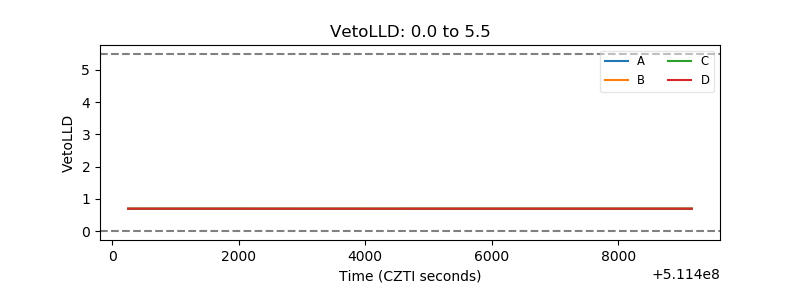 |
| Alpha Counter | 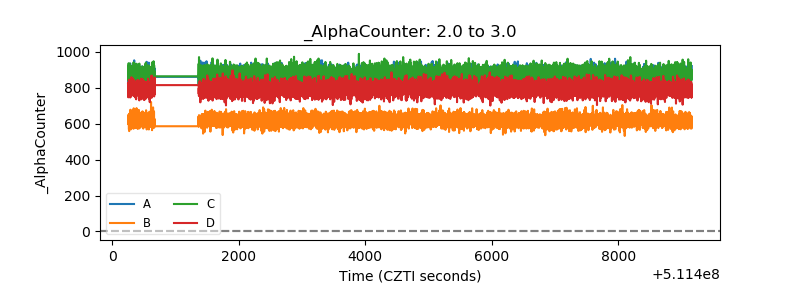 |
| _CPM_Rate | 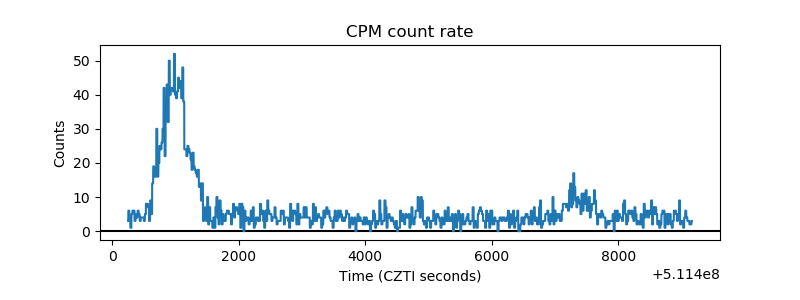 |
| CZT Counter | 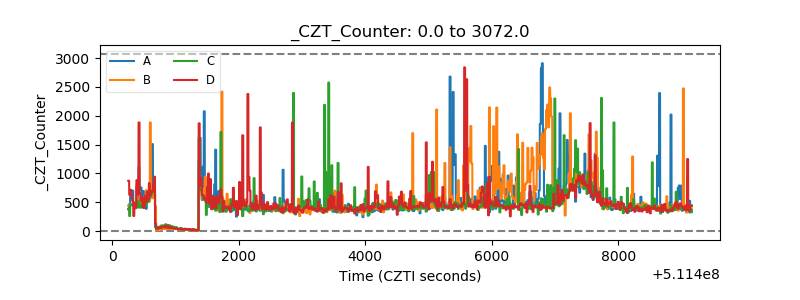 |
| +2.5 Volts monitor |  |
| +5 Volts monitor |  |
| _ROLL_ROT | 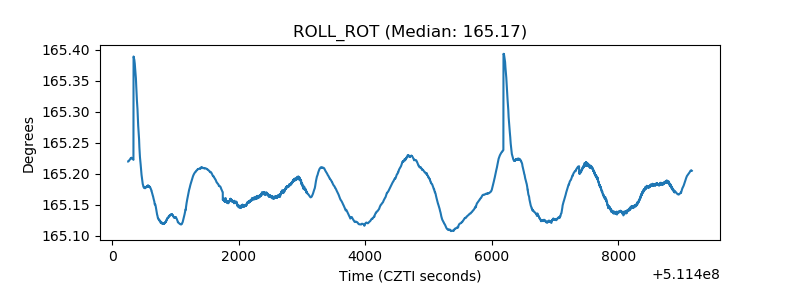 |
| _Roll_DEC | 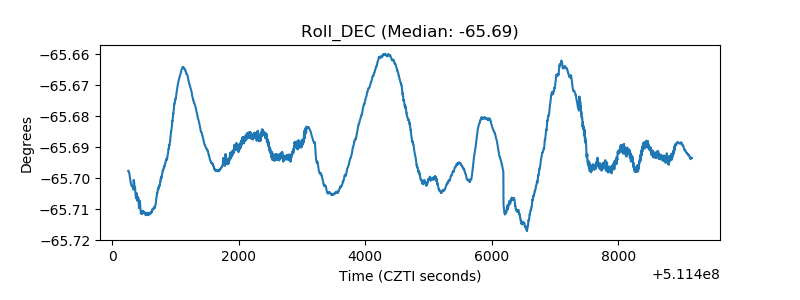 |
| _Roll_RA | 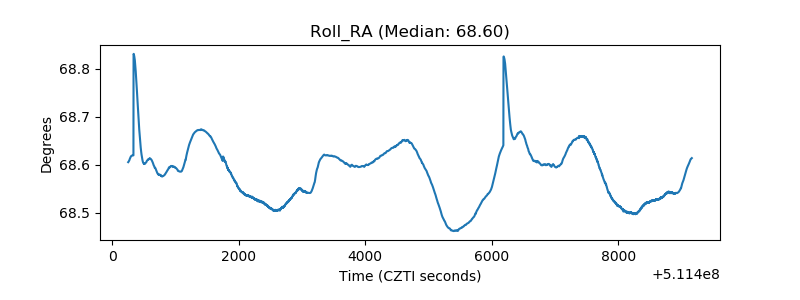 |
| Veto Counter | 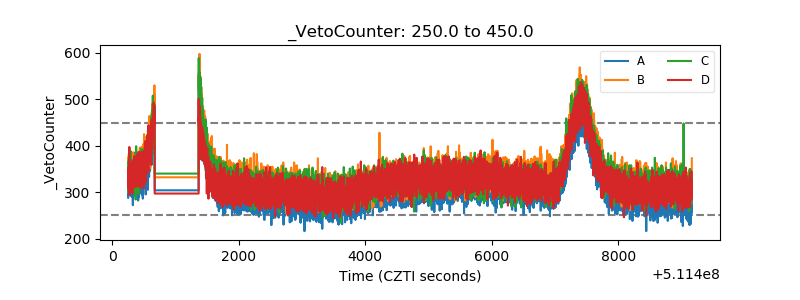 |