| Param | Original file | Final file |
|---|---|---|
| Filename | modeM0/AS1A14_083T06_9000006558_56628cztM0_level2.fits | modeM0/AS1A14_083T06_9000006558_56628cztM0_level2_quad_clean.evt |
| Size (bytes) | 519,410,880 | 126,763,200 |
| Size | 495.3 MB | 120.9 MB |
| Events in quadrant A | 4,889,158 | 824,193 |
| Events in quadrant B | 4,927,515 | 882,055 |
| Events in quadrant C | 4,252,757 | 783,314 |
| Events in quadrant D | 4,468,242 | 732,696 |
| Mode SS | |||
|---|---|---|---|
| Quadrant | BADHDUFLAG | Total packets | Discarded packets |
| A | 0 | 178 | 0 |
| B | 0 | 178 | 0 |
| C | 0 | 178 | 0 |
| D | 0 | 178 | 0 |
| Mode M0 | |||
|---|---|---|---|
| Quadrant | BADHDUFLAG | Total packets | Discarded packets |
| A | 0 | 21068 | 0 |
| B | 0 | 21085 | 0 |
| C | 0 | 19299 | 0 |
| D | 0 | 19785 | 0 |
| Quadrant | Total seconds | Saturated seconds | Saturation percentage |
|---|---|---|---|
| A | 8870 | 157 | 1.770011% |
| B | 8871 | 307 | 3.460715% |
| C | 8871 | 52 | 0.586180% |
| D | 8871 | 69 | 0.777815% |
Noise dominated data is calculated using 1-second bins in cleaned event files. If a bin has >2000 counts, and if more than 50% of those come from <1% of pixels, then it is considered to be noise-dominated and hence unusable.
| Quadrant | # 1 sec bins | Bins with >0 counts | Bins with >2000 counts | High rate bins dominated by noise | Noise dominated (total time) | Noise dominated (detector-on time) | Marked lightcurve |
|---|---|---|---|---|---|---|---|
| A | 8870 | 8870 | 82 | 82 | 0.92% | 0.92% | 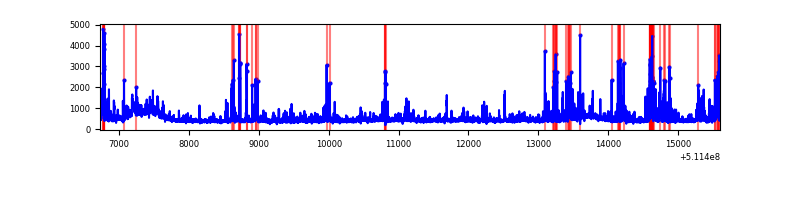 |
| B | 8871 | 8871 | 112 | 112 | 1.26% | 1.26% | 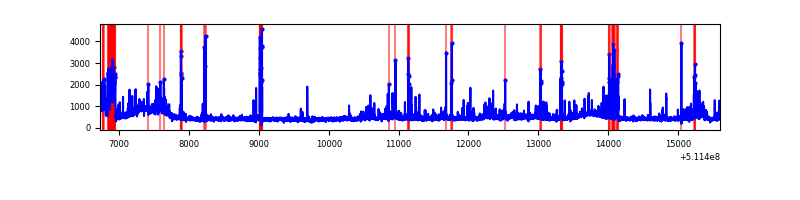 |
| C | 8871 | 8871 | 23 | 23 | 0.26% | 0.26% | 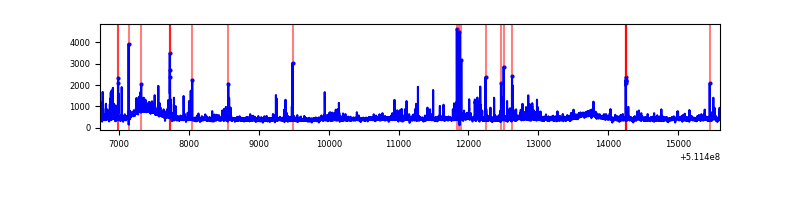 |
| D | 8871 | 8871 | 56 | 56 | 0.63% | 0.63% | 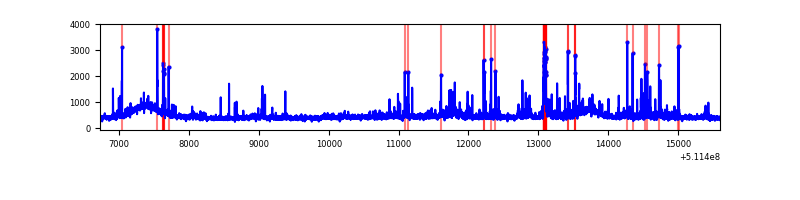 |
Top three noisy pixels from each quadrant. If the there are fewer than three noisy pixels in the level2.evt file, extra rows are filled as -1
| Pixel properties | Quadrant properties | ||||||
|---|---|---|---|---|---|---|---|
| Quadrant | DetID | PixID | Counts | Sigma | Mean | Median | Sigma |
| A | 10 | 251 | 432800 | 1848.52 | 958 | 937 | 233.6 |
| A | 7 | 64 | 302081 | 1289.0 | 958 | 937 | 233.6 |
| A | 4 | 95 | 142732 | 606.93 | 958 | 937 | 233.6 |
| B | 8 | 128 | 439997 | 2119.02 | 955 | 916 | 207.2 |
| B | 0 | 231 | 201741 | 969.19 | 955 | 916 | 207.2 |
| B | 10 | 247 | 147627 | 708.03 | 955 | 916 | 207.2 |
| C | 13 | 3 | 187678 | 734.47 | 939 | 930 | 254.3 |
| C | 1 | 16 | 153634 | 600.58 | 939 | 930 | 254.3 |
| C | 12 | 252 | 98447 | 383.53 | 939 | 930 | 254.3 |
| D | 7 | 96 | 146032 | 558.17 | 930 | 888 | 260.0 |
| D | 5 | 113 | 122141 | 466.3 | 930 | 888 | 260.0 |
| D | 3 | 12 | 112509 | 429.26 | 930 | 888 | 260.0 |
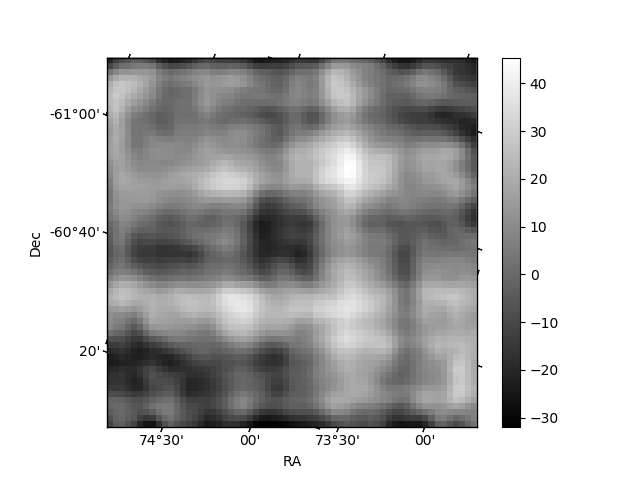
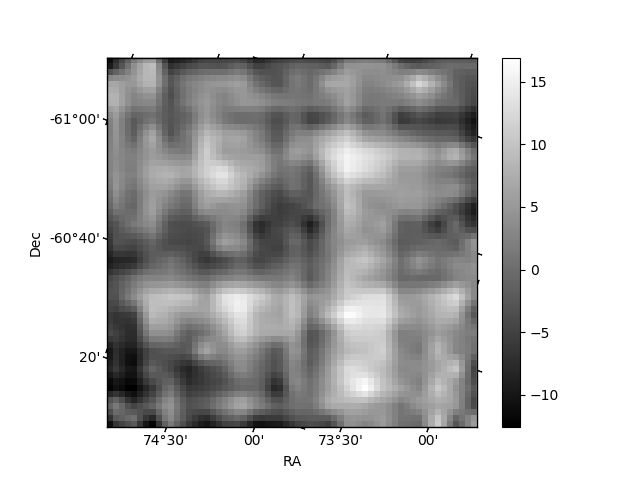
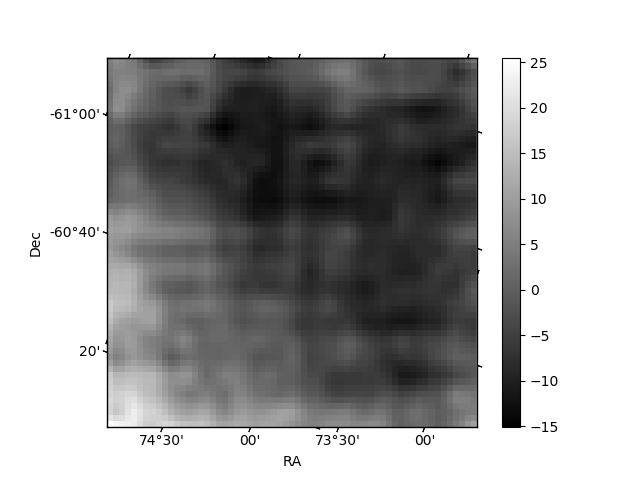
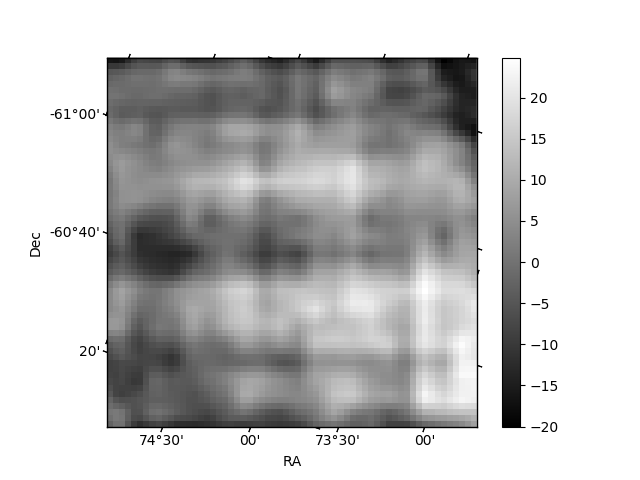
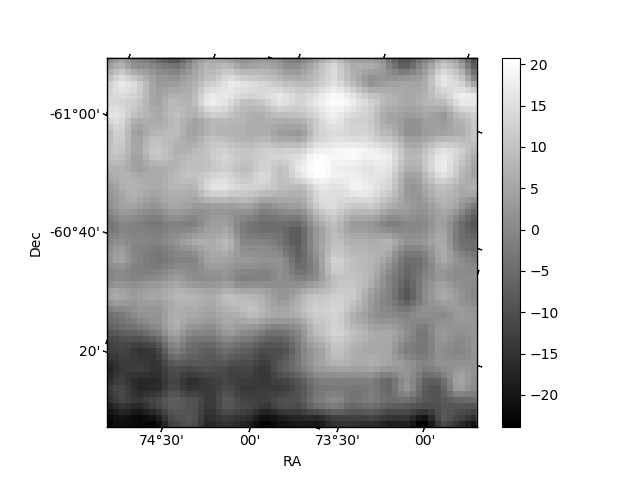
Histogram calculated using DETX and DETY for each event in the final _common_clean file
| Quadrant A | 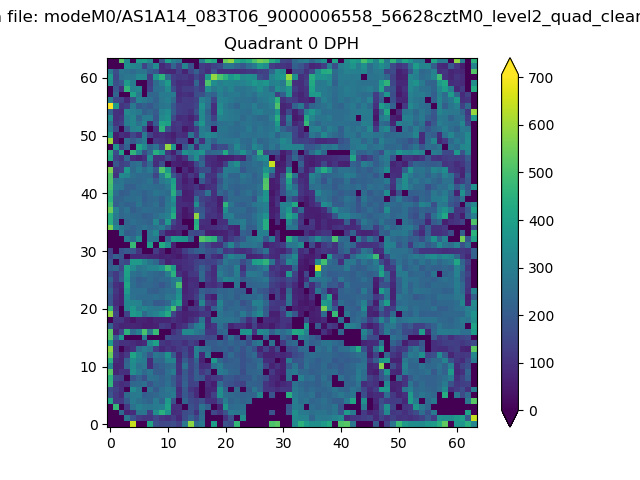 |
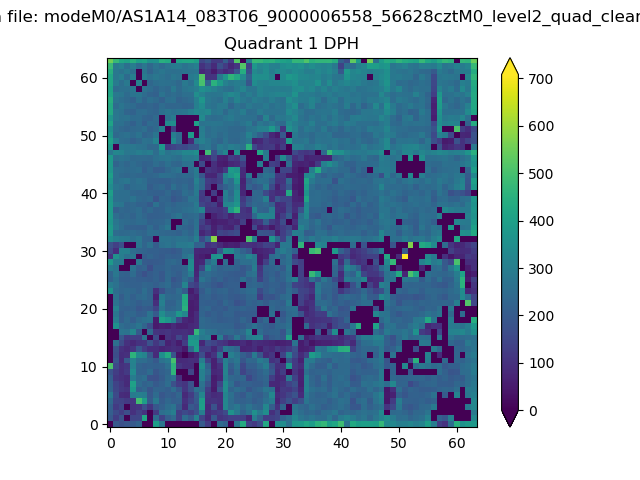 |
Quadrant B |
|---|---|---|---|
| Quadrant D | 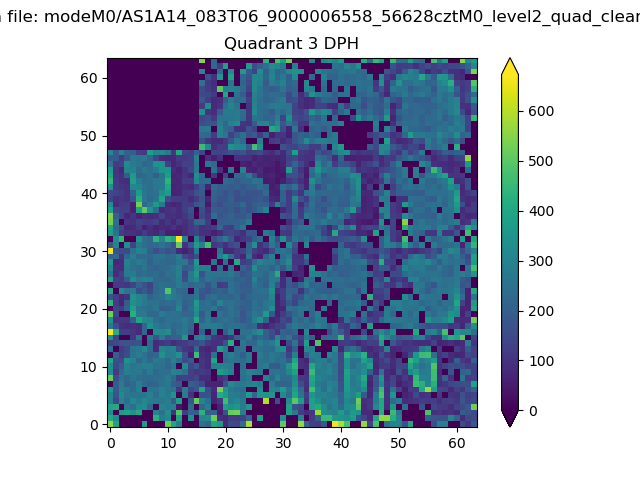 |
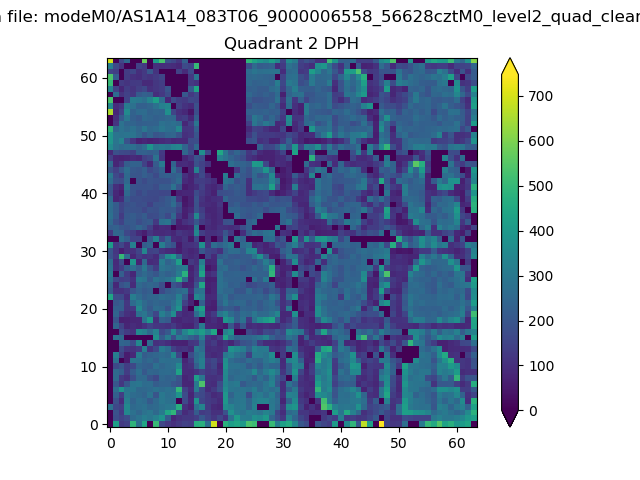 |
Quadrant C |
| Plot type | Count rate plots | Images |
|---|---|---|
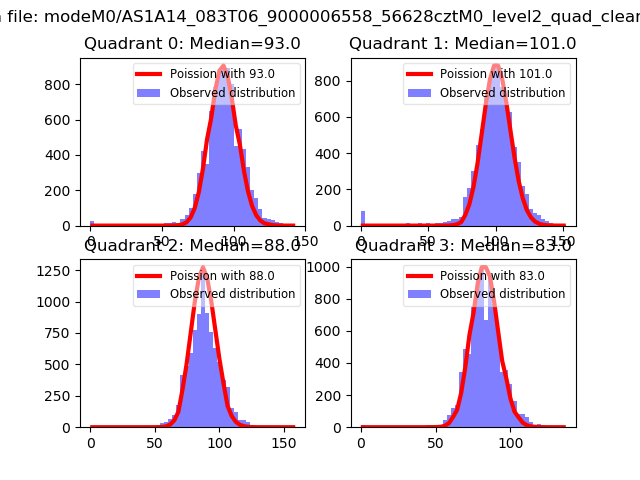
| Comparison with Poisson distribution Blue bars denote a histogram of data divided into 1 sec bins. Red curve is a Poisson curve with rate = median count rate of data. |
 |
 |
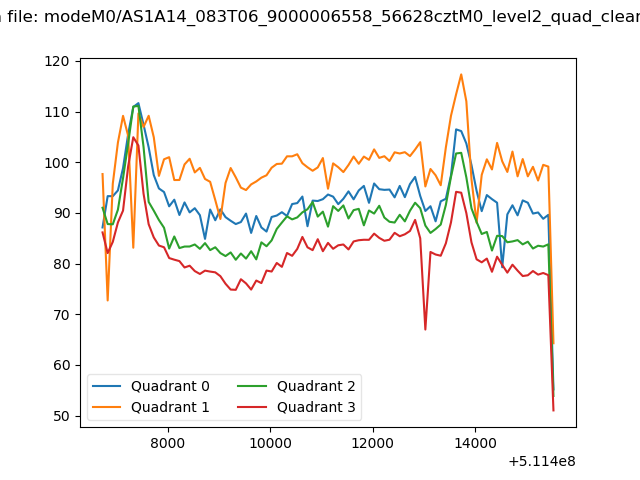
| Quadrant-wise count rates Data is divided into 100 sec bins |
 |
|
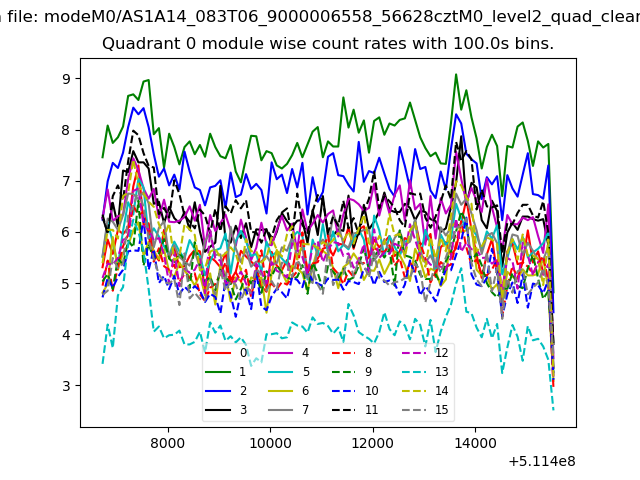
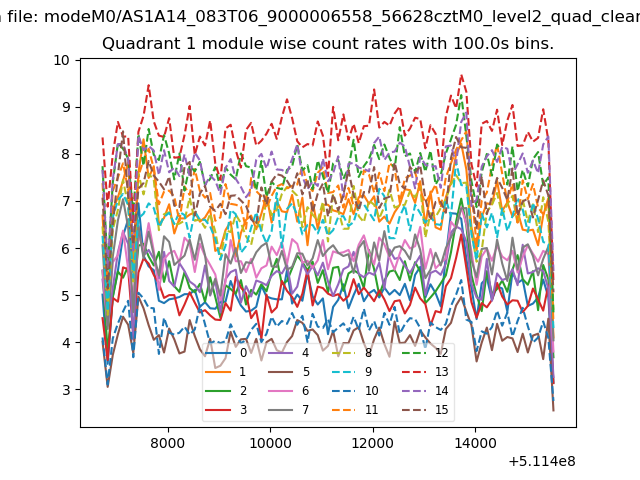
| Module-wise count rates for Quadrant A Data is divided into 100 sec bins |
 |
 |
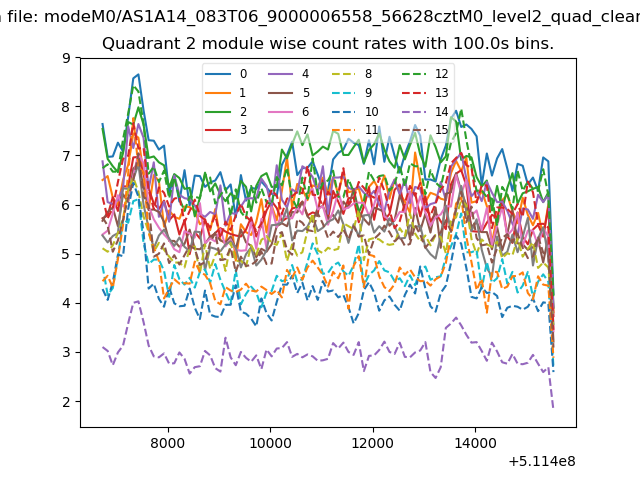
| Module-wise count rates for Quadrant B Data is divided into 100 sec bins |
 |
 |
| Module-wise count rates for Quadrant C Data is divided into 100 sec bins |
 |
 |
| Module-wise count rates for Quadrant D Data is divided into 100 sec bins |
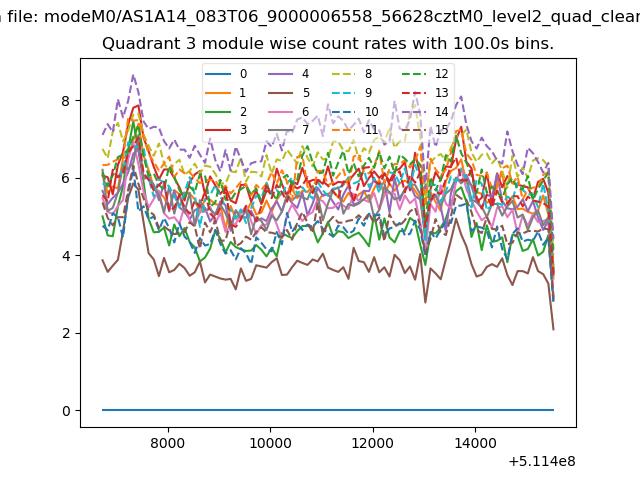 |
 |
| Parameter | Plot |
|---|---|
| CZT HV Monitor | 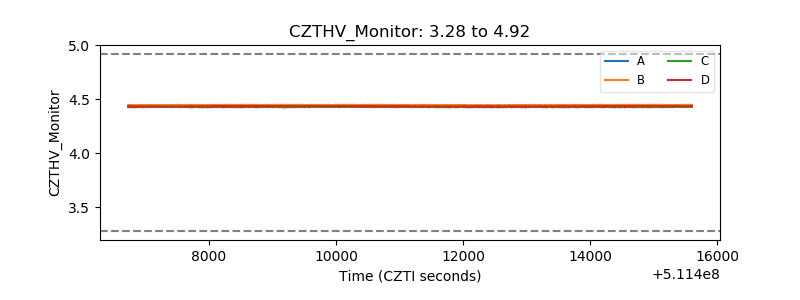 |
| D_VDD | 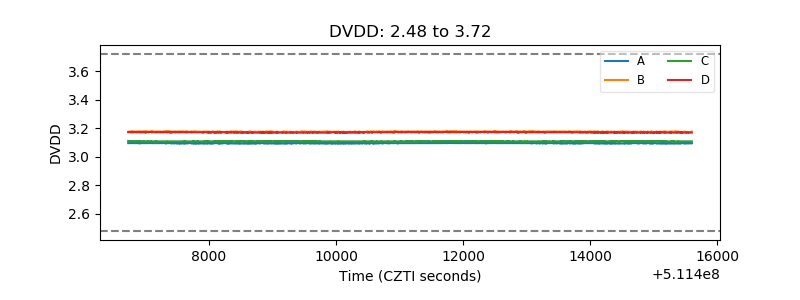 |
| Temperature 1 | 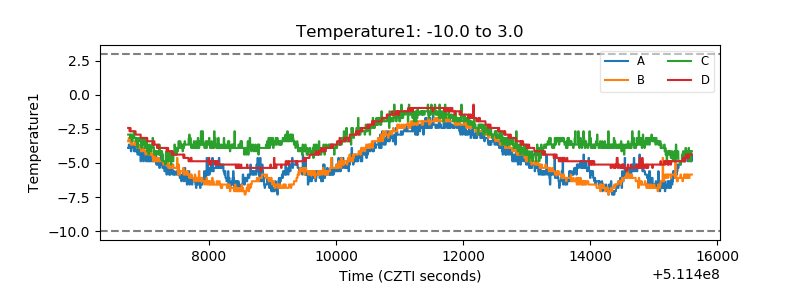 |
| Veto HV Monitor | 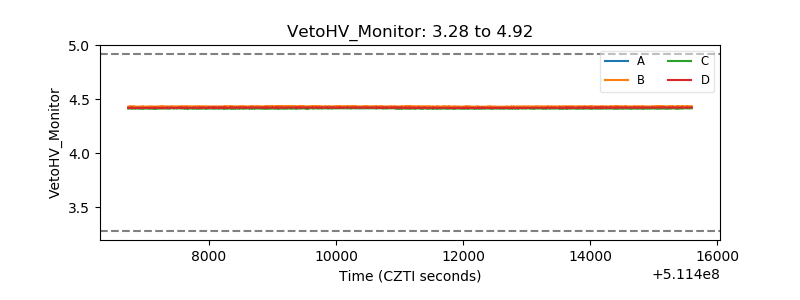 |
| Veto LLD | 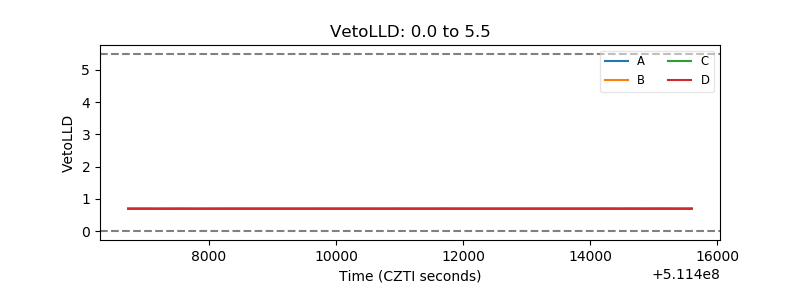 |
| Alpha Counter | 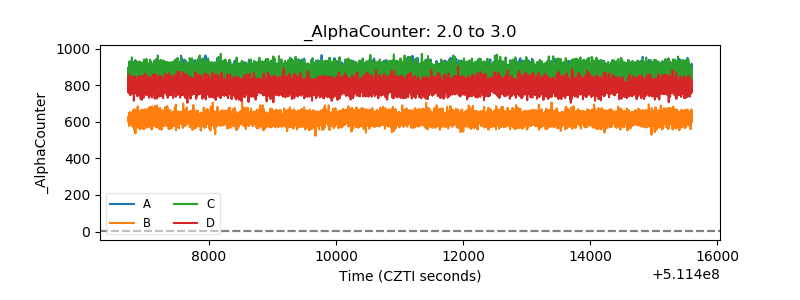 |
| _CPM_Rate | 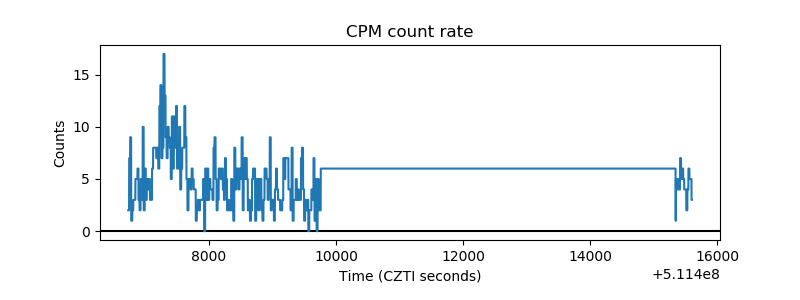 |
| CZT Counter | 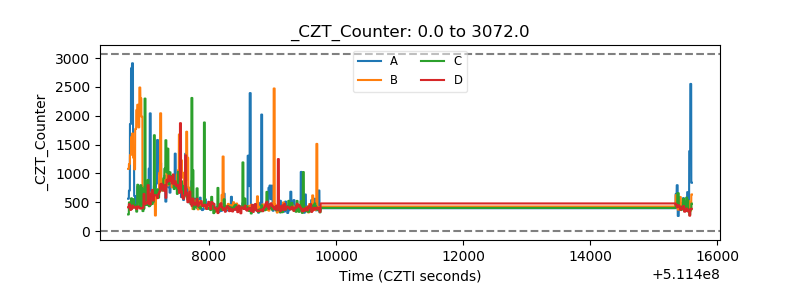 |
| +2.5 Volts monitor |  |
| +5 Volts monitor |  |
| _ROLL_ROT | 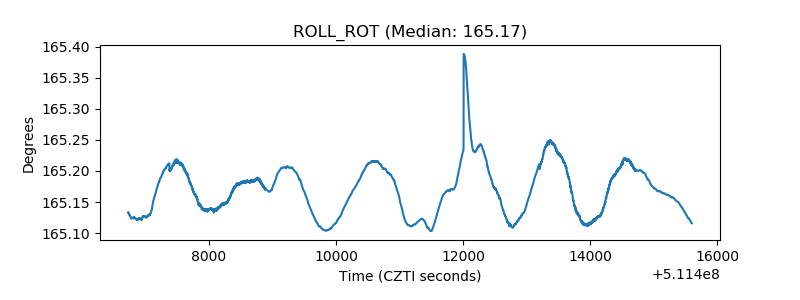 |
| _Roll_DEC | 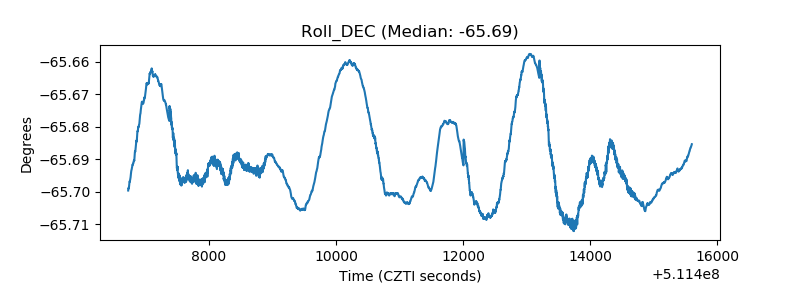 |
| _Roll_RA | 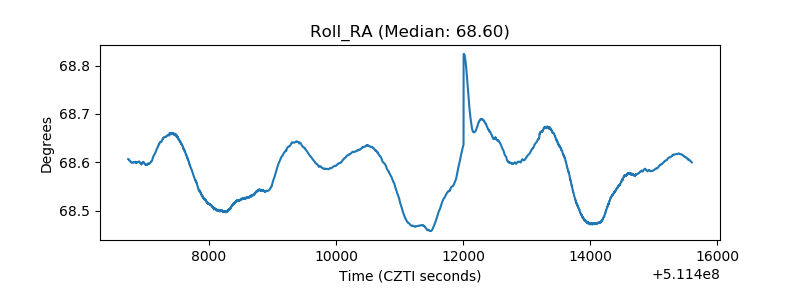 |
| Veto Counter | 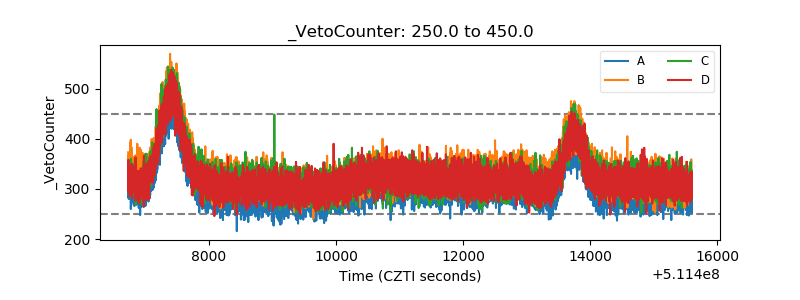 |