| Param | Original file | Final file |
|---|---|---|
| Filename | modeM0/AS1A14_083T06_9000006558_56629cztM0_level2.fits | modeM0/AS1A14_083T06_9000006558_56629cztM0_level2_quad_clean.evt |
| Size (bytes) | 577,886,400 | 119,243,520 |
| Size | 551.1 MB | 113.7 MB |
| Events in quadrant A | 6,076,296 | 758,355 |
| Events in quadrant B | 4,733,994 | 849,262 |
| Events in quadrant C | 5,120,625 | 711,689 |
| Events in quadrant D | 4,798,189 | 698,875 |
| Mode SS | |||
|---|---|---|---|
| Quadrant | BADHDUFLAG | Total packets | Discarded packets |
| A | 0 | 170 | 0 |
| B | 0 | 170 | 0 |
| C | 0 | 170 | 0 |
| D | 0 | 170 | 0 |
| Mode M0 | |||
|---|---|---|---|
| Quadrant | BADHDUFLAG | Total packets | Discarded packets |
| A | 0 | 24222 | 0 |
| B | 0 | 20165 | 0 |
| C | 0 | 21450 | 0 |
| D | 0 | 20437 | 0 |
| Quadrant | Total seconds | Saturated seconds | Saturation percentage |
|---|---|---|---|
| A | 8528 | 555 | 6.507974% |
| B | 8529 | 255 | 2.989800% |
| C | 8529 | 461 | 5.405089% |
| D | 8529 | 153 | 1.793880% |
Noise dominated data is calculated using 1-second bins in cleaned event files. If a bin has >2000 counts, and if more than 50% of those come from <1% of pixels, then it is considered to be noise-dominated and hence unusable.
| Quadrant | # 1 sec bins | Bins with >0 counts | Bins with >2000 counts | High rate bins dominated by noise | Noise dominated (total time) | Noise dominated (detector-on time) | Marked lightcurve |
|---|---|---|---|---|---|---|---|
| A | 8528 | 8528 | 430 | 430 | 5.04% | 5.04% | 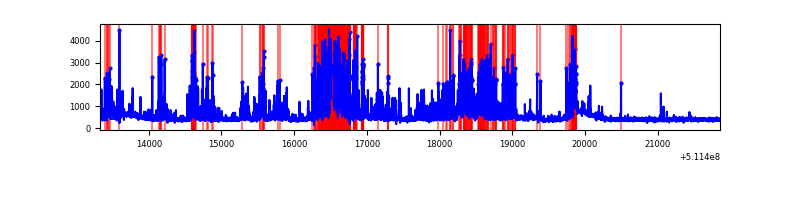 |
| B | 8529 | 8529 | 120 | 120 | 1.41% | 1.41% | 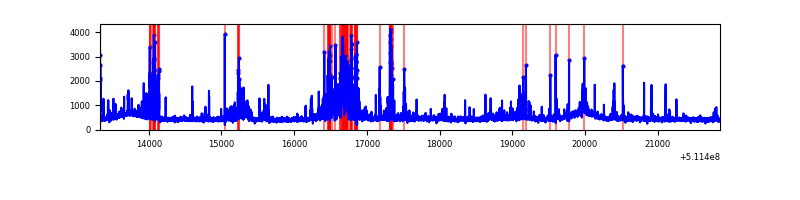 |
| C | 8529 | 8529 | 391 | 391 | 4.58% | 4.58% |  |
| D | 8529 | 8529 | 119 | 119 | 1.40% | 1.40% | 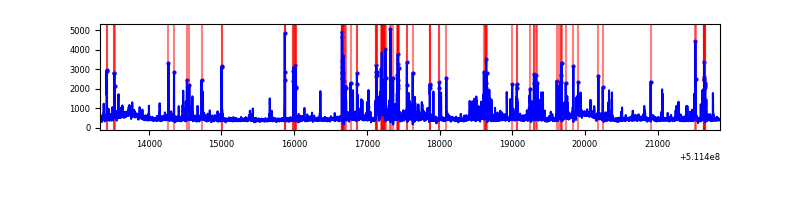 |
Top three noisy pixels from each quadrant. If the there are fewer than three noisy pixels in the level2.evt file, extra rows are filled as -1
| Pixel properties | Quadrant properties | ||||||
|---|---|---|---|---|---|---|---|
| Quadrant | DetID | PixID | Counts | Sigma | Mean | Median | Sigma |
| A | 10 | 251 | 1253114 | 5755.54 | 890 | 867 | 217.6 |
| A | 7 | 64 | 1114094 | 5116.58 | 890 | 867 | 217.6 |
| A | 13 | 248 | 147666 | 674.71 | 890 | 867 | 217.6 |
| B | 5 | 185 | 439773 | 2227.21 | 909 | 871 | 197.1 |
| B | 0 | 231 | 217902 | 1101.32 | 909 | 871 | 197.1 |
| B | 4 | 21 | 167870 | 847.44 | 909 | 871 | 197.1 |
| C | 15 | 230 | 1126657 | 4722.1 | 876 | 867 | 238.4 |
| C | 1 | 16 | 123915 | 516.12 | 876 | 867 | 238.4 |
| C | 6 | 223 | 104625 | 435.21 | 876 | 867 | 238.4 |
| D | 7 | 96 | 327163 | 1326.36 | 881 | 840 | 246.0 |
| D | 2 | 62 | 303929 | 1231.93 | 881 | 840 | 246.0 |
| D | 2 | 249 | 156958 | 634.55 | 881 | 840 | 246.0 |
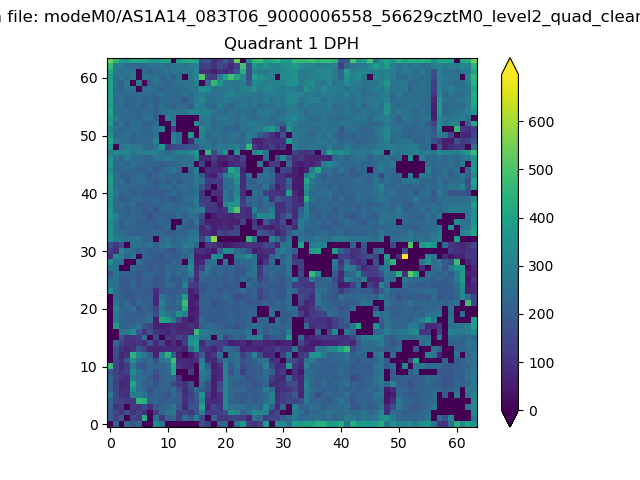
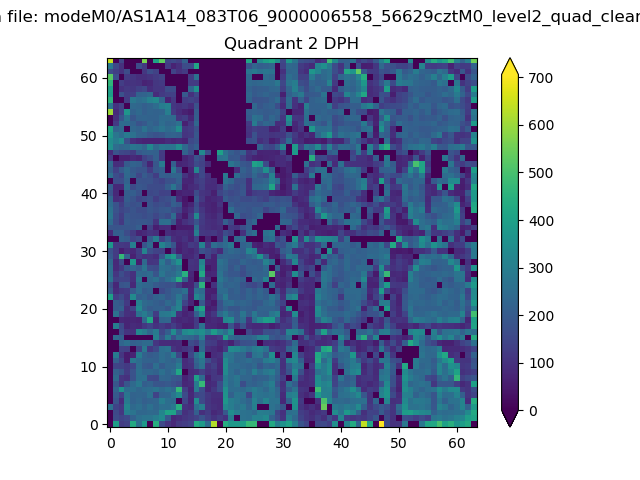
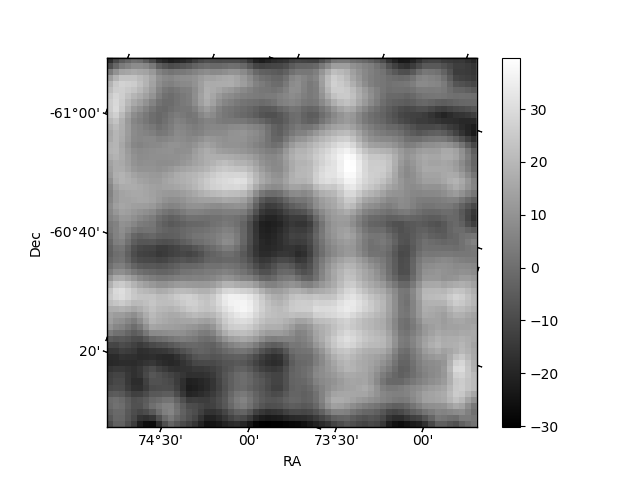
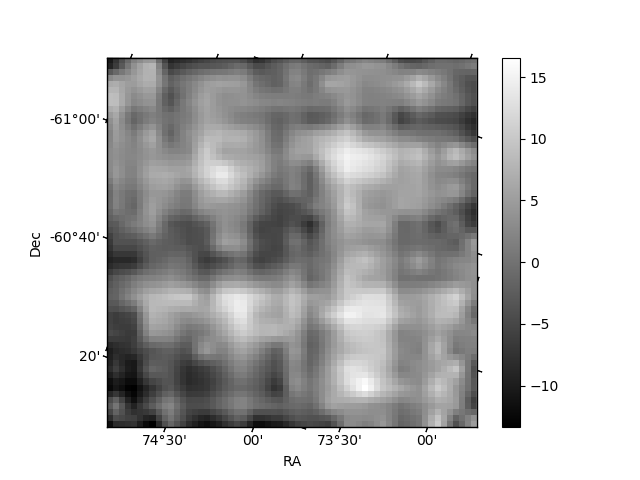
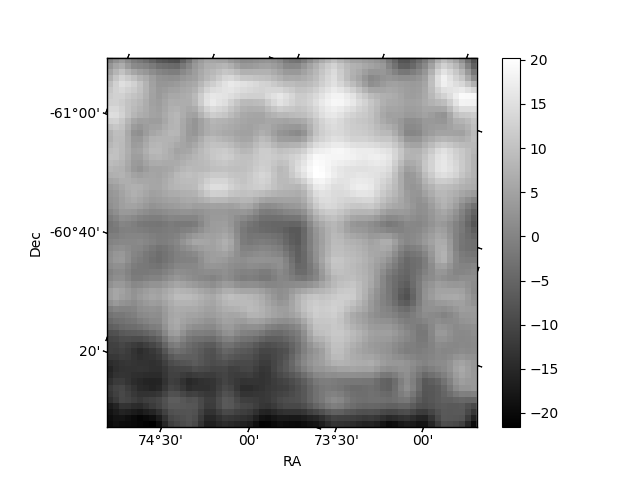
Histogram calculated using DETX and DETY for each event in the final _common_clean file
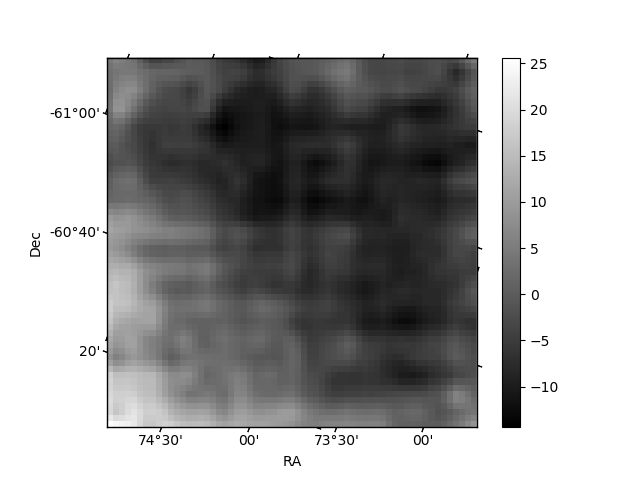
| Quadrant A | 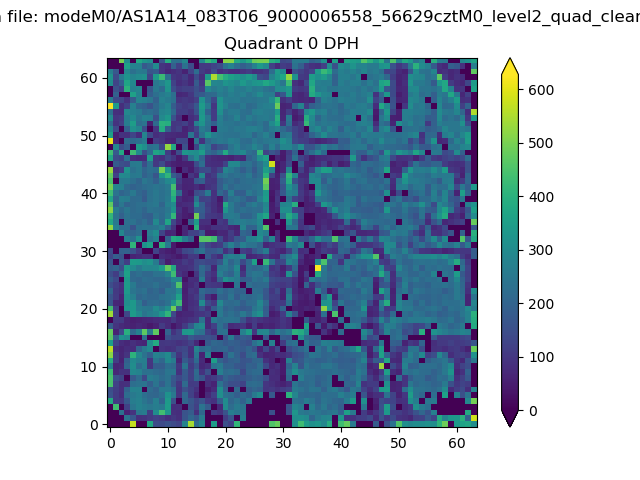 |
 |
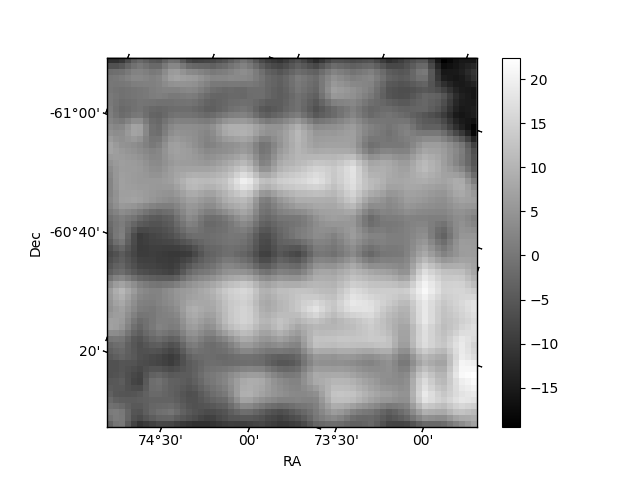
Quadrant B |
|---|---|---|---|
| Quadrant D | 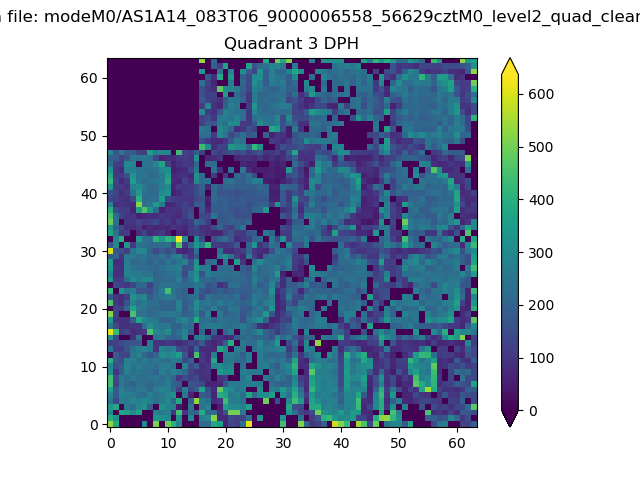 |
 |
Quadrant C |
| Plot type | Count rate plots | Images |
|---|---|---|
| Comparison with Poisson distribution Blue bars denote a histogram of data divided into 1 sec bins. Red curve is a Poisson curve with rate = median count rate of data. |
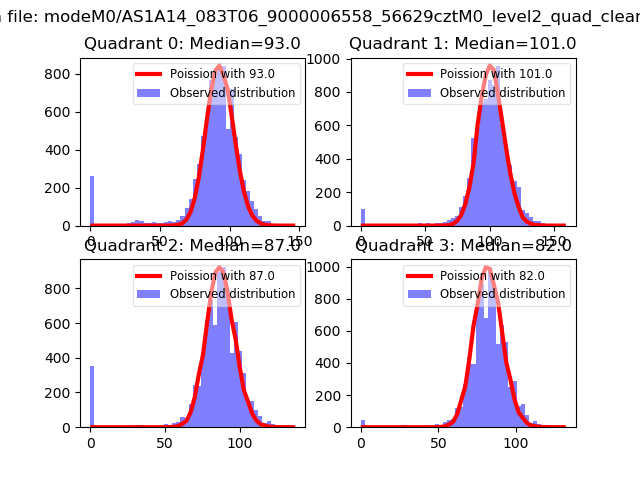 |
 |
| Quadrant-wise count rates Data is divided into 100 sec bins |
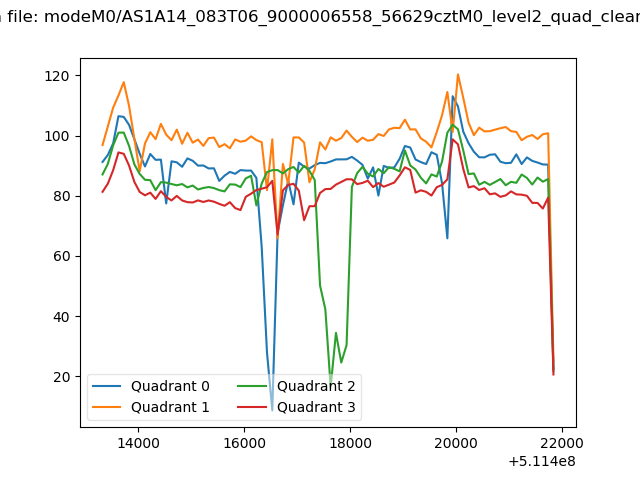 |
|
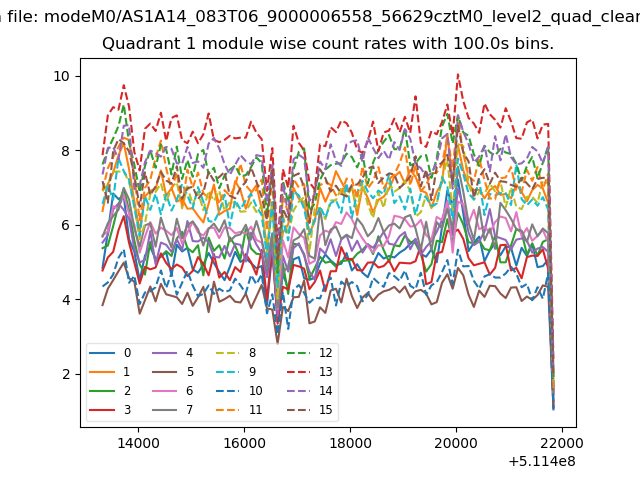
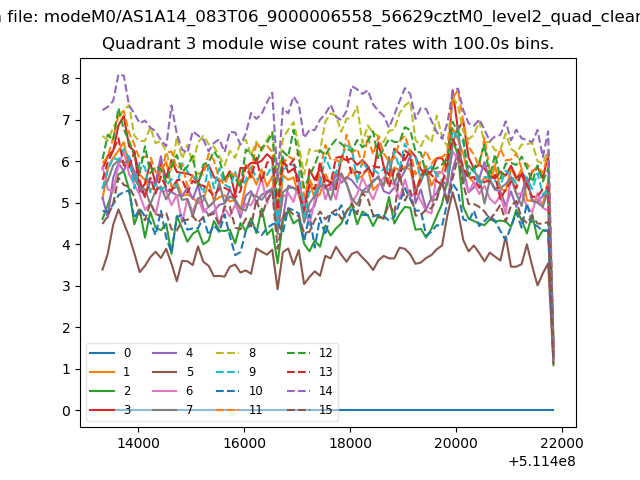
| Module-wise count rates for Quadrant A Data is divided into 100 sec bins |
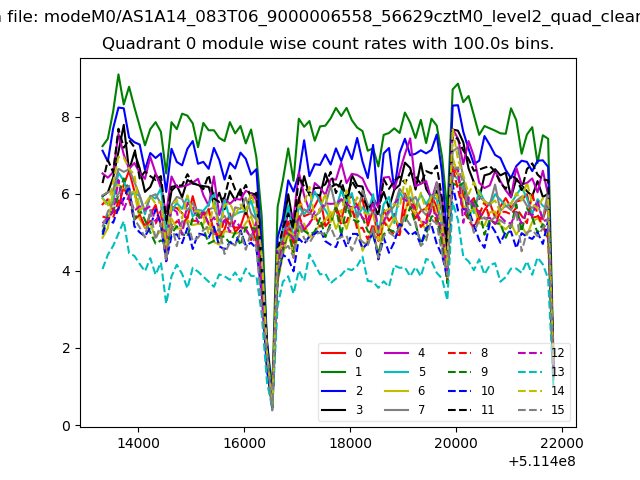 |
 |
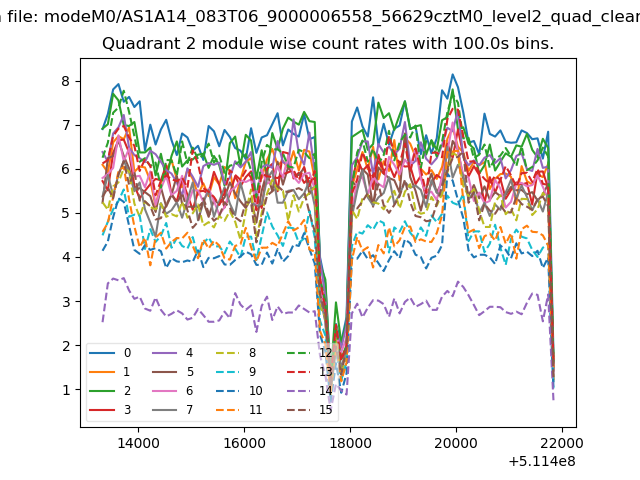
| Module-wise count rates for Quadrant B Data is divided into 100 sec bins |
 |
 |
| Module-wise count rates for Quadrant C Data is divided into 100 sec bins |
 |
 |
| Module-wise count rates for Quadrant D Data is divided into 100 sec bins |
 |
 |
| Parameter | Plot |
|---|---|
| CZT HV Monitor | 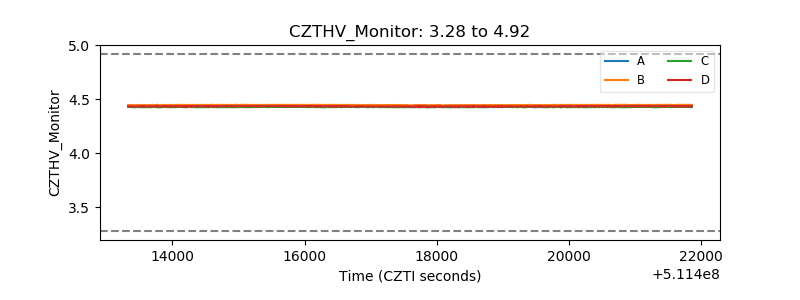 |
| D_VDD | 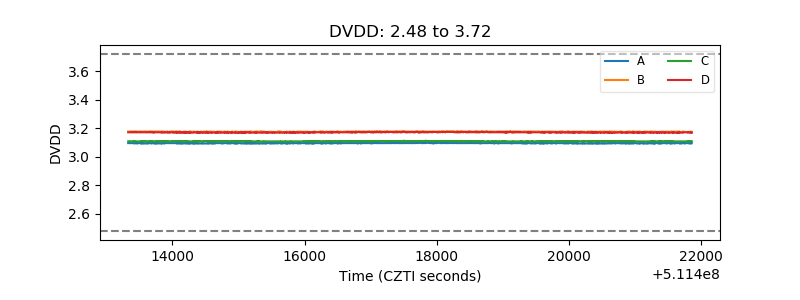 |
| Temperature 1 | 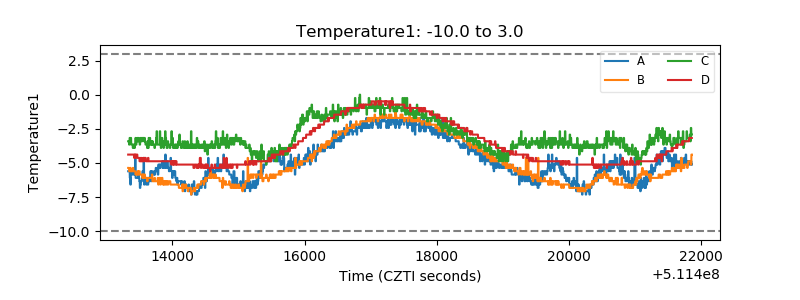 |
| Veto HV Monitor | 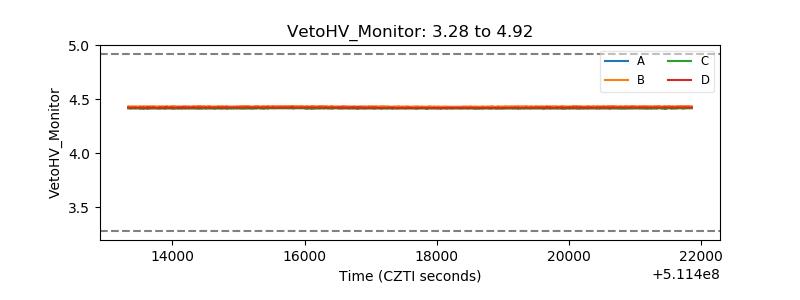 |
| Veto LLD | 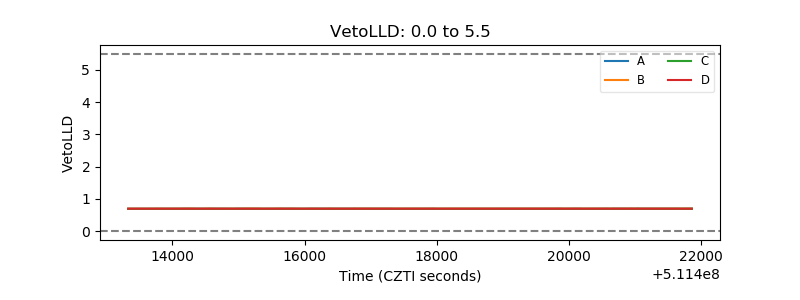 |
| Alpha Counter | 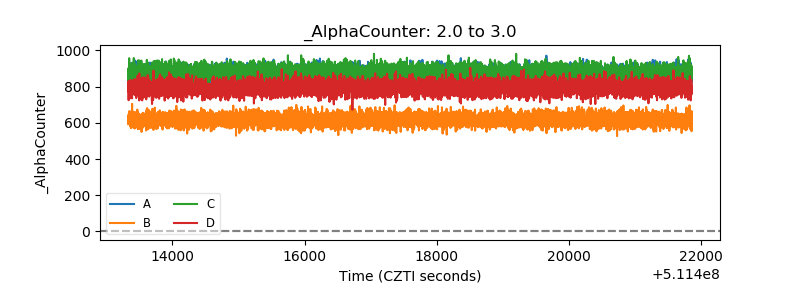 |
| _CPM_Rate | 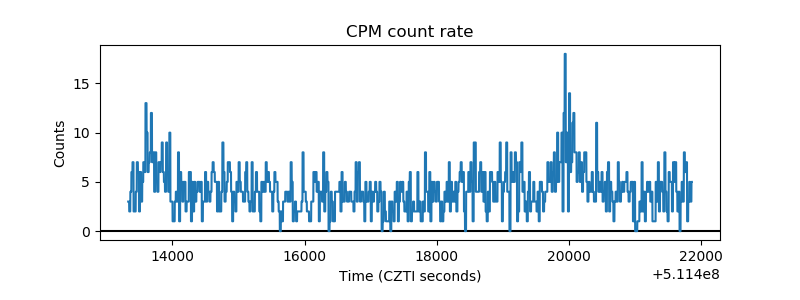 |
| CZT Counter | 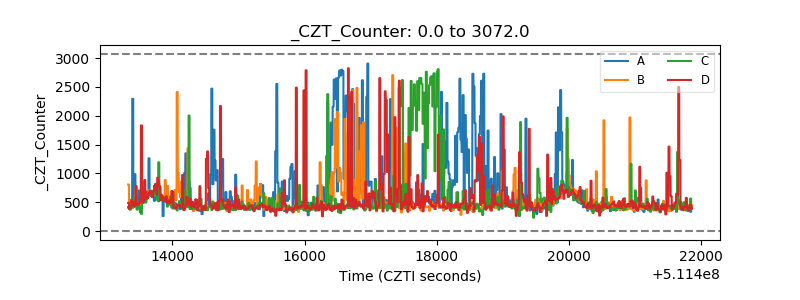 |
| +2.5 Volts monitor |  |
| +5 Volts monitor |  |
| _ROLL_ROT | 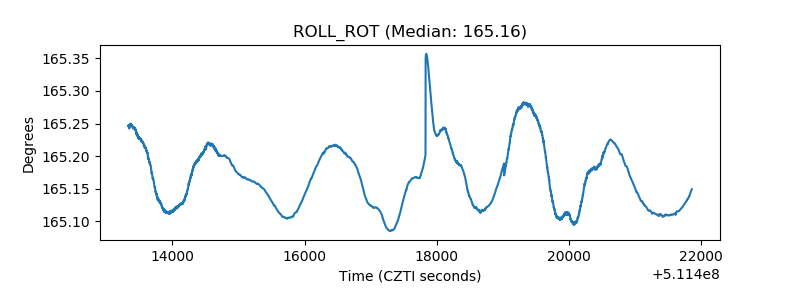 |
| _Roll_DEC | 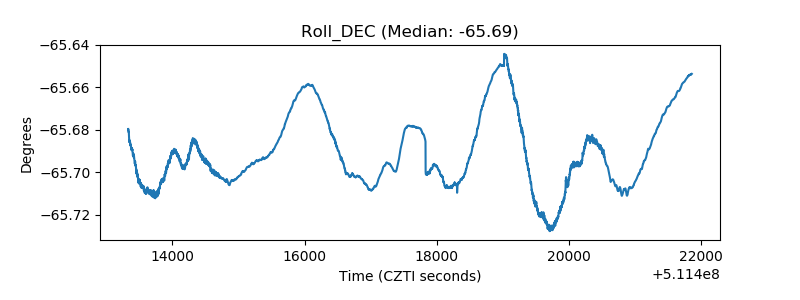 |
| _Roll_RA | 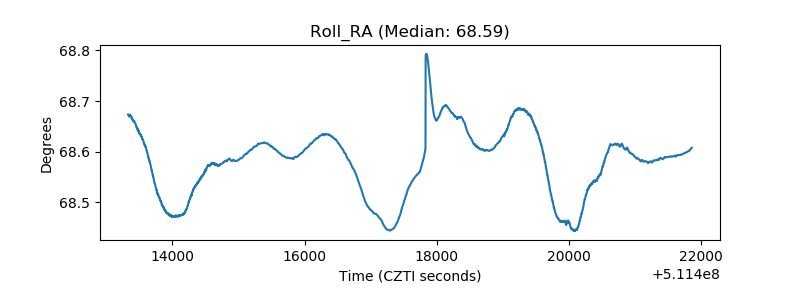 |
| Veto Counter | 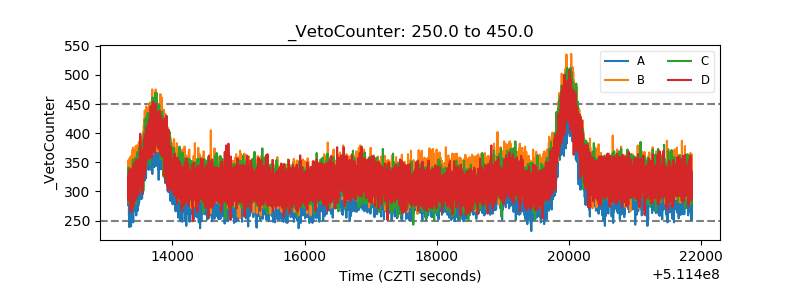 |